Gold Phase Detector
- Göstergeler
- Sürüm: 2.0
- Etkinleştirmeler: 5
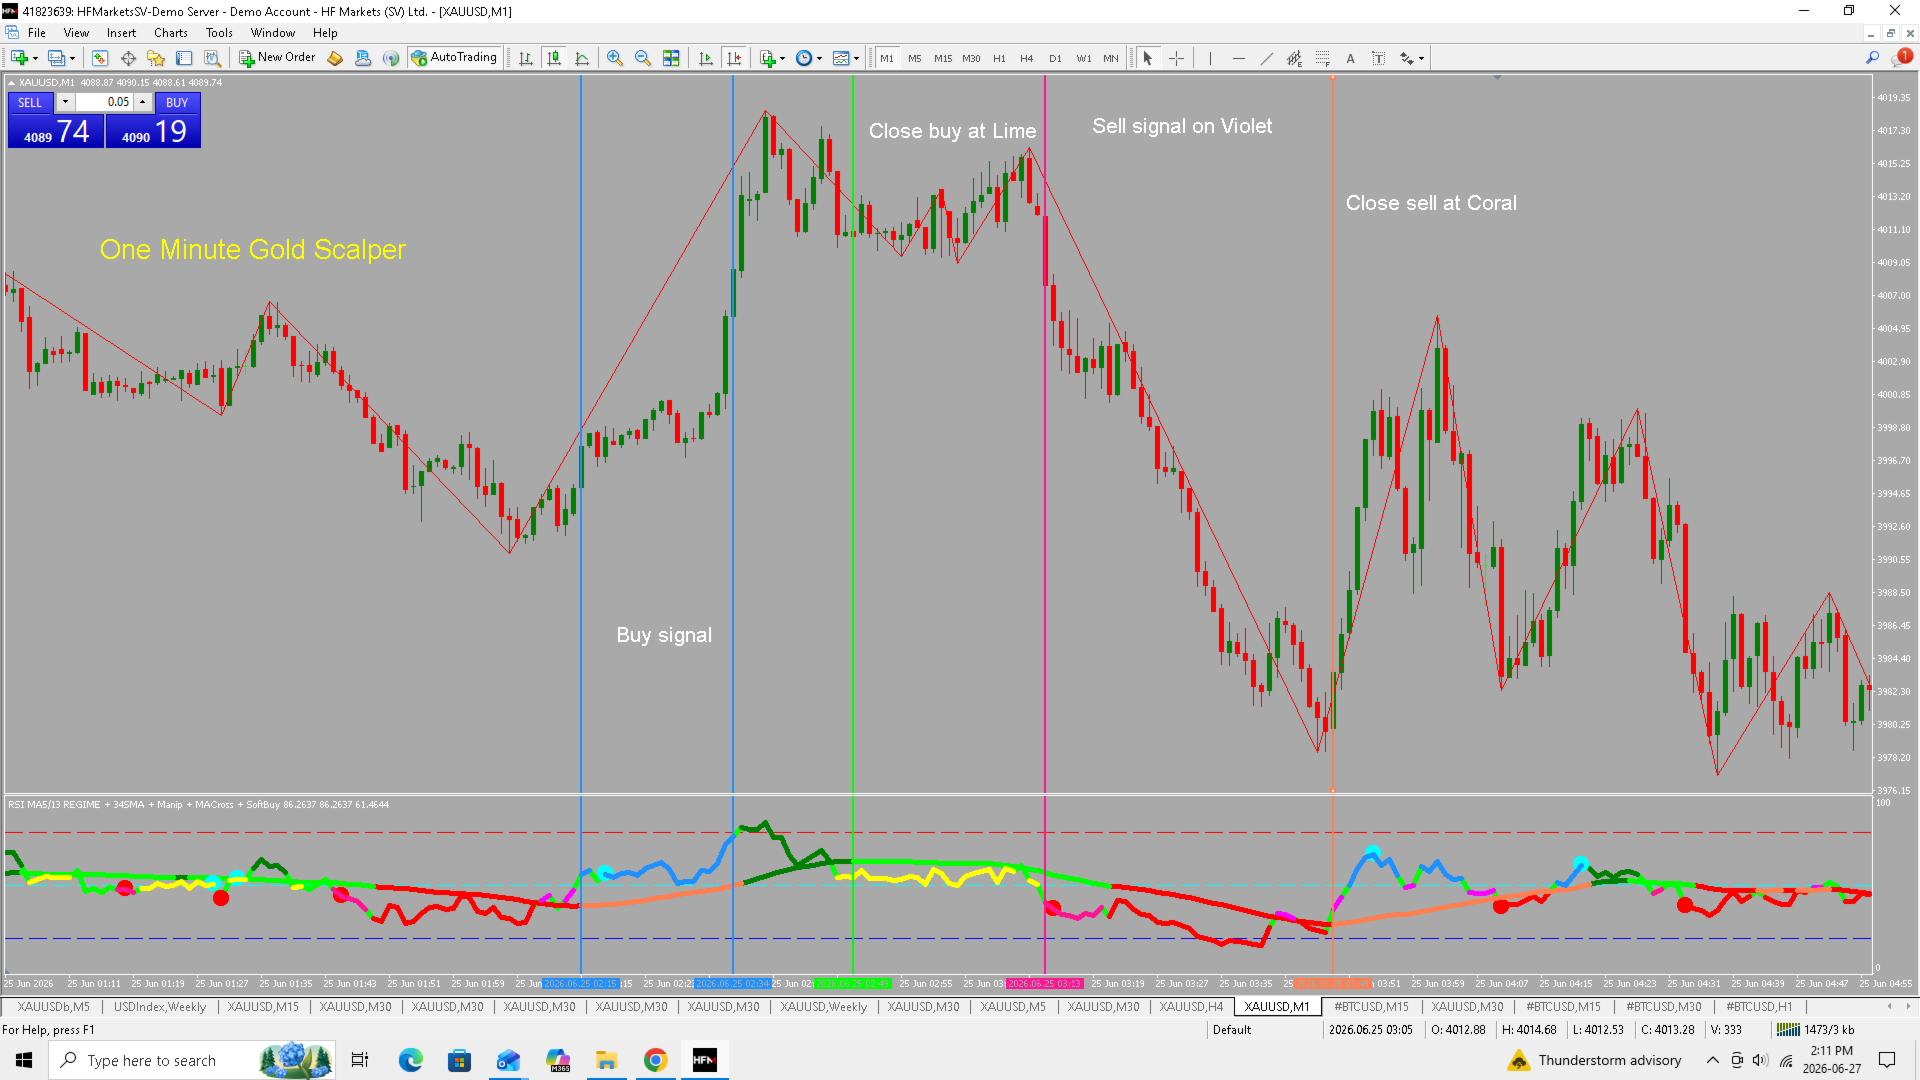
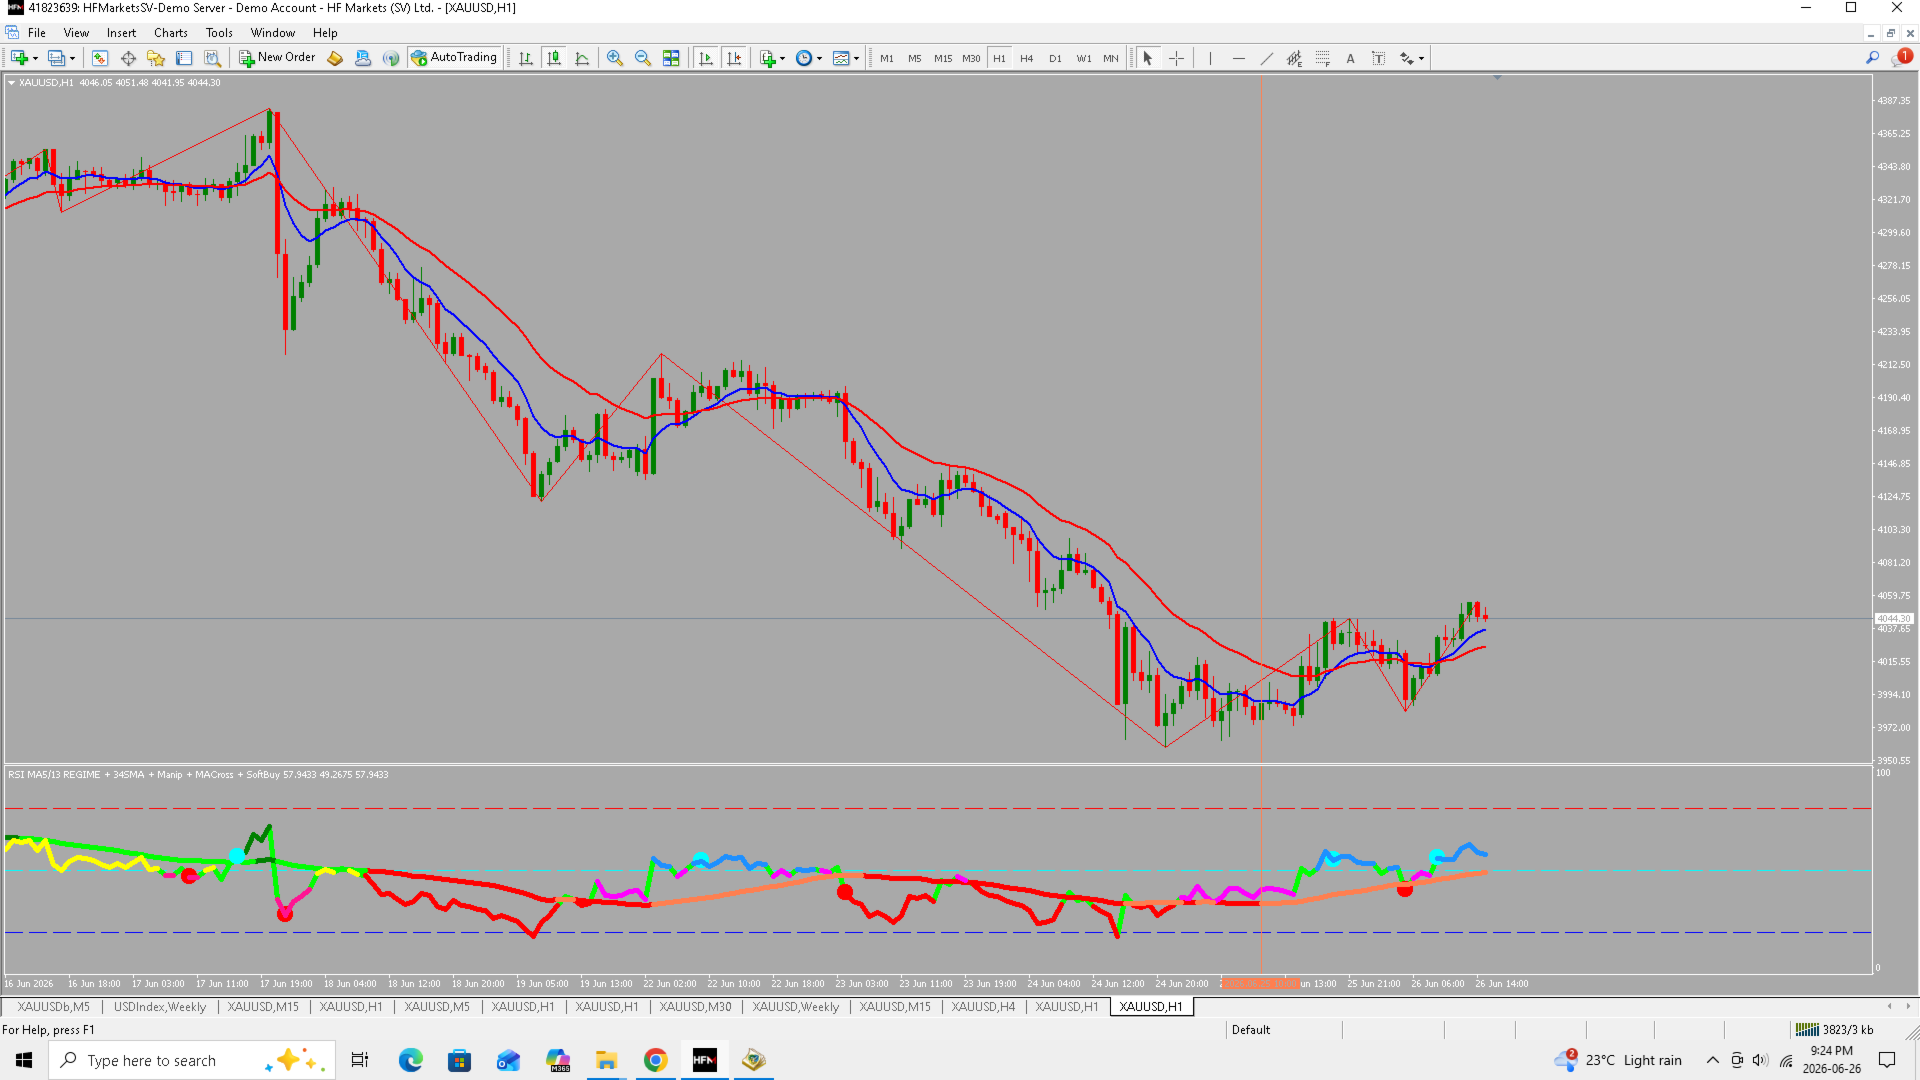
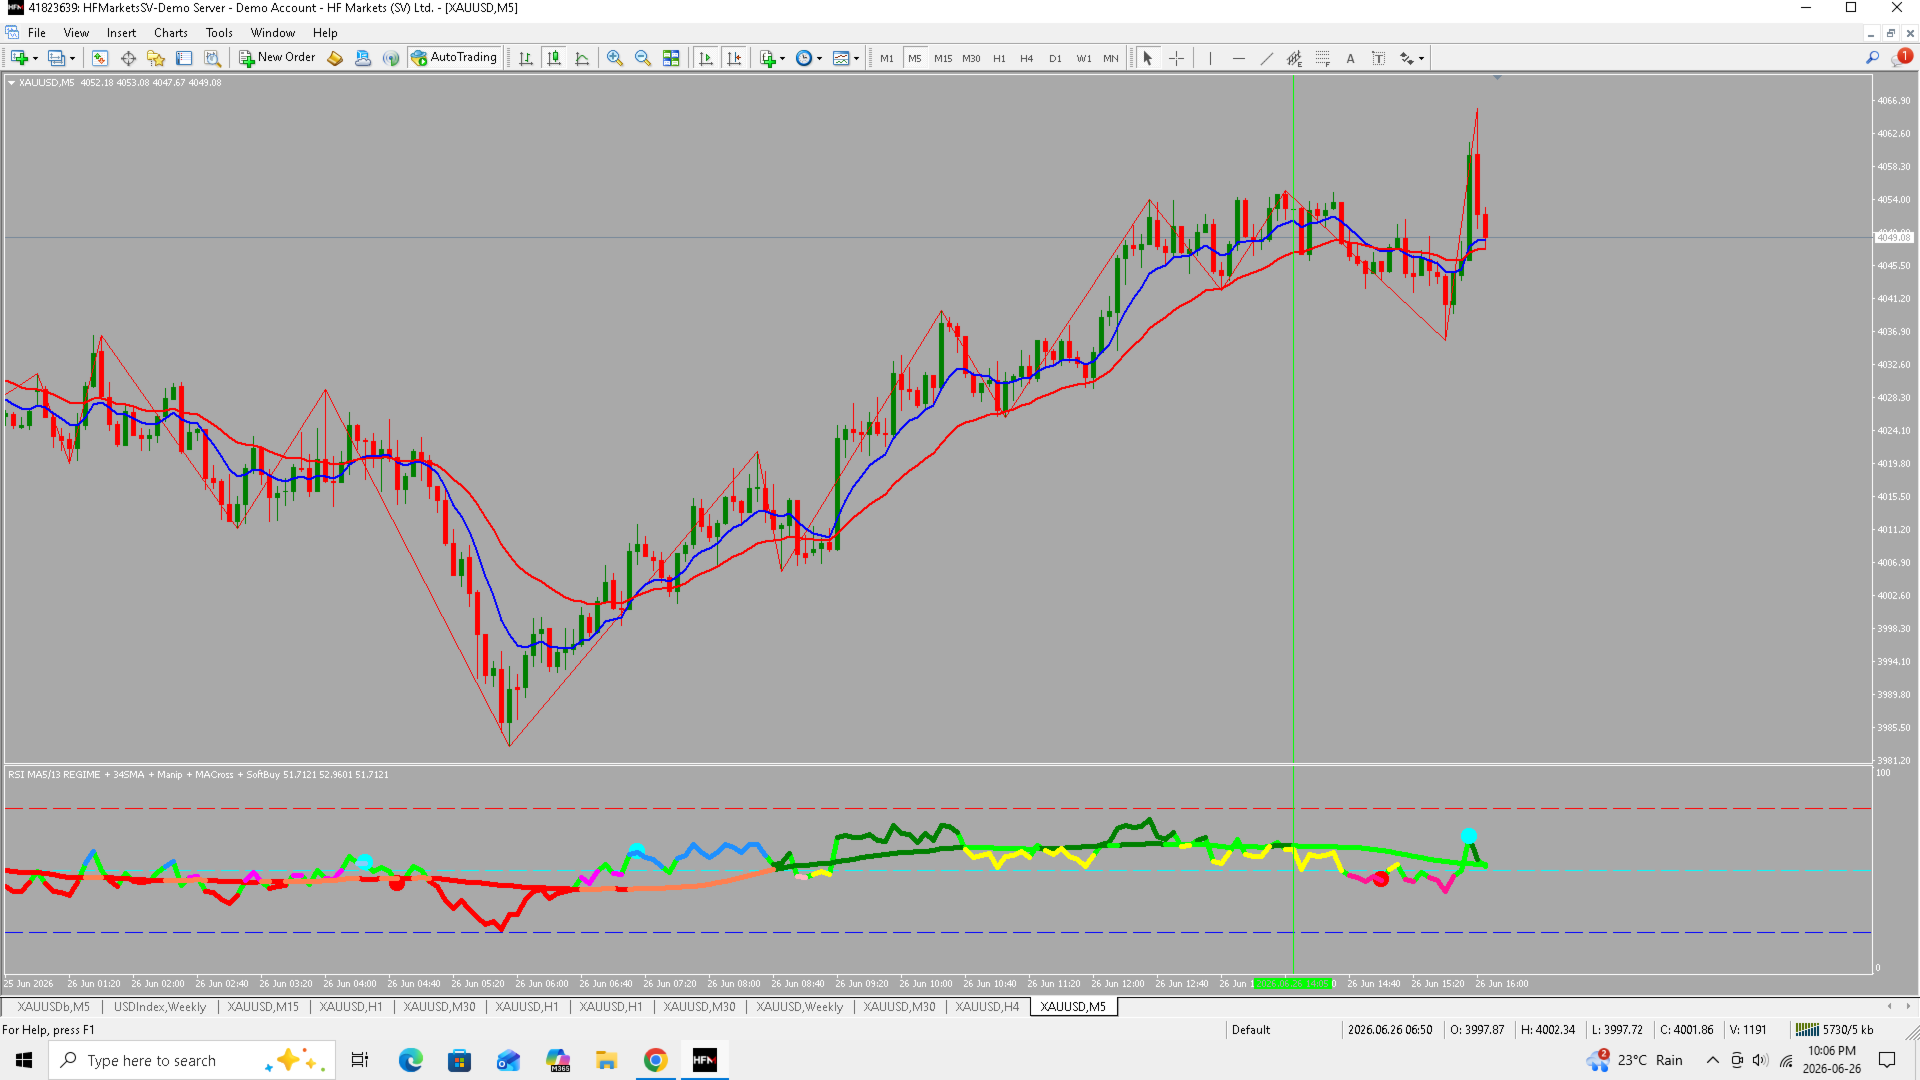
RSI MA Regime Engine is a professional visual trading indicator designed to help traders understand market phase, momentum direction, and moving average structure at a glance.
Instead of showing a plain RSI line, this tool transforms RSI into a market regime map, combining RSI behavior, 34SMA trend structure, 5/13 moving average interaction, slope, cross conditions, and visual phase coloring.
It is built for traders who want faster chart reading, cleaner decision-making, and better awareness of when a market is trending, weakening, pulling back, or preparing for a possible shift.
What This Indicator Does
This indicator helps answer important trading questions quickly:
- Is RSI above or below the key 50 level?
- Is momentum rising or falling?
- Is price aligned with the 5 and 13 moving averages?
- Is the 34SMA regime supporting buys or sells?
- Is the market in a trend phase, caution phase, or possible manipulation phase?
- Are moving averages crossing or opening?
- Is the current move losing strength or expanding?
The goal is not to replace your trading strategy, but to give you a clearer view of market structure and momentum conditions.
Main Features
Colored RSI Regime Line
The RSI line changes color based on its relationship to trend and momentum conditions, making it easier to spot phase changes visually.
Key RSI Levels
Includes important RSI guide levels:
- 50 level for trend/momentum balance
- 80 level for strong upper momentum
- 20 level for strong lower momentum
These levels help identify overextended areas, continuation pressure, and possible exhaustion zones.
5 / 13 Moving Average Filter
The indicator includes a moving average structure filter using fast and slow averages.
Default settings:
- 5 MA
- 13 MA
These can be adjusted in the inputs to match your own trading style.
34SMA Regime Logic
The 34SMA is used as a higher-level momentum regime filter. This helps separate stronger trend conditions from weaker or corrective movement.
MA Cross Awareness
The indicator highlights when moving average conditions change, helping traders identify possible trend shifts or caution zones earlier.
Manipulation / Caution Phase Detection
The visual color system is designed to help traders notice when price action may be entering a weaker or more dangerous phase, especially when momentum and moving averages are no longer aligned.
Clean Visual Layout
Designed to keep the chart readable without covering the candles. The indicator gives useful information while keeping the trading screen clean.
Who This Indicator Is For
This tool is useful for:
- Scalpers
- Intraday traders
- Trend traders
- Gold traders
- Forex traders
- Index traders
- Crypto traders using MT4 symbols
- Traders who use RSI but want better visual confirmation
- Traders who combine RSI with moving averages
It can be used on any timeframe, from lower timeframe scalping charts to higher timeframe trend analysis.
Why This Indicator Is Different
Most RSI indicators simply show one line and a few levels.
This indicator goes further by combining:
RSI + 34SMA regime + 5/13 MA structure + MA cross logic + visual phase coloring
That combination gives a much clearer picture of what the market is actually doing.
Instead of asking, “Is RSI above or below 50?”, you can quickly see whether the market is in a strong phase, weak phase, caution phase, or possible transition phase.
How Traders Can Use It
You can use the indicator to:
- Confirm trend direction
- Avoid weak trades against momentum
- Spot possible exits when momentum changes
- Identify early caution before a moving average shift
- Filter buy and sell setups
- Read market strength faster
- Combine with support/resistance, session levels, or your own strategy
For example, when RSI, moving averages, and regime color all agree, the market condition is usually cleaner. When they disagree, the indicator warns that the move may be losing strength or entering a caution phase.
Important Note
This is an analytical indicator, not an Expert Advisor.
It does not open or close trades automatically.
It is designed to support discretionary trading decisions by giving a clearer visual read of momentum and moving average regime conditions.
No indicator can predict the market with certainty. Always use proper risk management.
Best For
- Momentum confirmation
- Trend filtering
- Pullback awareness
- Exit awareness
- Avoiding bad entries during weak conditions
- Cleaner RSI interpretation