Multi timeframe range trading
- Индикаторы
- Версия: 1.3

Multi-Timeframe Range Trading is a MetaTrader 5 indicator for range trading. It identifies the price oscillation zone and marks the top (resistance) and bottom (support) so you can trade swings inside the range, with higher-timeframe context.
Features
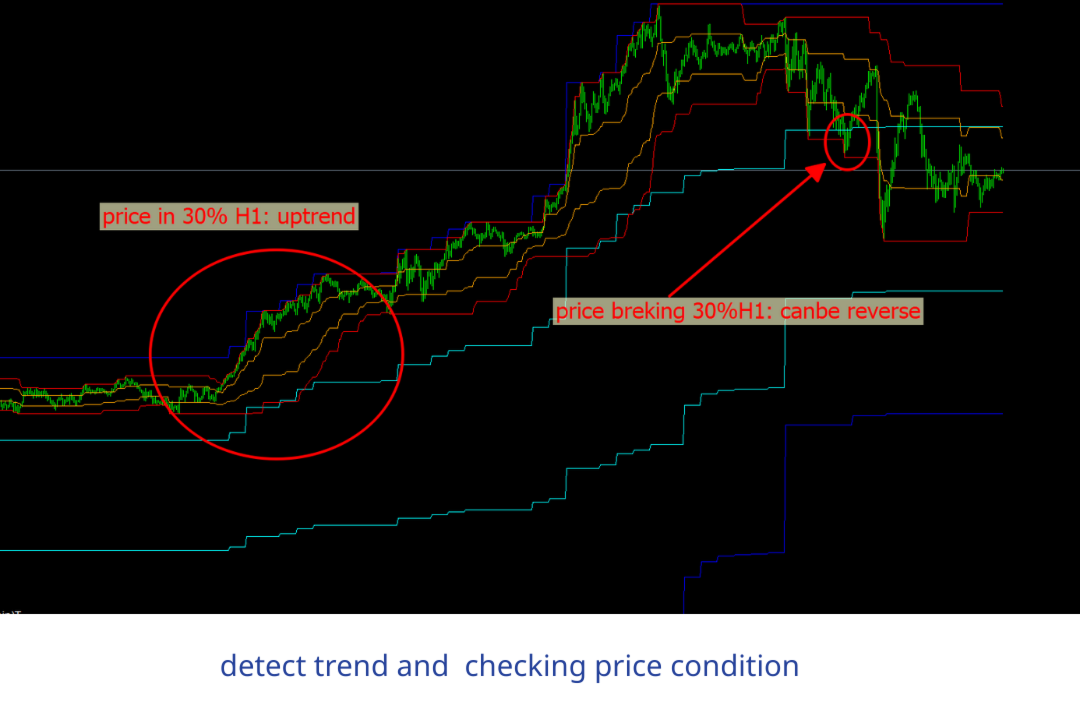
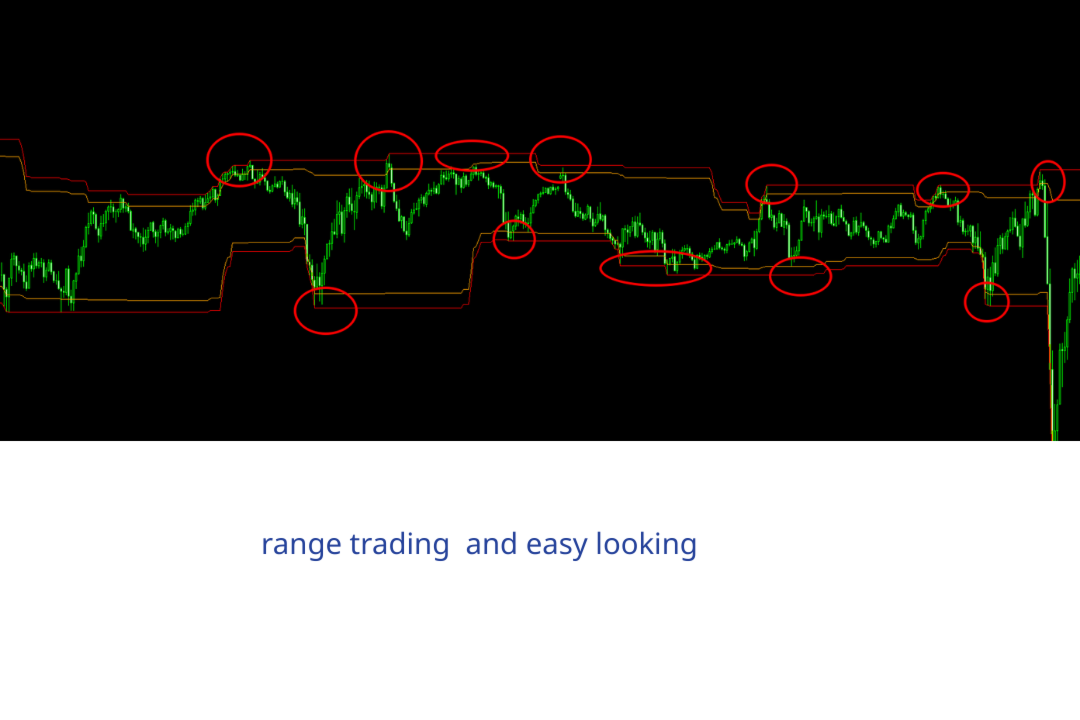
- Automatic range detection: defines the range from recent highs and lows and draws the top and bottom bands.
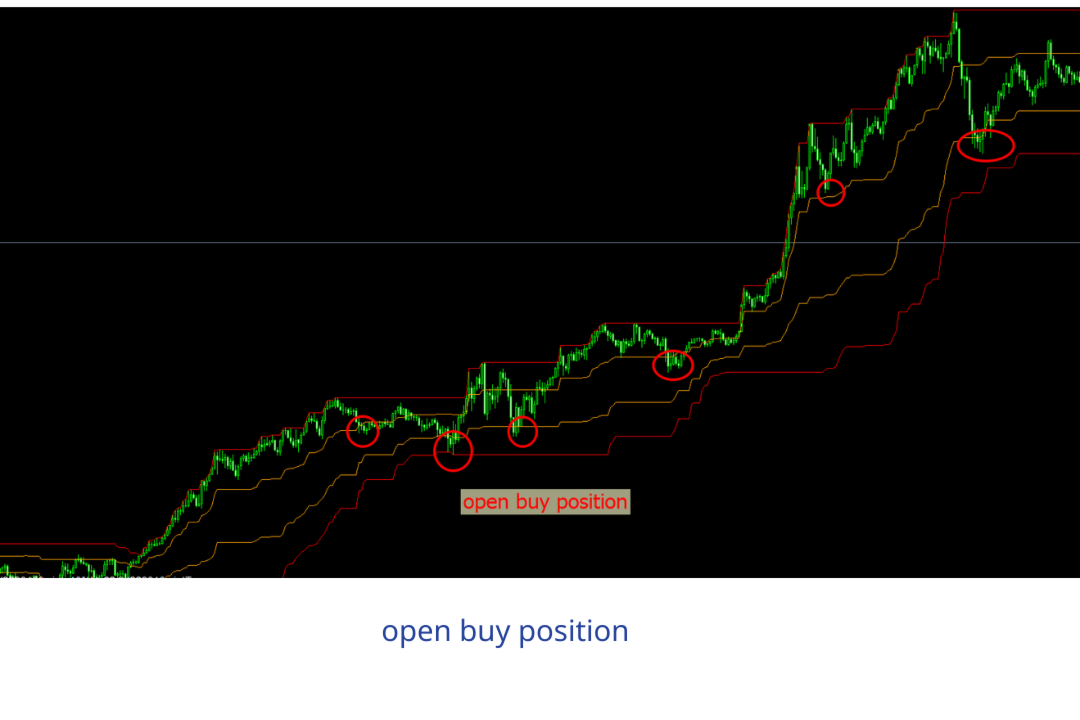
- Built-in range bias: price tends to be pushed down from the top and up from the bottom while the range holds.
- Multi-timeframe context: confirm the range against a higher timeframe before trading it.
- Clear bands that adapt as the range shifts.
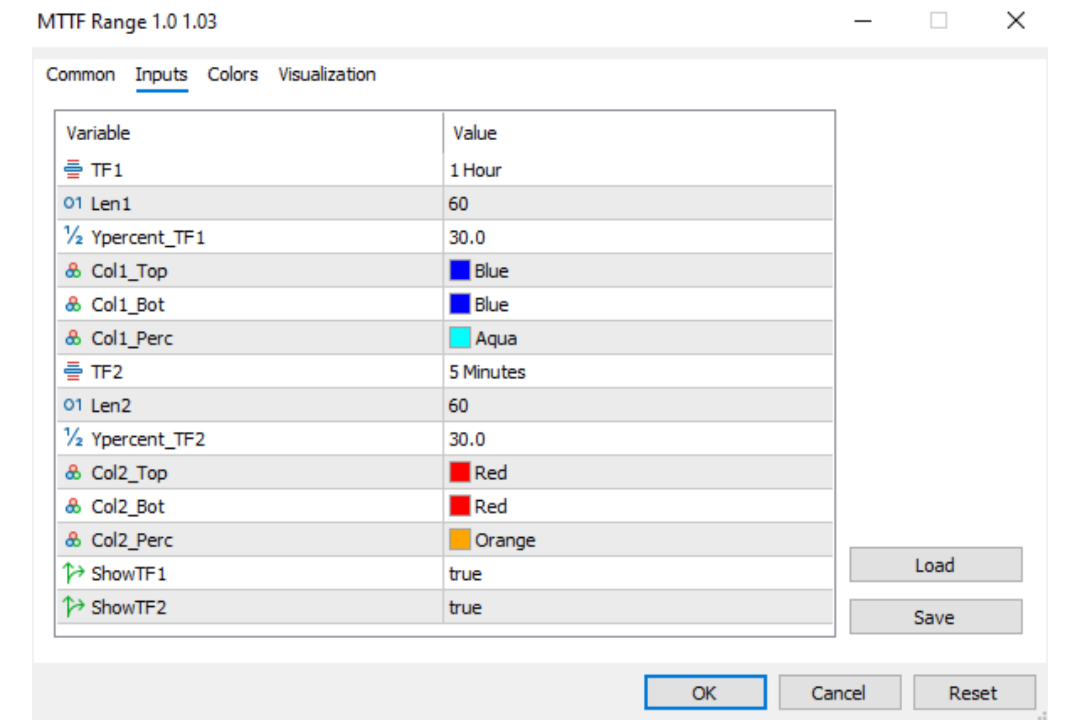
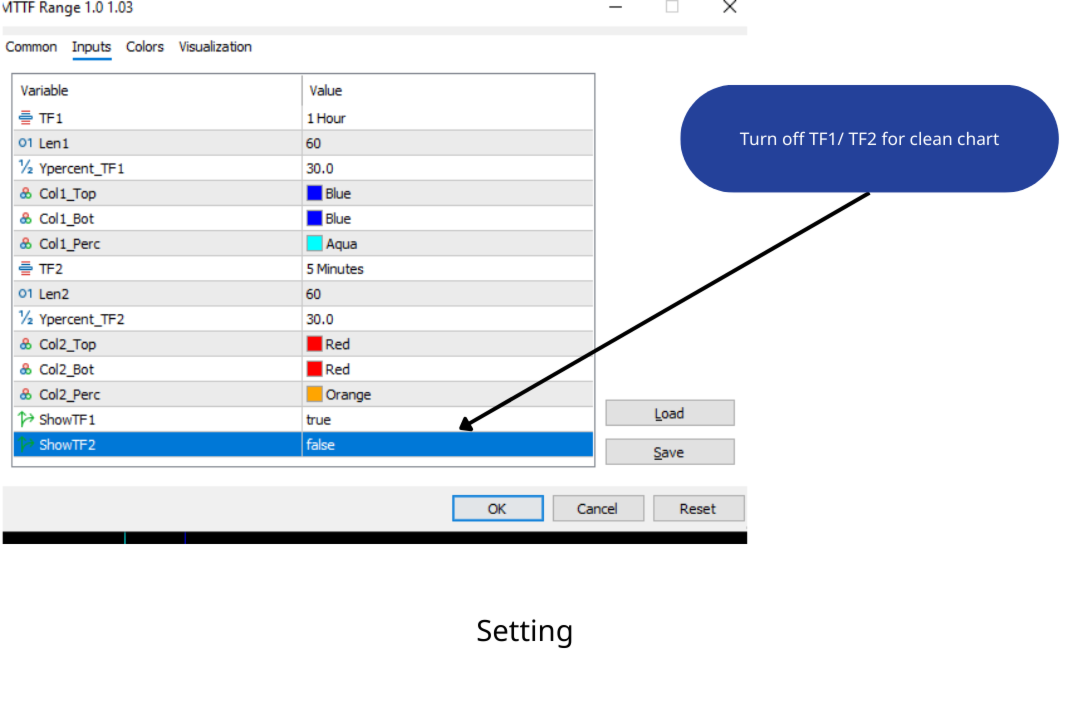
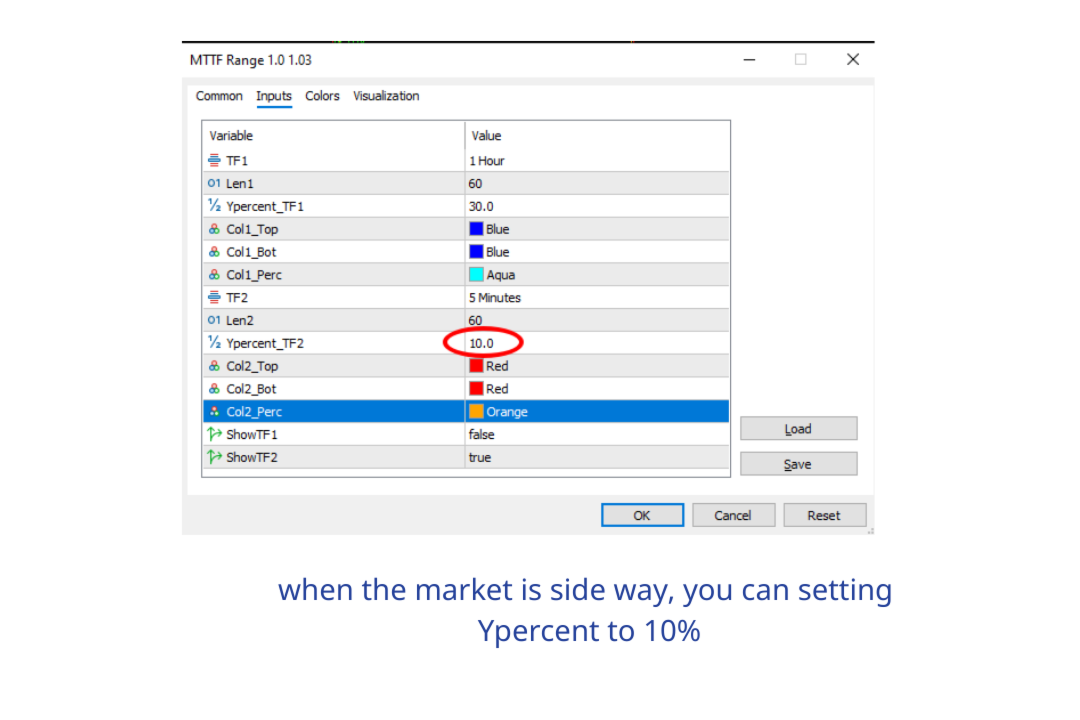
Inputs
- Timeframe: the higher timeframe used for context.
- Range Lookback: bars used to compute the top and bottom.
- Band Settings: how the top and bottom levels are derived.
- Color and line options.
Outputs
- Top (resistance) and bottom (support) range bands on the chart.
Alerts
Optional alerts can be sent as a screen popup, sound, push notification and email when price reaches a band.
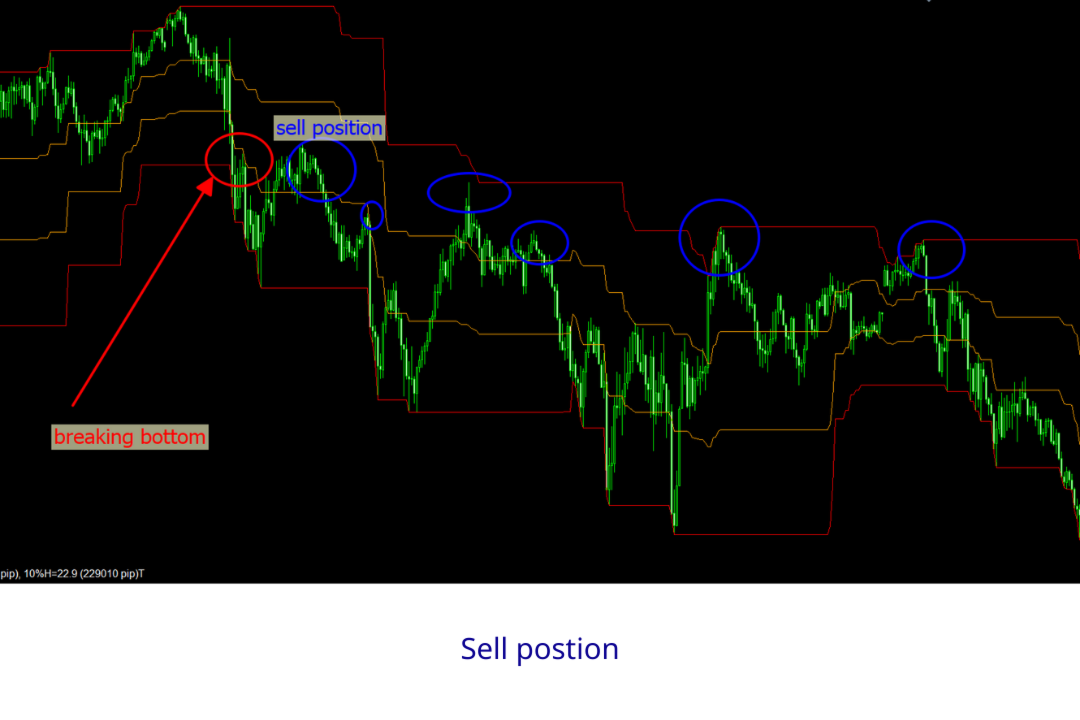
Limitations
Range methods work only while the range holds; when price breaks and trends, stand aside. Sell near the top and buy near the bottom with a stop just beyond the band, and confirm the range on the higher timeframe.
Full guide with all parameters: see the Comments section.
Group support: https://www.mql5.com/en/channels/vuongphamtrading