Heiken Ashi Alerts MT5

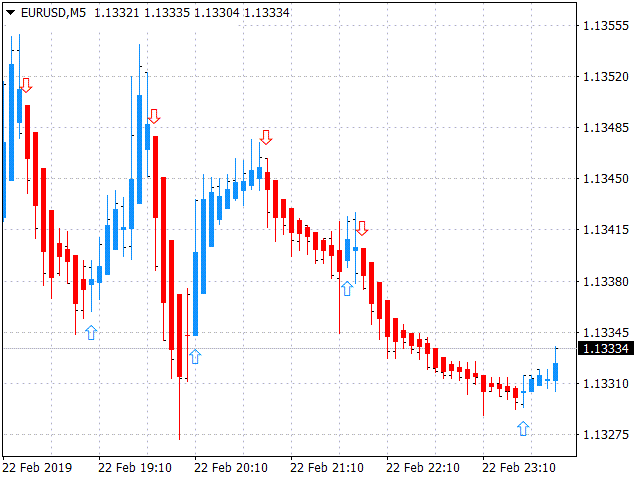
O KT Heiken Ashi Alert exibe setas de compra e venda e gera alertas com base nas velas padrão de Heiken Ashi. É uma ferramenta essencial para traders que desejam incorporar Heiken Ashi em sua estratégia de negociação.

  • Uma seta de compra é exibida quando o Heiken Ashi muda de estado de baixa para alta.
  • Uma seta de venda é exibida quando o Heiken Ashi muda de estado de alta para baixa.
  • Inclui notificações por celular, e-mail, som e alertas pop-up.

O que é exatamente o Heiken Ashi?

Em japonês, "Heiken Ashi" significa "vela média". É usado para tornar os gráficos de velas mais legíveis e facilitar a identificação de tendências. Um trader pode usar o Heiken Ashi tanto para entradas quanto saídas. A mudança de cor muitas vezes indica uma mudança na direção do mercado.

Pontos Importantes

  • Não é recomendável usar o Heiken Ashi Alert como um indicador isolado. Combine-o com outros indicadores para uma análise mais precisa.
  • Uma mudança de tendência geralmente começa com uma vela pequena com pavios superior e inferior.
  • Velas vermelhas sem pavio superior indicam uma forte tendência de queda.
  • Velas azuis sem pavio inferior indicam uma forte tendência de alta.

Fórmula Heiken Ashi

As velas Heiken Ashi são semelhantes às velas japonesas tradicionais, mas usam uma fórmula diferente de cálculo.

  • Abertura = [Abertura (vela anterior) + Fechamento (vela anterior)] / 2
  • Fechamento = (Abertura + Máxima + Mínima + Fechamento) / 4
  • Máxima = Maior preço alcançado
  • Mínima = Menor preço alcançado

Produtos recomendados
The Super Arrow Indicator provides non-repainting buy and sell signals with exceptional accuracy. Key Features No repainting – confirmed signals remain fixed Clear visual arrows: green for buy, red for sell Real-time alerts via pop-up, sound, and optional email Clean chart view with no unnecessary clutter Works on all markets: Forex, gold, oil, indices, crypto Adjustable Parameters TimeFrame Default:   "current time frame" Function:   Sets the time frame for indicator calculation Options:   Can
Bollinger Trend Lines – MT4 & MT5 Bollinger Trend Lines is a professional volatility-based trend indicator designed to clearly identify trend direction and dynamic stop levels using Bollinger Bands. Fuses on one core principle: follow the trend, ignore noise, and let volatility define the stop. How it works The indicator builds trailing trend lines using Bollinger Bands: In an uptrend , the lower band trails price and can only rise In a downtrend , the upper band trails price and can only
Heiken Ashi Smoothed Strategy is a very simple but powerful system to get forex market trend direction. This indicator is actually 2 indicators in 1 pack, Heiken Ashi and Heiken Ashi Smoothed Moving Average both included. Because HA (Heiken Ashi) and HAS (Heiken Ashi Smoothed) are calculated in the same one system event with necessary buffers and loop only, so it is the FAST, OPTIMIZED and EFFICIENT HA having the combined indicator of MetaTrader 5. You can choose to display HA and HAS in the sam
up down v6 for mt5 is no repaint all timeframe and all pairs indicator. red histogram cros trigger that is up point,and put a red point on histogram. and blue histogram cros trigger that is deep point.and put blue point on histogram. this indicator need to sometimes zoom out .for thise pres + button. if newly comes signal is too high makes before invisible.red and blue points are there.to see the signals. indicator is no repaint and can use all time frame and all pairs. only need minimum 500 bar
Owl Smart Levels MT5
Sergey Ermolov
4.03 (32)
Versão MT4  |  FAQ O Indicador Owl Smart Levels é um sistema de negociação completo dentro de um indicador que inclui ferramentas populares de análise de mercado, como fractais avançados de Bill Williams , Valable ZigZag que constrói a estrutura de onda correta do mercado e níveis de Fibonacci que marcam os níveis exatos de entrada no mercado e lugares para obter lucros. Descrição detalhada da estratégia Instruções para trabalhar com o indicador Consultor de negociação Owl Helper Chat privado d
STRICTLY FOR BOOM INDEX ONLY!!!!! Here I bring the Maximum Trend Arrows OT1.0 MT5 indicator. This indicator is made up of a combination of different trend indicators for entries and exits, for entries an orange arrow will paint on the chart below the current market and a red flag for closing of trades and it produces buy arrows only. When the orange arrow appears, it will appear along with it's sound to notify you. The 1H timeframe is recommended, don't use it anywhere else than on the 1H timefr
HLC bar MT5 Wyckoff
Eduardo Da Costa Custodio Santos
O indicador "HLC_bar_MT5 Wyckoff" para MT5 foi criado para facilitar a análise na hora da negociação. A Barra HLC foi utilizada por Richard Wyckoff e atualmente muito utilizada nas operações de "VSA". Wyckoff descobriu que a utilização da Máxima, mínima e fechamento deixava o gráfico muito mais limpo e fácil de ser analisado. O Indicador "HLC_bar_MT5 Wyckoff" permite: # Alterar a largura da barra; # Deixar a barra da mesma cor; # E destacar a barra que abriu e fechou no mesmo preço. As c
Este indicador AJiBoLang é adequado para todos os ciclos do sinal, muito adequado para sinais de curto prazo, a precisão do sinal é boa. Basta olhar para as setas no gráfico e fazer uma única ordem: a seta verde é o single Buy e a seta vermelha é o single Sell. Depois de fazer a ordem de compra, se a linha amarela subir para o nível superior e percorrer uma determinada distância, você poderá vender a ordem de compra. Depois de fazer o single Sell, se a linha amarela for para o nível inferior
Universal Soul Reaper
Pieter Gerhardus Van Zyl
Universal Soul Reaper is an atmospheric market-flow oscillator designed to interpret price behavior as a cycle of spiritual energy. Instead of reacting to raw price alone, it visualizes the state of the market’s soul —revealing when momentum is awakening, stabilizing, or fading. The indicator operates in a separate window and presents three interwoven entities: the Ectoplasmic Veil , the Spirit Boundary , and the Soul Core . Together, they form a living framework that helps traders sense pressu
DAILY OH/OL SDEV QUANT MODEL - STATISTICAL TRADING WITH PRECISION RISK MANAGEMENT TRADE WITH MATHEMATICAL CERTAINTY - KNOW YOUR EXACT STOP-LOSS AND TAKE-PROFIT BEFORE YOU ENTER This indicator analyzes 5,000+ days of price history to give you: Exact entry levels (sigma bands locked at daily open) Exact stop-loss distance (from M
Multi-Timeframe Money Flow Index (MTF MFI) with Smart Divergence and Dashboard Unlock the flow of institutional money across every timeframe. Are you tired of guessing the trend only to be trapped by a sudden reversal? The Multi-Timeframe Money Flow Index (MTF MFI) is a professional-grade trading tool designed to provide a bird's-eye view of market liquidity and momentum. By aggregating volume-weighted data from W1 down to M1, this indicator eliminates noise and highlights high-probability tra
O HAshi-E é uma forma aprimorada de analisar os sinais do Heiken-Ashi. Resumo: O Heiken-Ashi é particularmente valorizado por sua capacidade de filtrar a volatilidade de curto prazo, o que o torna a ferramenta preferida para identificar e acompanhar tendências, ajuda na tomada de decisões sobre pontos de entrada e saída e auxilia na distinção entre sinais falsos e reversões genuínas de tendências. Diferentemente dos gráficos de velas tradicionais, as velas Heiken-Ashi são calculadas usando os
Weis Wave Scouter
Jean Carlos Martins Roso
Descubra o poder da análise avançada de volume com o Weis Wave Scouter, um indicador revolucionário para MetaTrader 5 que combina os princípios consagrados do método Wyckoff e da análise VSA (Volume Spread Analysis). Desenvolvido para traders que buscam precisão e profundidade em suas operações, este indicador oferece uma leitura tática do mercado por meio da análise de ondas de volume cumulativo, ajudando a identificar pontos-chave de reversão e continuação de tendência. O Weis Wave Scouter a
The   Trendlines Oscillator   helps traders identify trends and momentum based on the normalized distances between the current price and the most recently detected bullish and bearish trend lines. The indicator features bullish and bearish momentum, a signal line with crossings, and multiple smoothing options. USAGE The   Trendlines Oscillator   works by systematically: Identifying pivot highs and lows. Connecting pivots to form bullish (support) and bearish (resistance) trendlines. Measuring
All about time and price by ICT. This indicator provides a comprehensive view of ICT killzones, Silver Bullet times, and ICT Macros, enhancing your trading experience.  In those time windows price either seeks liquidity or imbalances and you often find the most energetic price moves and turning points. Features: Automatic Adaptation: The ICT killzones intelligently adapt to the specific chart you are using. For Forex charts, it follows the ICT Forex times: In EST timezone: Session: Asia: 20h00-0
This trading indicator is non-repainting, non-redrawing, and non-lagging, making it an ideal choice for both manual and automated trading. It is a Price Action–based system that leverages price strength and momentum to give traders a real edge in the market. With advanced filtering techniques to eliminate noise and false signals, it enhances trading accuracy and potential. By combining multiple layers of sophisticated algorithms, the indicator scans the chart in real-time and translates comple
KasTon Trend System: The Complete 2-in-1 Trading Strategy Identify the Trend, Confirm the Signal, and Trade with Confidence! Do you suffer from confusion while trading? Do you find it difficult to determine the market's direction? Are you tired of losing money on false signals? The KasTon Trend System is here as an integrated solution to all these problems. This is not just an indicator; it is a complete trading strategy built on the synergy of two powerful, custom-built indicators. Our main g
Order Flow Strength
Vincent Jose Proenca
Order Flow Strength (OFS) Descrição: Indicador que mede a força do fluxo de ordens , analisando onde o fechamento se encontra dentro da faixa de cada vela, ponderado pelo volume . Exibe a pressão compradora (verde) e a pressão vendedora (vermelha) em um painel separado. Fórmula Order Flow Strength = Close − Low High − Low × Volume \text{Order Flow Strength} = \frac{\text{Close} - \text{Low}}{\text{High} - \text{Low}} \times \text{Volume} Order Flow Strength = High − Low Close − Low ​ × Volume C
MercariaPattern1-2-3 відстежує рух ціни, знаходить трьоххвильові структури 1-2-3 та підсвічує момент, коли сценарій підтверджується пробоєм ключового рівня. MercariaPattern1-2-3 tracks price movement, detects three-leg 1-2-3 structures and highlights the moment when the scenario is confirmed by a key level breakout. Індикатор збирає локальні свінги в компактну фігуру 0–1–2–3 , чекає підтвердженого пробою та будує стрілку входу з готовими рівнями SL/TP. The indicator combines local swings into a
The Antique Trend Indicator is a revolutionary trend trading and filtering solution with all the important features of a trend tool built into one tool! The Antique Trend indicator is good for any trader, suitable for any trader both for Forex and binary options. There is no need to configure anything, everything has been perfected by time and experience, it works great during flats and trends. The Antique Trend indicator is a tool for technical analysis of financial markets, reflecting curren
An indicator of pattern #31 ("Long Island") from Encyclopedia of Chart Patterns by Thomas N. Bulkowski. The second gap is in the opposite direction. Parameters: Alerts - show alert when an arrow appears   Push - send a push notification when an arrow appears (requires configuration in the terminal) GapSize - minimum gap size in points ArrowType - a symbol from 1 to 17 ArrowVShift - vertical shift of arrows in points   ShowLevels - show levels ColUp - color of an upward line ColDn - color of a d
Renko System
Marco Montemari
This indicator can be considered as a trading system. It offers a different view to see the currency pair: full timeless indicator, can be used for manual trading or for automatized trading with some expert advisor. When the price reaches a threshold a new block is created according to the set mode. The indicator beside the Renko bars, shows also 3 moving averages. Features renko mode median renko custom median renko 3 moving averages wicks datetime indicator for each block custom notification
Fib Auto Trendline
Nhlanhla Brilliant Mashavha
INTRODUCTION The  Fib Autotrendline   is a basic tool that analysts use to find out when a security's trend is reversing. By determining the   support and resistance areas , it helps to identify significant changes in price while filtering out short-term fluctuations, thus eliminating the noise of everyday market conditions. It is an excellent tool for any trader who follows indicators that use   swing highs  and   swing lows . How to Use the fib Auto Trendline Indicator The Fib Auto Trendline
Crash 1000 Scalping Indicator for the Crash 1000 Deriv Synthetic Index. Introduction The Crash 1000 Scalping Indicator is a specialized tool designed for the Crash 1000 index on the Deriv Synthetic market. This indicator is particularly useful for scalping on the M1 timeframe, helping traders to identify precise entry and exit points for buy positions. It is designed to be non-repainting, providing clear signals with audible alerts and push notifications, and is compatible with mobile devices th
SUPERTREND;   It is a trend following indicator based on the SuperTrend ATR created by Nav. It can be used to detect changes in trend direction and locate stops. When the price falls below the indicator curve, it turns red and indicates a downtrend. Conversely, when the price moves above the curve, the indicator turns green, indicating an uptrend. BUY/SELL Signals; Method 1; A standard strategy using a single SuperTrend is   While ST Period 1=10, ST Multiplier 1=3, - SELL signal when the bars f
HMA Trend Professional MT5
Pavel Zamoshnikov
4.25 (4)
Improved version of the free HMA Trend indicator (for MetaTrader 4) with statistical analysis. HMA Trend is a trend indicator based on the Hull Moving Average (HMA) with two periods. HMA with a slow period identifies the trend, while HMA with a fast period determines the short-term movements and signals in the trend direction. The main differences from the free version: Ability to predict the probability of a trend reversal using analysis of history data. Plotting statistical charts for analyzi
Buy Sell Volatility 75
Ignacio Agustin Mene Franco
Pack Volatility 75 1/3 In this indicator stage 1 I am pleased to present you the volatility 75 Buy/Sell Professional indicator. where in each temporary structure it will mark a sale and a safe purchase to operate manually, where the strategy is based on the lines EMA of 7 exponential periods and the EMA of 50 exponential periods. where purchasing a product comes 2 as a gift (it's the pack) purchasing any of the 3 products will be sent the remaining indicators, to be able to apply the strategy we
Hello I Want to introduce The Forex Buy Sell Arrow Premium MT5 i recently release this premium indicator! its 1000% Non Repaint Indicator, It Work Perfectly Well,, i tested it day by day, Just mind blowing Result,  Including Powerful trend Algorithm! How It Work? well, it work market trend formula, when trend Bullish Or when trend Bearish,  Recommend Timeframe M30, H1 it work all timeframe, and all currency pair, 100% non repaint, How to take signal From Forex Buy Sell Arrow Premium Ind
Wave Trend MT5
Diego Arribas Lopez
MT4 Version Wave Trend MT5 Wave Trend is an oscillator, which helps identifing in a extremely accurate manner market reversals. The Oscillator being obove the overbought level and a cross down of the fast into the slow MA usually indicates a good SELL signal. If the oscillators is below the oversold level and the fast MA crosses over the slower MA usually highlights a good BUY signal. The Wave Trend indicator can be also used when divergences appear against the price, indicating the current move
Os compradores deste produto também adquirem
SuperScalp Pro
Van Minh Nguyen
5 (9)
SuperScalp Pro – Sistema avançado de indicador de scalping com múltiplos filtros SuperScalp Pro é um sistema avançado de indicador de scalping que combina o clássico Supertrend com múltiplos filtros inteligentes de confirmação. O indicador opera de forma eficiente em todos os timeframes de M1 a H4 e é especialmente adequado para XAUUSD, BTCUSD e principais pares Forex. Pode ser usado como sistema independente ou integrado de forma flexível a estratégias de trading existentes. O indicador integra
Divergence Bomber
Ihor Otkydach
4.89 (83)
Cada comprador deste indicador recebe adicionalmente, e de forma gratuita: A ferramenta exclusiva "Bomber Utility", que acompanha automaticamente cada operação, define os níveis de Stop Loss e Take Profit e fecha operações de acordo com as regras da estratégia; Arquivos de configuração (set files) para ajustar o indicador em diferentes ativos; Set files para configurar o Bomber Utility nos modos: "Risco Mínimo", "Risco Balanceado" e "Estratégia de Espera"; Um vídeo tutorial passo a passo que aju
Se você comprar este indicador, receberá meu Gerenciador de Operações Profissional + EA  GRATUITAMENTE. Primeiramente, vale ressaltar que este Sistema de Trading é um Indicador Não Repintado, Não Redesenho e Não Atrasado, o que o torna ideal tanto para o trading manual quanto para o automatizado. Curso online, manual e download de predefinições. O "Sistema de Trading Inteligente MT5" é uma solução completa de trading projetada para traders novos e experientes. Ele combina mais de 10 indicadores
Entry In The Zone and SMC Multi Timeframe is a real-time market analysis tool developed based on Smart Money Concepts (SMC). It is designed to analyze market structure, price direction, reversal points, and key zones across multiple timeframes in a systematic way. The system displays Points of Interest (POI) and real-time No Repaint signals, with instant alerts when price reaches key zones or when signals occur within those zones. It functions as both an Indicator and a Signal System (2-in-1), c
FX Trend MT5 NG
Daniel Stein
5 (4)
FX Trend NG: A Nova Geração de Inteligência de Tendência Multi-Mercado Visão Geral FX Trend NG é uma ferramenta profissional de análise de tendências e monitoramento de mercado em múltiplos períodos de tempo. Permite compreender a estrutura completa do mercado em segundos. Em vez de alternar entre vários gráficos, você visualiza instantaneamente quais ativos estão em tendência, onde o momentum está enfraquecendo e onde existe alinhamento forte entre diferentes timeframes. Oferta de Lançamento
ARICoins
Temirlan Kdyrkhan
ARICoin is a powerful trading companion designed to generate high-probability entry signals with dynamic TP/SL/DP levels based on volatility. Built-in performance tracking shows win/loss stats, PP1/PP2 hits, and success rates all updated live. Key Features: Buy/Sell signals with adaptive volatility bands Real-time TP/SL/DP levels based on ATR Built-in MA Filter with optional ATR/StdDev volatility Performance stats panel (Success, Profit/Loss, PP1/PP2) Alerts via popup, sound, push, or email Cust
Grabber System MT5
Ihor Otkydach
4.82 (22)
Apresento a você um excelente indicador técnico: Grabber, que funciona como uma estratégia de trading “tudo incluído”, pronta para usar. Em um único código estão integradas ferramentas poderosas de análise técnica de mercado, sinais de entrada (setas), funções de alertas e notificações push. Cada comprador deste indicador também recebe gratuitamente: Utilitário Grabber: ferramenta para gerenciamento automático de ordens abertas Vídeo tutorial passo a passo: como instalar, configurar e operar com
Quantum TrendPulse
Bogdan Ion Puscasu
5 (22)
Apresentando   Quantum TrendPulse   , a ferramenta de negociação definitiva que combina o poder do   SuperTrend   ,   RSI   e   Stochastic   em um indicador abrangente para maximizar seu potencial de negociação. Projetado para traders que buscam precisão e eficiência, este indicador ajuda você a identificar tendências de mercado, mudanças de momentum e pontos de entrada e saída ideais com confiança. Principais características: Integração SuperTrend:   siga facilmente a tendência predominante do
AriX
Temirlan Kdyrkhan
1 (4)
AriX Indicator for MT5 A powerful trend-following and signal-evaluation tool AriX is a custom MT5 indicator that combines Moving Averages and ATR-based risk/reward logic to generate clear buy/sell signals. It visualizes dynamic SL/TP levels, evaluates past trade outcomes, and displays win/loss statistics in a clean on-chart panel. Key features include: Buy/Sell signals based on MA crossovers ATR-based SL/TP1/TP2/TP3 levels with visual lines and labels Signal outcome tracking with real-time stat
Atomic Analyst MT5
Issam Kassas
4.03 (30)
Primeiramente, vale ressaltar que este Indicador de Negociação não repinta, não redesenha e não apresenta atrasos, tornando-o ideal tanto para negociação manual quanto automatizada. Manual do utilizador: configurações, entradas e estratégia. O Analista Atômico é um Indicador de Ação de Preço PA que utiliza a força e o momentum do preço para encontrar uma vantagem melhor no mercado. Equipado com filtros avançados que ajudam a remover ruídos e sinais falsos, e aumentam o potencial de negociação.
Power Candles MT5
Daniel Stein
5 (6)
Power Candles – Sinais de entrada baseados em força para qualquer mercado Power Candles leva a análise de força comprovada da Stein Investments diretamente para o seu gráfico de preços. Em vez de reagir apenas ao preço, cada candle é colorido com base na força real do mercado, permitindo identificar instantaneamente a construção de momentum, aceleração de força e transições limpas de tendência. Uma única lógica para todos os mercados Power Candles funciona automaticamente em todos os símbolos de
Game Changer Indicator mt5
Vasiliy Strukov
4.8 (20)
Game Changer es un indicador de tendencia revolucionario, diseñado para usarse en cualquier instrumento financiero y transformar su MetaTrader en un potente analizador de tendencias. Funciona en cualquier marco temporal y facilita la identificación de tendencias, señala posibles reversiones, actúa como mecanismo de trailing stop y proporciona alertas en tiempo real para una respuesta rápida del mercado. Tanto si es un profesional experimentado como si es un principiante que busca una ventaja com
Trend Screener Pro MT5
STE S.S.COMPANY
4.84 (101)
Desbloqueie o poder da negociação de tendências com o indicador Trend Screener: sua solução definitiva de negociação de tendências, alimentada por lógica difusa e sistema de múltiplas moedas! Eleve sua negociação de tendências com o Trend Screener, o revolucionário indicador de tendências alimentado por lógica difusa. É um poderoso indicador de acompanhamento de tendências que combina mais de 13 ferramentas e recursos premium e 3 estratégias de negociação, tornando-o uma escolha versátil para to
Apresentando       Quantum Breakout PRO   , o inovador Indicador MQL5 que está transformando a maneira como você negocia Breakout Zones! Desenvolvido por uma equipe de traders experientes com experiência comercial de mais de 13 anos,       Quantum Breakout PRO       foi projetado para impulsionar sua jornada comercial a novos patamares com sua estratégia de zona de fuga inovadora e dinâmica. O Quantum Breakout Indicator lhe dará setas de sinal em zonas de breakout com 5 zonas-alvo de lucro e su
Smart Stop Indicator – Precisão inteligente de stop-loss diretamente no seu gráfico Visão geral O Smart Stop Indicator é a solução ideal para traders que desejam definir seu stop-loss de forma clara e metódica, sem adivinhações ou decisões baseadas apenas na intuição. A ferramenta combina lógica clássica de price action (topos mais altos, fundos mais baixos) com um sistema moderno de detecção de rompimentos para identificar onde realmente deve estar o próximo nível lógico de stop. Seja em tend
Este é um indicador para MT5 que fornece sinais precisos para entrar em uma negociação sem redesenhar. Ele pode ser aplicado a qualquer ativo financeiro: forex, criptomoedas, metais, ações, índices. Ele fornecerá estimativas bastante precisas e informará quando é melhor abrir e fechar um negócio. Assista o vídeo (6:22) com um exemplo de processamento de apenas um sinal que compensou o indicador! A maioria dos traders melhora seus resultados de negociação durante a primeira semana de negociação c
RFI levels PRO MT5
Roman Podpora
3.67 (3)
O indicador mostra com precisão os pontos de reversão e as zonas de retorno de preço onde o   Principais players . Você identifica onde novas tendências estão se formando e toma decisões com máxima precisão, mantendo o controle sobre cada negociação. VERSION MT4     -    Revela seu potencial máximo quando combinado com o indicador   TREND LINES PRO. O que o indicador mostra: Estruturas de reversão e níveis de reversão com ativação no início de uma nova tendência. Exibição dos níveis de   TAKE P
Order Block Pro (MQL5) – Versão 1.0 Autor: KOUAME N'DA LEMISSA Plataforma: MetaTrader 5 Descrição: Order Block Pro é um indicador avançado projetado para detectar automaticamente Blocos de Ordem de alta e baixa no seu gráfico. Ao analisar velas de consolidação seguidas de velas de impulso fortes, o indicador identifica áreas-chave onde o preço provavelmente se acelerará. Ideal para traders que desejam: Identificar pontos de entrada e saída precisos. Detectar zonas dinâmicas de suporte e resistê
LINHAS DE TENDÊNCIA PRO   -   Ajuda a entender onde o mercado está realmente mudando de direção. O indicador mostra inversões de tendência reais e pontos onde os principais participantes retornam ao mercado. Você vê     Linhas BOS   Análise de tendências e níveis-chave em prazos maiores — sem configurações complexas ou ruídos desnecessários. Os sinais não são repintados e permanecem no gráfico após o fechamento da barra. VERSÃO MT4   -   Revela seu potencial máximo quando combinado com o   indic
ARIPoint
Temirlan Kdyrkhan
ARIPoint is a powerful trading companion designed to generate high-probability entry signals with dynamic TP/SL/DP levels based on volatility. Built-in performance tracking shows win/loss stats, PP1/PP2 hits, and success rates all updated live. Key Features: Buy/Sell signals with adaptive volatility bands Real-time TP/SL/DP levels based on ATR Built-in MA Filter with optional ATR/StdDev volatility Performance stats panel (Success, Profit/Loss, PP1/PP2) Alerts via popup, sound, push, or email Cu
FX Power MT5 NG
Daniel Stein
5 (31)
FX Power: Analise a Força das Moedas para Decisões de Negociação Mais Inteligentes Visão Geral FX Power é a sua ferramenta essencial para compreender a força real das principais moedas e do ouro em quaisquer condições de mercado. Identificando moedas fortes para comprar e fracas para vender, FX Power simplifica as decisões de negociação e revela oportunidades de alta probabilidade. Quer você prefira seguir tendências ou antecipar reversões usando valores extremos de Delta, esta ferramenta adap
Market Flow Pro
Gabriele Sabatino
4 (1)
Market Flow Pro Market Flow Pro is an intelligent trading advisor for the MetaTrader 5 platform, designed for automatic trading on financial markets using algorithmic analysis and strict risk management. -Key features: - Fully automatic trading 24/5 - Adaptive trend and momentum entry algorithm -  Built-in risk management - Flexible lot settings (fixed/auto-calculation) - Support for major currency pairs and indices - Optimised for operation on various timeframes  How it works Market
Azimuth Pro
Ottaviano De Cicco
5 (4)
PROMOÇÃO DE LANÇAMENTO O preço do Azimuth Pro está inicialmente definido em 299$ para os primeiros 100compradores. O preço final será de 499$ . A DIFERENÇA ENTRE ENTRADAS RETAIL E INSTITUCIONAIS NÃO É O INDICADOR — É A LOCALIZAÇÃO. A maioria dos traders entra em níveis de preço arbitrários, perseguindo momentum ou reagindo a sinais atrasados. As instituições esperam o preço atingir níveis estruturados onde oferta e demanda realmente mudam. Azimuth Pro mapeia esses níveis automaticamente: VWA
Trend indicator AI mt5
Ramil Minniakhmetov
5 (15)
O indicador Trend Ai é uma ótima ferramenta que irá melhorar a análise de mercado de um trader, combinando a identificação de tendências com pontos de entrada acionáveis e alertas de reversão. Este indicador permite que os usuários naveguem pelas complexidades do mercado forex com confiança e precisão Além dos sinais primários, o indicador Trend Ai identifica pontos de entrada secundários que surgem durante retrações ou retrações, permitindo que os comerciantes capitalizem as correções de preço
FX Dynamic MT5
Daniel Stein
5 (5)
FX Dynamic: Acompanhe a Volatilidade e as Tendências com Análise ATR Personalizável Visão Geral FX Dynamic é uma ferramenta poderosa que utiliza cálculos de Average True Range (ATR) para fornecer aos traders insights incomparáveis sobre a volatilidade diária e intradiária. Ao configurar limites de volatilidade claros —por exemplo, 80%, 100% e 130%—, você pode identificar rapidamente oportunidades de lucro ou receber alertas quando o mercado ultrapassar faixas normais. FX Dynamic se adapta ao f
Market Structure Order Block Dashboard MT5 é um indicador para MT5 focado em estrutura de mercado e conceitos ICT / Smart Money: HH/HL/LH/LL , BOS , ChoCH , além de Order Blocks , Fair Value Gaps (FVG) , liquidez (EQH/EQL, sweeps), sessões / Kill Zones e um Volume Profile integrado, com um dashboard compacto de confluência. Importante: é uma ferramenta de análise . Não executa operações (não é um EA). Bônus para compradores Após a compra, você pode receber 2 indicadores bônus (à sua escolha) da
Trend Forecaster
Alexey Minkov
5 (7)
The Trend Forecaster indicator utilizes a unique proprietary algorithm to determine entry points for a breakout trading strategy. The indicator identifies price clusters, analyzes price movement near levels, and provides a signal when the price breaks through a level. The Trend Forecaster indicator is suitable for all financial assets, including currencies (Forex), metals, stocks, indices, and cryptocurrencies. You can also adjust the indicator to work on any time frames, although it is recommen
FX Levels MT5
Daniel Stein
5 (13)
FX Levels: Suporte e Resistência com Precisão Excepcional para Todos os Mercados Visão Geral Rápida Procurando um meio confiável de identificar níveis de suporte e resistência em qualquer mercado—incluindo pares de moedas, índices, ações ou commodities? FX Levels combina o método “Lighthouse” tradicional com uma abordagem dinâmica de vanguarda, fornecendo uma precisão quase universal. Baseado em nossa experiência real com corretores e em atualizações automáticas diárias mais as de tempo real,
Ultimate SMC Indicator
Hicham Mahmoud Almoustafa
1 (1)
Ultimate SMC PRO – Smart Money Concepts Indicator (Order Blocks, FVG, Liquidity, BOS) for MetaTrader 5   After purchasing the product, you will receive an additional copy for free. Just contact me after your purchase. Ultimate SMC PRO is a professional trading indicator designed to visualize Smart Money Concepts directly on the chart. The indicator combines several institutional trading tools in one system to help traders identify potential high-probability trading zones. ULTIMATE SMC INDICATO
RelicusRoad Pro: Sistema Operacional Quantitativo de Mercado 70% DE DESCONTO ACESSO VITALÍCIO (TEMPO LIMITADO) - JUNTE-SE A 2.000+ TRADERS Por que a maioria dos traders falha mesmo com indicadores "perfeitos"? Porque eles operam Conceitos Únicos no vácuo. Um sinal sem contexto é uma aposta. Você precisa de CONFLUÊNCIA . RelicusRoad Pro não é um simples indicador de seta. É um Ecossistema Quantitativo de Mercado completo. Ele mapeia a "Estrada do Valor Justo", distinguindo ruído de rupturas estru
Mais do autor
KT Momentum Arrows MT5
KEENBASE SOFTWARE SOLUTIONS
5 (2)
O indicador KT Momentum Arrows é baseado em uma quebra momentânea que é calculada usando a variação das bandas e a volatilidade emergente em determinada direção. Um sinal de compra é gerado quando o preço fecha acima da banda superior, e um sinal de venda é gerado quando o preço fecha abaixo da banda inferior. Um coeficiente de magnitude é utilizado como parâmetro de entrada, influenciando tanto a variação das bandas quanto a medição da volatilidade. O valor desse coeficiente deve ser escolhido
KT Asian Breakout
KEENBASE SOFTWARE SOLUTIONS
4 (1)
KT Asian Breakout carefully analyzes the range-bound market during the Asian session and then fires a long or short trade after doing some preassessment based on its inbuilt technical analysis module. The executed orders are closed within a day before the completion of the next day session. The inbuilt technical analysis module checks for the session range and compares it with the last 20 days price movement. If it finds any erratic price movement within the session, the orders are not executed
Use of support and resistance in systematic trading is very subjective. Every trader has their own idea and way to plotting the support and resistance levels on the chart. KT Support and Resistance indicator take out this ambiguity out of the situation and automatically draws support and resistance levels following an algorithmic approach using a unique multi-timeframe analysis. When launched on the chart, It immediately scan the most significant extreme points across all the available timefra
ACB Breakout Arrows
KEENBASE SOFTWARE SOLUTIONS
4.15 (34)
O indicador ACB Breakout Arrows fornece um sinal de entrada essencial no mercado ao detectar um padrão especial de rompimento. Ele monitora constantemente o gráfico em busca de um momento de estabilização direcional e oferece um sinal preciso pouco antes de um grande movimento.  Obtenha o scanner multissímbolo e multitemporal aqui - Scanner para ACB Breakout Arrows MT4 Principais recursos O indicador fornece níveis de Stop Loss e Take Profit. Acompanha um painel de Scanner MTF que monitora sina
ACB Breakout Arrows MT5
KEENBASE SOFTWARE SOLUTIONS
5 (1)
O indicador ACB Breakout Arrows fornece um sinal de entrada crucial no mercado ao detectar um padrão especial de rompimento. O indicador escaneia constantemente o gráfico em busca de um momento de consolidação em uma direção e fornece o sinal preciso logo antes do movimento principal. Obtenha o scanner de múltiplos ativos e múltiplos períodos aqui - Scanner para ACB Breakout Arrows MT5 Principais recursos Níveis de Stop Loss e Take Profit são fornecidos pelo indicador. Acompanha um painel Scan
KT RSI Divergence Robot MT4
KEENBASE SOFTWARE SOLUTIONS
O KT RSI Divergence robot é um Expert Advisor 100 % automatizado que negocia divergências regulares e ocultas formadas entre o preço e o oscilador Relative Strength Index (RSI). Os sinais de divergência são obtidos do nosso indicador gratuito RSI Divergence. Nem toda divergência resulta numa reversão de preço bem-sucedida; por isso este EA combina os sinais brutos de divergência com o seu módulo interno de análise técnica para explorar a ineficiência de preço que surge após algumas divergência
KT Stoch Divergence MT5
KEENBASE SOFTWARE SOLUTIONS
A divergência é um dos sinais mais importantes para indicar uma possível reversão de preço no mercado. O indicador KT Stoch Divergence identifica divergências regulares e ocultas entre o preço e o oscilador estocástico. Limitações do KT Stoch Divergence Usar divergência estocástica como único sinal de entrada pode ser arriscado. Nem toda divergência representa uma reversão forte. Para melhores resultados, combine com ação do preço e direção da tendência. Recursos Identifica divergências regul
KT CCI Divergence MT5
KEENBASE SOFTWARE SOLUTIONS
KT CCI Divergence shows the regular and hidden divergence created between the price and CCI oscillator. Divergence is one of the vital signals that depicts the upcoming price reversal in the market. Manually spotting the divergence between price and CCI can be a hectic and ambiguous task. Limitations of KT CCI Divergence   Using the CCI divergence as a standalone entry signal can be risky. Every divergence can't be interpreted as a strong reversal signal. For better results, try to combine it w
ACB Trade Filter MT4
KEENBASE SOFTWARE SOLUTIONS
5 (1)
The ACB Trade Filter indicator provides a solution for filtering out the low probability trading setups in a trading strategy. The indicator uses a sophisticated filtration algorithm based on the market sentiment and trend. Applications Works great with our indicator " ACB Breakout Arrows ". Filter out low probability signals from any indicator. Avoid overtrading and minimize the losses. Trade in the direction of market sentiment and trend. Avoid the choppiness in the market. How to use Only L
KT Momentum Arrows
KEENBASE SOFTWARE SOLUTIONS
O indicador KT Momentum Arrows é baseado em uma quebra momentânea que é calculada usando a variação das bandas e a volatilidade emergente em determinada direção. Um sinal de compra é gerado quando o preço fecha acima da banda superior, e um sinal de venda é gerado quando o preço fecha abaixo da banda inferior. Um coeficiente de magnitude é utilizado como parâmetro de entrada, influenciando tanto a variação das bandas quanto a medição da volatilidade. O valor desse coeficiente deve ser escolhido
KT COG Advanced MT4
KEENBASE SOFTWARE SOLUTIONS
1 (1)
KT COG is an advanced implementation of the center of gravity indicator presented by John F. Ehlers in the May 2002 edition of Technical Analysis of Stocks & Commodities magazine. It's a leading indicator which can be used to identify the potential reversal points with the minimum lag. The COG oscillator catches the price swings quite effectively. MT5 version of the same indicator is available here KT COG Advanced MT5 Calculation of COG The COG indicator is consist of the two lines. The main l
KT Pin Bar
KEENBASE SOFTWARE SOLUTIONS
KT Pin Bar identifies the pin bar formation which is a type of price action pattern which depicts a sign of reversal or rejection of the trend. When combined with support and resistance, BRN and other significant levels, Pin Bar pattern proved to be a very strong sign of reversal. Basically, a pin bar is characterized by a small body relative to the bar length which is closed either in upper or lower 50% part of its length. They have very large wicks and small candle body. A pin bar candlestic
KT Trend Magic
KEENBASE SOFTWARE SOLUTIONS
KT Trend Magic shows the trend depiction on chart using the combination of market momentum and volatility. A smoothing coefficient is used to smooth out the noise from the signal.It can be used to find out the new entries or confirm the trades produced by other EA/Indicators. Usage Drag n drop MTF scanner which scans for the new signals across multiple time-frames. Find new entries in the trend direction. Improve the accuracy of other indicators when used in conjunction. Can be used as a dynami
KT Auto Fibo
KEENBASE SOFTWARE SOLUTIONS
O KT Auto Fibo desenha automaticamente os níveis de retração de Fibonacci com base na direção atual da tendência. Os pontos máximos e mínimos são selecionados automaticamente usando os valores máximos e mínimos disponíveis no gráfico. Você pode dar zoom e rolar o gráfico para ajustar os níveis de Fibonacci conforme necessário. Modos Automático:  Desenha automaticamente os níveis de Fibonacci com base na área do gráfico. Manual: Desenha os níveis de Fibonacci apenas uma vez. Depois disso, você p
KT Psar Arrows
KEENBASE SOFTWARE SOLUTIONS
O KT Psar Arrows plota setas no gráfico utilizando o indicador padrão Parabolic SAR. Uma seta de alta é desenhada quando a máxima da vela toca o SAR. Uma seta de baixa é desenhada quando a mínima da vela toca o SAR. Os sinais são gerados em tempo real, sem a necessidade de esperar o fechamento da vela.  Recursos Uma ferramenta útil para traders que desejam experimentar estratégias de negociação que envolvem o indicador Parabolic SAR.  Pode ser usado para identificar pontos de reversão no mercad
KT Ichimoku Trader
KEENBASE SOFTWARE SOLUTIONS
1 (1)
KT Ichimoku Trader is a fully automated expert advisor that offers five popular trading strategies based on the Ichimoku indicator. Each strategy has it's own entry and exit method without any interference to other strategies. The Ichimoku system can be applied to all major currency pairs and metals. However, we found that it performs reasonably well mainly on two pairs.   MT5 Version is available here  https://www.mql5.com/en/market/product/35043 Features Trade up to 5 famous trading strategi
KT Volatility Oscillator
KEENBASE SOFTWARE SOLUTIONS
O Oscilador de Volatilidade KT analisa os dados de mercado passados e atuais utilizando uma fórmula matemática para exibir o resultado na forma de um oscilador. As ondas crescentes e decrescentes equivalem a alta e baixa volatilidade do ativo.  Em resumo, a volatilidade é simplesmente uma medida das flutuações de preço de um ativo ao longo de um determinado período de tempo. Sem volatilidade, haveria pouco movimento no mercado e os traders não poderiam lucrar com as variações de preço. Uso da V
KT COG Robot
KEENBASE SOFTWARE SOLUTIONS
KT COG Robot is a fully automated Expert Advisor based on the KT COG Indicator . The COG indicator was originally presented by John F. Ehlers in the May 2002 edition of Technical Analysis of Stocks & Commodities magazine. The EA fires a long trade when COG line cross above the signal line and a short trade is fired when the COG line cross below the signal line.  Adaptive Filtration Our adaptive filtration algorithm combines the original COG formula with the major trend direction and market acce
ACB Breakout Arrows EA
KEENBASE SOFTWARE SOLUTIONS
Este é um Expert Advisor 100% automatizado baseado no nosso indicador personalizado chamado "ACB Breakout Arrows" . As entradas são baseadas em um padrão de rompimento que ocorre constantemente em ambas as direções. A intensidade dos sinais pode ser ajustada com o parâmetro externo "Signal Sensitivity". Confirmação de operações O ACB Breakout Arrows EA oferece a capacidade de filtrar entradas usando outro de nossos indicadores personalizados chamado ACB Trade Filter . Compra forte: Seta para c
KT London Breakout
KEENBASE SOFTWARE SOLUTIONS
First thirty minutes are essential for a trading session. The early reaction of traders and market players sets a path for the rest of the day. KT London Breakout EA takes advantage of this phenomenon, and after analyzing the first thirty minutes of London session, it places two bidirectional pending orders. One of pending order is eventually canceled after realizing the market direction with certainty. It has been strictly tested and developed for EUR/JPY using 30-Min Time Frame. You can expe
Use of support and resistance in systematic trading is very subjective. Every trader has their own idea and way to plotting the support and resistance levels on the chart. KT Support and Resistance indicator take out this ambiguity out of the situation and automatically draws support and resistance levels following an algorithmic approach using a unique multi-timeframe analysis. When launched on the chart, It immediately scan the most significant extreme points across all the available timefra
Se você negocia Forex, ter informações detalhadas sobre a força das moedas e a correlação entre os pares pode levar suas operações a um novo patamar. A correlação ajudará a reduzir o risco pela metade, enquanto a análise de força ajudará a maximizar os lucros. Este indicador oferece uma abordagem híbrida para selecionar os pares de moedas mais adequados, combinando análise de força e correlação entre pares de moedas. Como usar a Análise de Força das Moedas Suponha que sua estratégia de negociaç
MACD Divergence Seeker
KEENBASE SOFTWARE SOLUTIONS
KT MACD Divergence Seeker trades the regular and hidden divergence signals generated by our free indicator named KT MACD Divergence indicator. Trading the standalone divergences can be a risky affair that's why the KT MACD Divergence Seeker combines the standard divergence signals with an advanced analysis module to exploit the price inefficiencies on some FX pairs. What is the Divergence exactly? As a general conception if the price is making higher highs, then macd should also be making hig
KT Asian Breakout Indicator
KEENBASE SOFTWARE SOLUTIONS
O indicador KT Asian Breakout analisa uma parte crítica da sessão asiática para gerar sinais de compra e venda em ambas as direções, com base na quebra de preço. Um sinal de compra ocorre quando o preço rompe acima da máxima da sessão, enquanto um sinal de venda ocorre quando o preço rompe abaixo da mínima da sessão. Coisas para lembrar Se a caixa da sessão for muito ampla verticalmente, deve-se evitar uma nova negociação, pois a maior parte da ação do preço já ocorreu dentro da sessão. Se a ve
MACD Divergence MT4
KEENBASE SOFTWARE SOLUTIONS
O KT MACD Divergence mostra as divergências regulares e ocultas formadas entre o preço e o oscilador. Se sua estratégia de trading antecipa uma reversão de tendência, você pode usar a divergência regular do MACD para identificar possíveis pontos de virada. Já se sua estratégia é baseada na continuação da tendência, a divergência oculta do MACD será uma boa escolha. Limitações do KT MACD Divergence Usar a divergência do MACD como único sinal de entrada pode ser arriscado. Nem toda divergência d
KT Bollinger Bands Trader MT4
KEENBASE SOFTWARE SOLUTIONS
O KT Bollinger Bands Trader é um consultor especializado 100% automatizado que utiliza uma estratégia de reversão à média com base nas Bandas de Bollinger durante períodos de baixa volatilidade. O preço frequentemente reage nas linhas superior ou inferior das bandas, mas a reversão nem sempre ocorre. No entanto, as chances de reversão aumentam em momentos de baixa volatilidade. Entradas Uma compra é ativada quando o preço se alinha corretamente abaixo da linha inferior das Bandas de Bollinger.
KT CCI Divergence MT4
KEENBASE SOFTWARE SOLUTIONS
KT CCI Divergence shows the regular and hidden divergence created between the price and CCI oscillator. Divergence is one of the vital signals that depicts the upcoming price reversal in the market. Manually spotting the divergence between price and CCI can be a hectic and ambiguous task. Limitations of KT CCI Divergence   Using the CCI divergence as a standalone entry signal can be risky. Every divergence can't be interpreted as a strong reversal signal. For better results, try to combine it w
KT Heiken Ashi Smoothed MT4
KEENBASE SOFTWARE SOLUTIONS
KT Heiken Ashi Smoothed é uma versão suavizada do Heiken Ashi padrão e ainda exibe setas de compra/venda quando ocorre mudança de tendência. Seta de compra quando o estado muda de baixista para altista. Seta de venda quando o estado muda de altista para baixista. Alertas por push móvel, email, som e pop-up incluídos. O que é exatamente o Heiken Ashi Smoothed? Ele filtra sinais falsos e ruídos presentes no Heiken Ashi padrão aplicando duas médias móveis para suavizar o preço. Ignorando um leve
KT MA Crossover MT4
KEENBASE SOFTWARE SOLUTIONS
O KT MA Crossover desenha setas de compra e venda com base no cruzamento das médias móveis selecionadas. Além disso, ele também gera os alertas apropriados e exibe o valor de MFE (Excursão Mais Favorável) para cada sinal consecutivo. O cruzamento de médias móveis é uma das estratégias mais utilizadas por traders em todo o mundo. Normalmente envolve uma média móvel rápida e uma lenta para identificar sinais de compra e venda com base na direção do cruzamento. Sinal de compra – quando a média móv
KT Round Numbers MT4
KEENBASE SOFTWARE SOLUTIONS
KT Round Numbers plots the round number levels which are also commonly known as psychological levels in the Forex world. In the context of Forex trading, round number levels are those levels in which there are two or more zeroes at the end. They are named as 00 levels on the chart. Some traders also consider the halfway points as a valid round number level. They are named as 50 levels on the chart. Use of round number levels in trading Round number levels work as strong support and resistance
Filtro:
Vitalii Bogdanov
207
Vitalii Bogdanov 2025.10.28 12:05 
 

O usuário não deixou nenhum comentário para sua avaliação

KEENBASE SOFTWARE SOLUTIONS
55202
Resposta do desenvolvedor Nitin Raj 2025.11.05 18:02
I’m sorry to hear you’re having trouble. The alerts are working correctly for other users, so this is likely just a setup issue. Could you please check whether push notifications are enabled in MT5 and that your MetaQuotes ID is correctly entered in the terminal settings?
Responder ao comentário