WaveTrend Oscillator WT
- Indicadores
- Versão: 4.0

The WaveTrend Oscillator indicator is an enhanced version of the classic WaveTrend Oscillator, a momentum indicator. It is designed to identify overbought/oversold conditions and provide potential trend reversal signals.
The core difference in this version is the application of a data "normalization" algorithm. This ensures the indicator's oscillation lines remain balanced around the zero line, causing the indicator window to always stay naturally centered. This is especially useful when trading volatile assets (like Gold or Crypto), where standard WaveTrend versions can have their scales thrown off.
Installation
To install the indicator into the MetaTrader 5 platform, follow these steps:
- Open MetaEditor: From the MT5 platform, go to the Tools menu -> MetaQuotes Language Editor (or press the F4 key).
- Find the Indicators Folder: In the MetaEditor's Navigator window (usually on the left), navigate to the MQL5 -> Indicators directory tree.
- Copy the File: Drag and drop the .mq5 file into this Indicators directory.
- Refresh or Restart: Return to the MT5 platform. In the Navigator window, right-click and select Refresh , or simply restart MT5.
- Usage: Drag indicator onto the chart you wish to analyze.
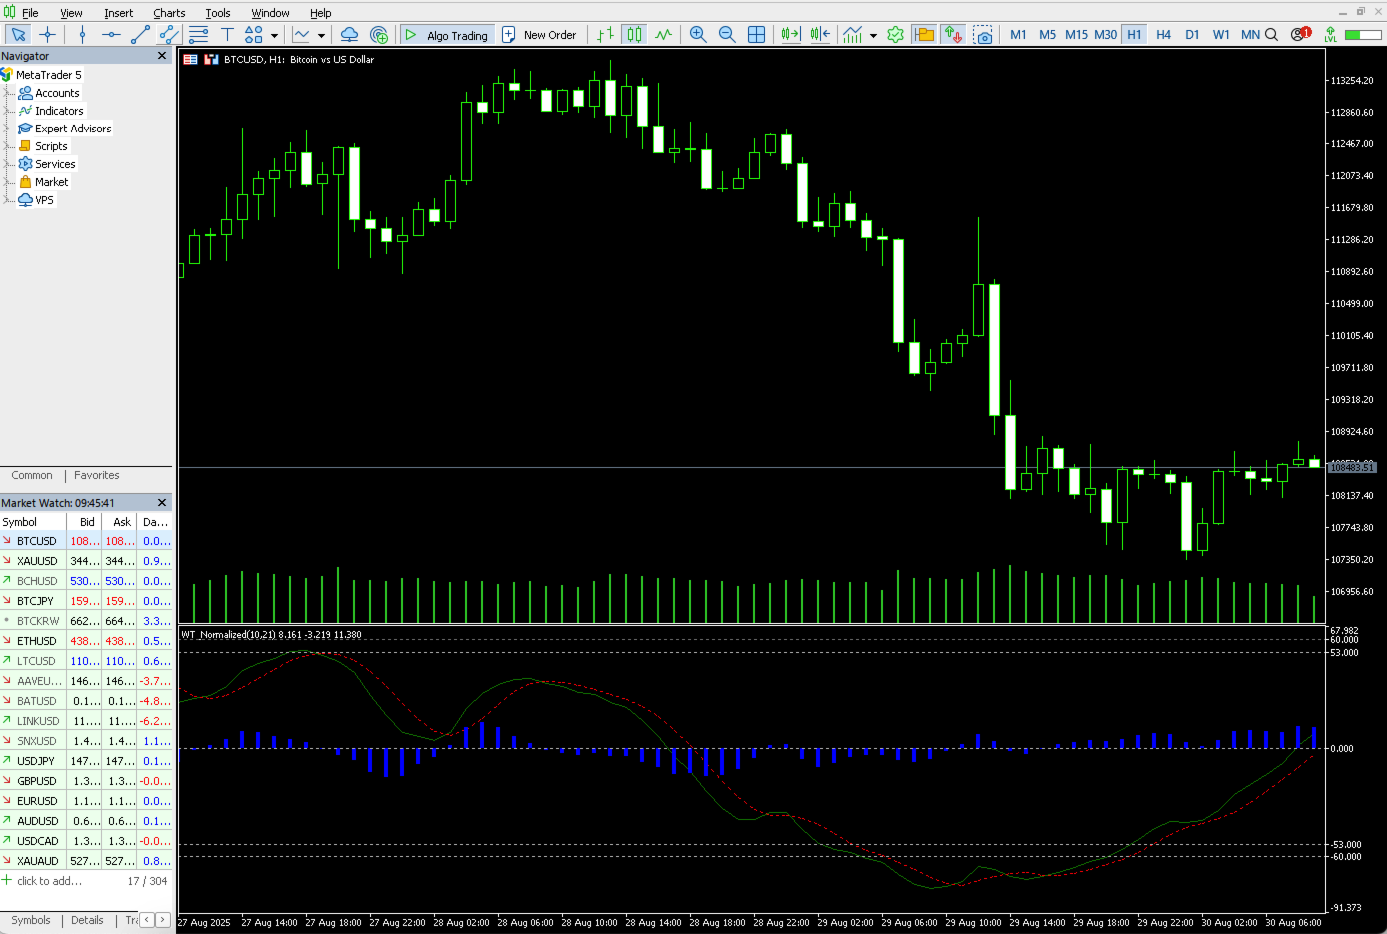
Indicator Components
- WT1 Line (Fast Line - Green): This is the main WaveTrend line, sensitive to recent price changes.
- WT2 Line (Signal Line - Dotted Red): This is a moving average (SMA) of WT1. It moves more slowly and acts as a signal line to confirm trends.
- Histogram (Blue Bars): Visualizes the difference between WT1 and WT2. Tall bars indicate strong momentum; short bars indicate weak momentum.
- Zero Line (Level 0): The centerline of the indicator.
- Overbought/Oversold (OB/OS) Levels: The dotted horizontal lines at levels 60, 53, -53, -60. They help identify extreme price zones.
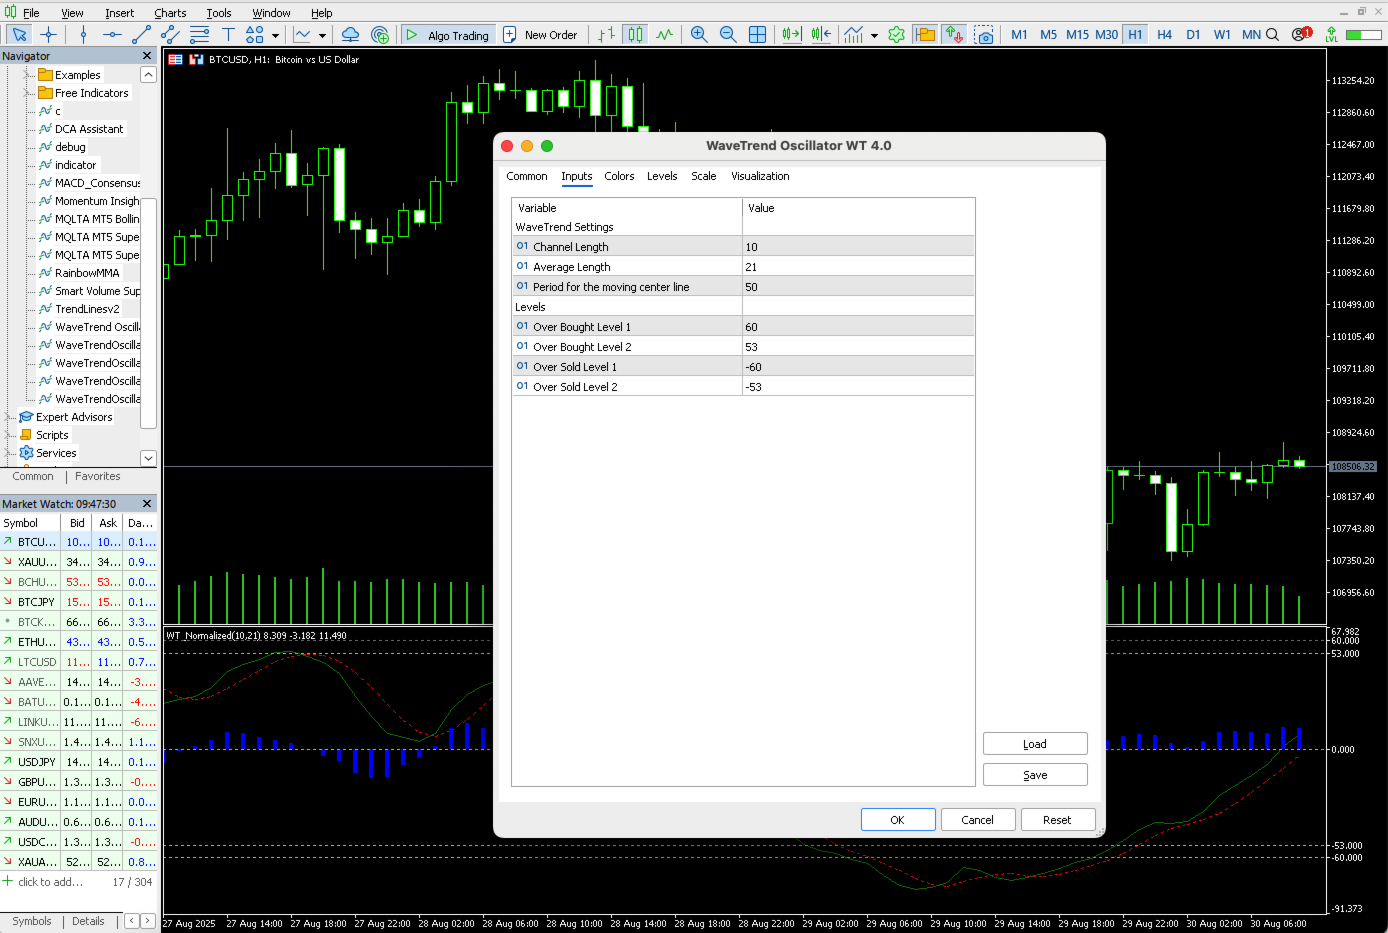
Input Parameters
When adding the indicator to a chart, you can customize the following parameters in the "Inputs" tab.
- WaveTrend Settings:
- n1 (Channel Length) : The length of the price channel for calculation. Smaller values make the indicator more sensitive; larger values make it smoother. Default is 10.
- n2 (Average Length) : The period of the EMA used for smoothing. Default is 21.
- centerMAPeriod : The period of the SMA used to "normalize" the data. This is the heart of this version. A larger value will make the center line adapt more slowly to price fluctuations. Default is 50.
- Levels:
- obLevel1 , obLevel2 : The overbought levels.
- osLevel1 , osLevel2 : The oversold levels.
How to Use and Trading Strategies
a. Crossover Signals
This is the most common use case:
- BUY Signal: When the green line (WT1) crosses ABOVE the red line (WT2). The signal is stronger and more reliable if this crossover occurs below the zero line, especially in the oversold area (below -60).
- SELL Signal: When the green line (WT1) crosses BELOW the red line (WT2). The signal is stronger if this crossover occurs above the zero line, especially in the overbought area (above 60).
b. Identifying Overbought/Oversold Conditions
- Overbought: When the oscillator lines are above the obLevel1 (60), the market is considered overbought. This is a sign that the bullish momentum may be ending, and a downward correction could occur. This is a good time to look for sell signals.
- Oversold: When the oscillator lines are below the osLevel1 (-60), the market is considered oversold. The bearish momentum may be ending, and an upward recovery could occur. This is a good time to look for buy signals.
c. Divergence Signals
Divergence is one of the most powerful signals WaveTrend can provide.
-
Bullish Divergence:
- On the Price Chart: Price makes a lower low.
- On the Indicator: WaveTrend makes a higher low.
- Meaning: Selling pressure is weakening. Even though the price fell, the momentum of the fall is much weaker. This is an early signal for a potential bullish reversal.
-
Bearish Divergence:
- On the Price Chart: Price makes a higher high.
- On the Indicator: WaveTrend makes a lower high.
- Meaning: Buying pressure is weakening. Even though the price rose, the momentum of the rise is fading. This is an early signal for a potential bearish reversal.
Important Note:
No indicator is perfect. WaveTrend works best when combined with other analysis methods, such as:
- Price Action Analysis.
- Support & Resistance levels.
- Trend Lines.
- Candlestick Patterns.