Sync Master

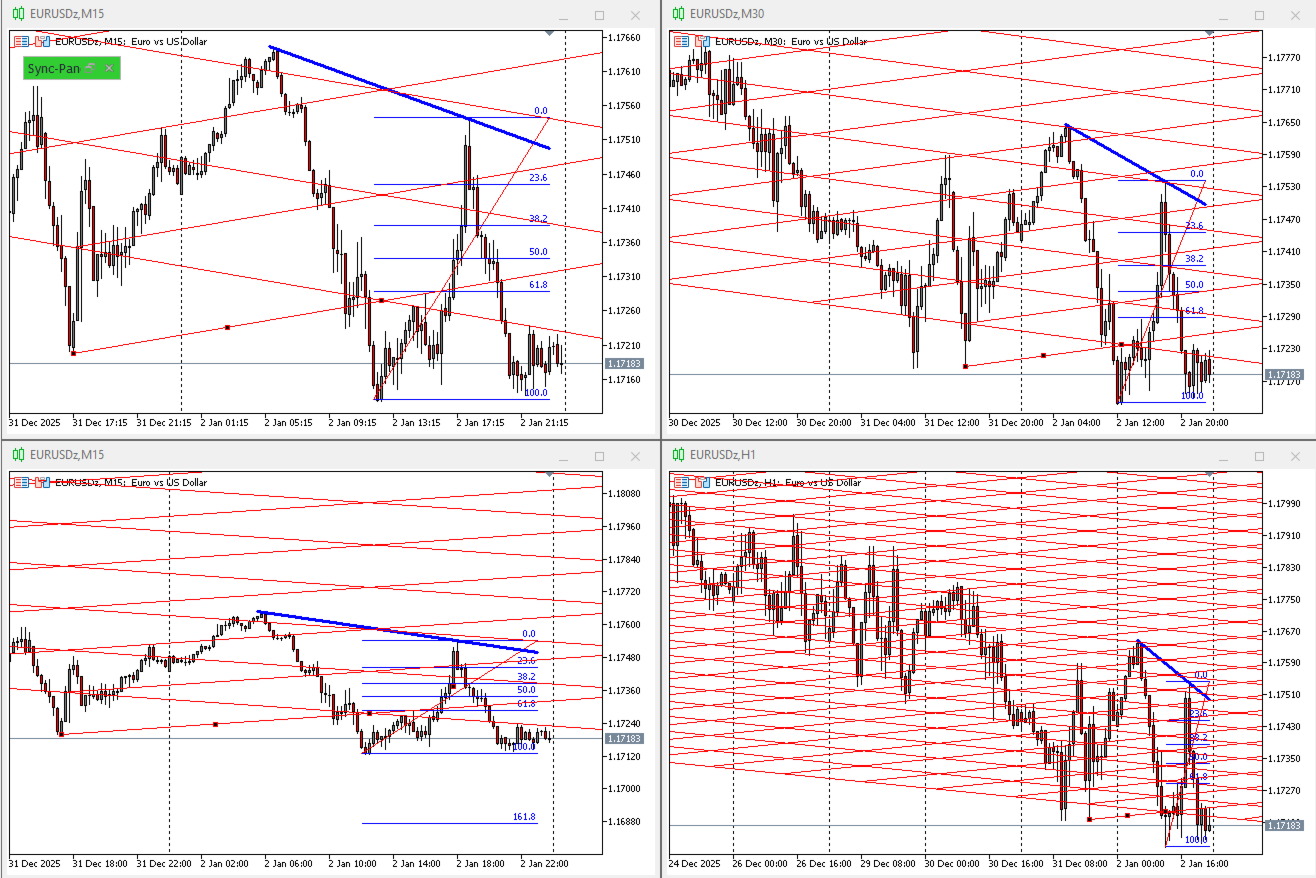
Sync Master  objects synchronization


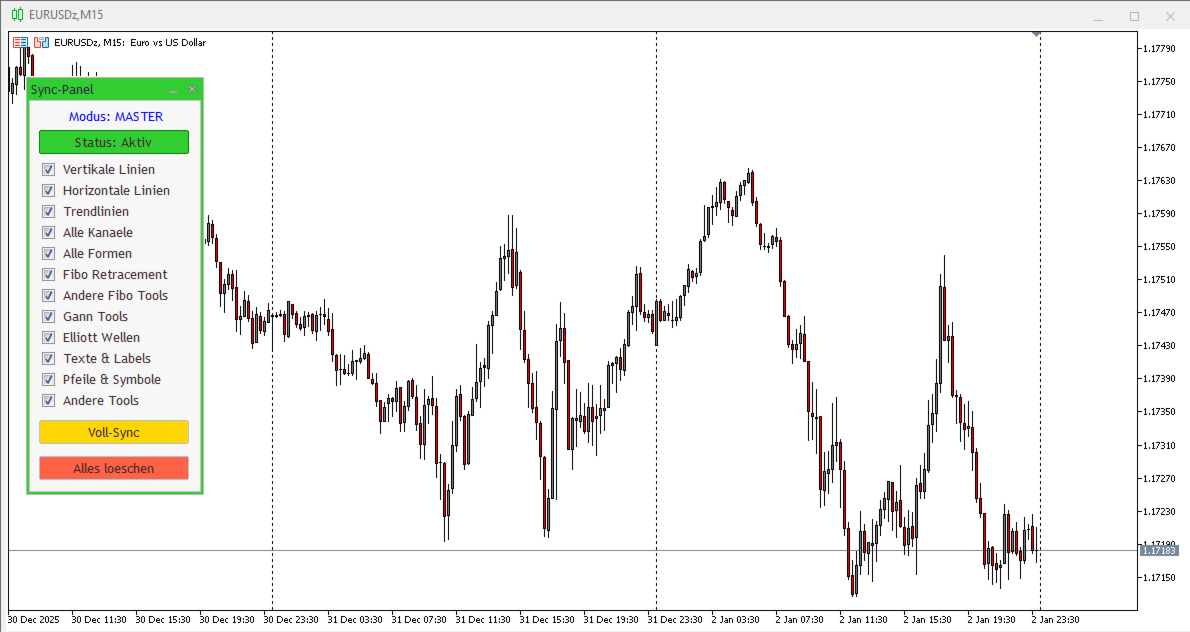
1. 모드 선택:

- SYNC_MASTER: 하나의 차트에만 설치합니다. 동일한 심볼을 공유하는 모든 다른 차트에 객체를 복사합니다.

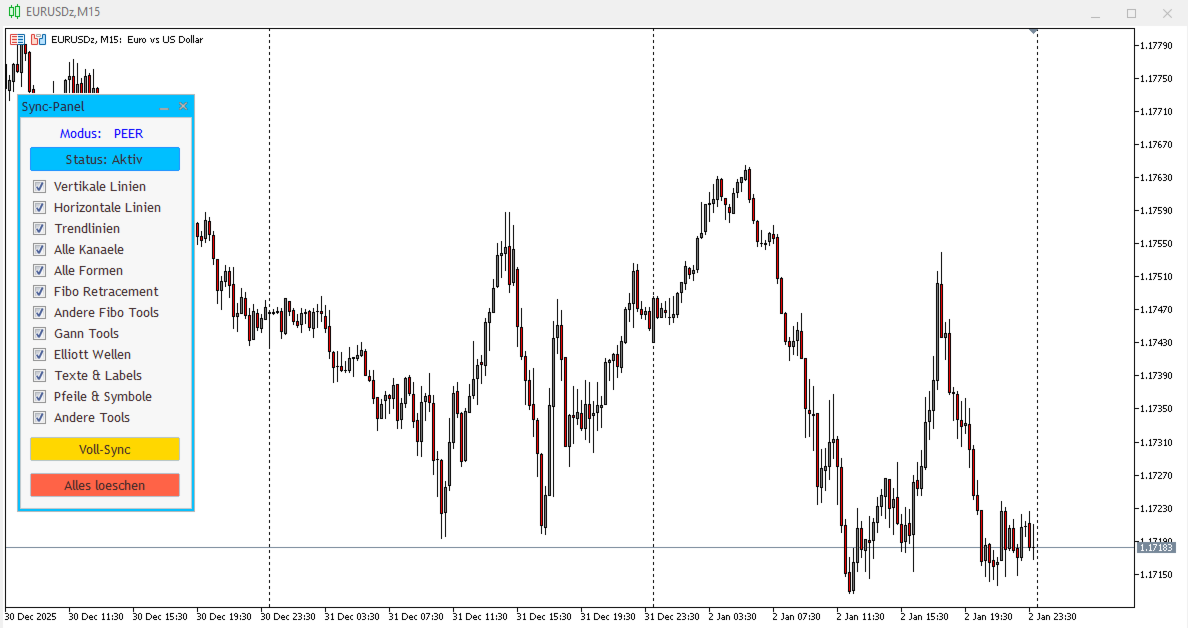
- SYNC_PEER: 동기화하려는 모든 차트에 설치합니다(동일한 심볼이어야 함).

2. 기능:

- 체크박스: 동기화할 객체 유형을 선택합니다.

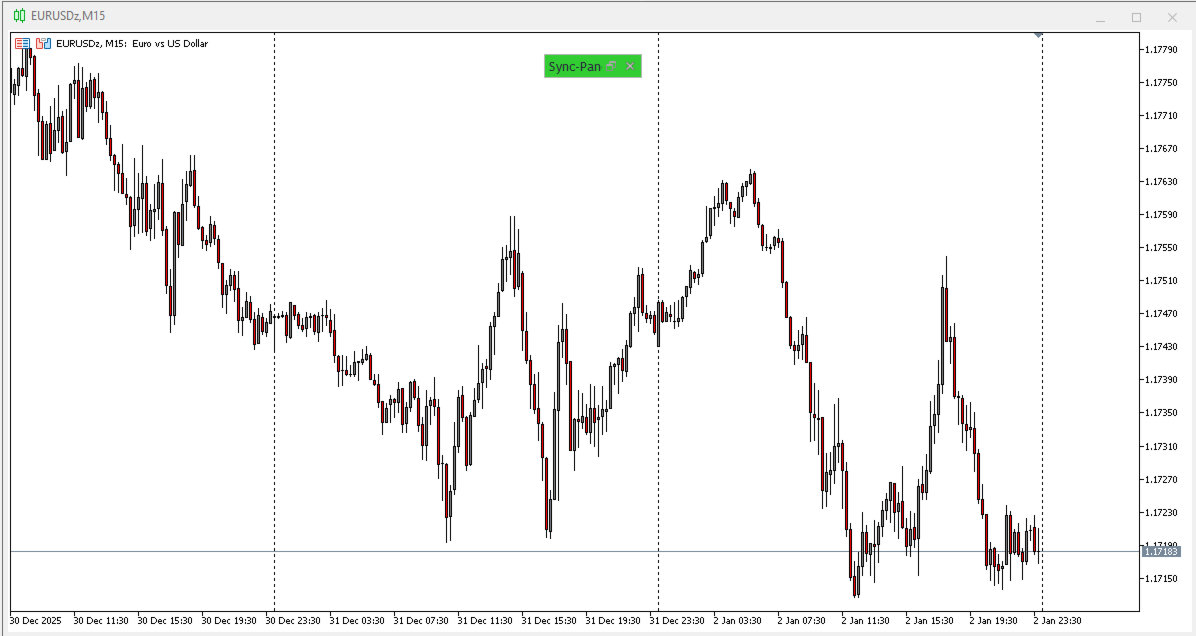
- 상태(활성/비활성): 표시기를 제거하지 않고 동기화를 켜거나 끕니다.

- 전체 동기화: 기존의 모든 객체를 즉시 복사합니다.

- 모두 삭제: 대상 차트에 그려진 모든 객체를 삭제합니다(패널은 유지).

======================================================================
[EN] INSTRUCTIONS
======================================================================
1. CHOOSE MODE:
   - SYNC_MASTER: Install on ONE chart only. It copies objects to ALL
     other charts sharing the SAME symbol.
   - SYNC_PEER: Install on EVERY chart you want to sync (must have same symbol).

2. FEATURES:
   - Checkboxes: Select which object types to synchronize.
   - Status (Active/Inactive): Toggles synchronization on/off without
     removing the indicator.
   - Full Sync: Forces immediate copying of all existing objects.
   - Delete All: Deletes all drawn objects on target charts (keeps the panel).
추천 제품
AutoFibonacci draws Fibonacci retracement and extension levels automatically. It finds the significant swing high and low on the chart itself, so the levels appear without you drawing anything, and they update as new highs and lows form. Drawing Fibonacci by hand has a practical problem: you choose the swing. Two traders looking at the same chart pick different points and get different levels. This indicator removes that step. It works on any symbol and any timeframe. How the range is chosen Thr
FREE
DFG Chart
Tsvetan Tsvetanov
The DFG Chart Indicator displays the historical DFG levels used in the DFG dashboard. These levels are generated dynamically using moving averages and Fibonacci ratios. The Fibonacci Bands automatically adjust to reflect changes in the price range and trend direction. The indicator also features buttons for selecting chart symbol and timeframe, along with a wide range of customization options. Key Features Dynamic DFG Levels Automatically calculated using moving averages and Fibonacci ratios. H
FREE
Babel Assistant
Iurii Bazhanov
4.33 (9)
Babel assistant 1 MT5 넷팅(netting) 로봇 "Babel_assistant_1"은 ZigZag 지표를 사용하여 M1, M5, M15, H1, H4, D1 및 W1 타임프레임 전반에 걸쳐 피보나치 수준을 생성하고, 매수 및 매도 트렌드의 강도를 계산합니다. 지정된 트렌드 수준 4.925를 초과하면 "Lot for open a position" 설정을 사용하여 포지션을 엽니다. 그런 다음, Babel은 특정 피보나치 수준에 대기 주문(pending orders)을 배치하고 지정된 손절매(Stop Loss) 및 이익실현(Take Profit) 라인을 설정합니다. 화면에는 포지션, 거래 및 트렌드의 현재 결과가 표시됩니다. 0.02랏 이상의 수동 포지션 증가는 로봇에 의해 자체 대기 주문의 트리거로 인식됩니다. 0.01랏의 대기 주문 또는 시장가 주문은 체결 시 단순히 포지션 볼륨을 변경합니다. 면책 조항: 아래에 제시된 자료는 정보 제공 및 교육 목적으로만 제공됩니다
FREE
Projection of Phi
Nestor Jose Mendez Boza
Projection of Phi   Is a technical indicator that calculates dynamic support and resistance levels. It uses angular geometric projections and mathematical ratios to identify market expansion ranges. Features: Dynamic Fibonacci Expansion: Extension level projection Geometric Calculation: Angular analysis and mathematical ratios Visualization: Graphical objects with informative labels Compatibility: M1 to H4 timeframes Applications: Identification of zones for trade management Analysis of volatil
FREE
BrioQuant Trading Sessions
Mitchell Dean Ede
5 (1)
See Asia, London and New York as real high-low boxes, with optional fills and opening-window overlays. BrioQuant Trading Sessions draws Asia, London and New York as boxes fitted to each session's actual high and low. Choose broker time or GMT with automatic broker-offset handling, then add optional fills, labels and opening-window boxes. Features: - Boxes hug each session's real range, not arbitrary full-height bands - Optional background fills, auto-tinted from your session colours - Optional
FREE
The jcoworld OTE EA is an automated trading bot for MetaTrader 5 built on Smart Money Concepts (SMC) . It accurately identifies market impulse moves and automatically enters trades within the Optimal Trade Entry (OTE) zone (61.8% – 79.0% Fibonacci) as soon as a confirmation candle closes. Optimized for: XAUEUR, XAUUSD, and Major Forex Pairs Features: Automatic risk management, dynamic lot sizing & automated Stop Loss/Take Profit. Try for free: This demo version is 100% free! Pricing Plans for Fu
FREE
EA34 Tanin Force
Nhat Tien Duong
5 (2)
[FREE EA] EA34 TANIN FORCE: MACD & STOCH ENGINE (Prop Firm Ready) Are you tired of market noise and false breakouts? Meet EA34 Tanin Force, a commercial-grade Expert Advisor designed specifically for the EURUSD on the M15 timeframe. This system combines the raw trend-following power of MACD with the precision timing of the Stochastic Oscillator. PERFORMANCE HIGHLIGHTS (6-Year Stress Test 2020 - 2026): * Symbol & Timeframe: EURUSD | M15 * Set & Forget: Hard Stop Loss and Take Profit. No
FREE
The   DailyWeeklyMarkers   indicator helps traders visualize trading weeks by clearly marking the start of each day and week on the chart. It draws vertical separator lines for each day (including weekends if enabled) and highlights the beginning of new trading weeks with double lines for better clarity. This makes it easier to analyze price action within daily and weekly contexts. Who Is This Indicator For? Swing Traders   – Helps identify weekly opening gaps and key levels. Day Traders   – Vis
FREE
**IAT Sessions** marks the London, New York, Sydney, and Tokyo trading sessions directly on your chart, with an optional magnified price display. **Key features:** - **DST-aware session hours** — Auto mode adjusts London, NY, and Sydney times for daylight saving automatically (Tokyo has none); an Auto+Cut variant ends a session the moment the next one opens; Manual mode lets you set exact hours yourself. - **Flexible display** — draw sessions as a rectangle box, a filled box, or horizontal hig
FREE
Key Liquidity Levels and Confirmation shows where liquidity is resting on the chart and marks the moment it is taken. It combines three steps of one trading idea in a single tool: the key level, the sweep of that level, and the confirmation that follows. KEY LEVELS - Asia, London and New York session highs and lows - Previous day high and low (PDH / PDL) - Previous week high and low (PWH / PWL) - Previous month high and low - All-time high and all-time low Levels that share the same price are
FREE
Fibonacci Font Label
Rajesh Kumar Nait
이 표시기를 사용하면 큰 글꼴 크기로 피보나치 레벨 레이블을 표시할 수 있습니다. . 최대 25개의 피보나치 레벨을 지원합니다. - 피보나치를 그리자마자 선택한 색상과 글꼴로 큰 글꼴 크기의 입력 매개변수로 추가한 레벨이 표시됩니다. 맞춤형 옵션: 1. Fibo 텍스트 글꼴 2. Fibo 텍스트 크기 3. Fibo 텍스트 색상 3. 각 레벨에 설명 추가 4. 앵커 및 각도와 같은 기타 옵션 이 표시기를 사용하면 큰 글꼴 크기로 피보나치 레벨 레이블을 표시할 수 있습니다. . 최대 20개의 피보나치 레벨을 지원합니다. - 피보나치를 그리자마자 선택한 색상과 글꼴로 큰 글꼴 크기의 입력 매개변수로 추가한 레벨이 표시됩니다. 맞춤형 옵션: 1. Fibo 텍스트 글꼴 2. Fibo 텍스트 크기 3. Fibo 텍스트 색상 3. 각 레벨에 설명 추가 4. 앵커 및 각도와 같은 기타 옵션
FREE
This indicator is a **Pivot-Confluence Zone Identifier** that focuses exclusively on identifying key support and resistance levels where price clusters align with classic pivot points. Here's what it does: ## Core Functionality **Pivot Confluence Detection**:  - Only displays price zones that align with classic pivot point levels (R1, R2, R3, S1, S2, S3) - **Excludes the main pivot point** - focuses only on support and resistance levels - Uses a configurable pip range to detect confluence nea
FREE
Support and Resistance ACPG
Victor Alfonso Molina Botello
Support And Resistance ACPG Indicator  The Support And Resistance ACPG Indicator  (developed by Grok by xAI) is an advanced tool for the MetaTrader 5 (MQL5) platform, designed to identify and visualize support and resistance zones on a price chart. Unlike traditional support and resistance indicators, the ACPG method combines a dynamic approach based on swing points, volatility analysis using the Average True Range (ATR), and an adaptive clustering system to detect high-relevance zones in the
FREE
During volatile market conditions brokers tend to increase spread. int OnCalculate ( const int rates_total,                  const int prev_calculated,                  const datetime &time[],                  const double &open[],                  const double &high[],                  const double &low[],                  const double &close[],                  const long &tick_volume[],                  const long &volume[],                  const int &spread[])   {    int spread_array[];   
FREE
AR Projection
Milana Muslimova
Average Range Projection (ADR / AWR / AMR) – Milana Trades This indicator shows how far price can still move today, this week or this month, based on its average range. THE IDEA Every market has a normal size of a day. If the market usually moves 100 points a day and the low of the day is already in, the high of the day is likely to be about 100 points above that low. The indicator draws this for you. WHAT MAKES IT DIFFERENT Most ADR tools draw fixed levels from the open. This indicator uses
FREE
MOHD-iK Coding HUB presents MOHD-iK GOLD Ballestic Pro , the premium, high-precision trading solution engineered for Gold (XAUUSD).This Pro Version represents the full evolution of my trading logic, meticulously designed for capital preservation, advanced risk management, and professional-grade performance. After purchase, text me for the set file. Also, mention your starting balance. IMPORTANT: READ BEFORE INSTALLATION To ensure the EA operates with maximum efficiency and connects to critical
FREE
ICT Killzone Scalper
Mike Wilson Namaru
ICT Killzone Scalper – 스마트 머니 자동 매매 시스템 정밀한 자동화로 Inner Circle Trader 매매 기법을 마스터하십시오 주요 트레이딩 세션 동안 완벽한 셋업을 놓치는 것에 지치셨나요? ICT Killzone Scalper 는 전문가 수준의 스마트 머니 개념을 MT5 터미널에 구현합니다. 검증된 ICT 트레이딩 전략 과 지능형 자동화 시스템을 결합하여 일관되고 체계적인 수익을 추구합니다. 기술 세부 사항 심볼: XAUUSD (골드) 타임프레임: M15 리스크: 1% (조절 가능) 예치금: 최소 $200 / 권장 $1,000 이상 레버리지: 1:50 이상 (1:100 이상 권장) 계좌 타입: ECN/RAW VPS: 권장 이 EA(자동 매매 프로그램)의 차별점은 무엇인가요? 독자적인 ICT 시그널 엔진: 3대 킬존(Killzone) 세션 – 런던, 뉴욕, 아시아 세션 (최적화된 시간대 설정). 시장 구조 변화(MSS) 감지 – 시세 폭발 전 모멘텀 포착. 최
FREE
Auto Fib Retracements
Ross Adam Langlands Nelson
4.2 (5)
Automatic Fibonacci Retracement Line Indicator. This indicator takes the current trend and if possible draws Fibonacci retracement lines from the swing until the current price. The Fibonacci levels used are: 0%, 23.6%, 38.2%, 50%, 61.8%, 76.4%, 100%. This indicator works for all charts over all timeframes. The Fibonacci levels are also recorded in buffers for use by other trading bots. Any comments, concerns or additional feature requirements are welcome and will be addressed promptly. 
FREE
LZ Auto Fibo Retracement
Lukasz Tomasz Zychal
LZ Auto Fibo Retracement automatically detects the most significant swing highs and lows on your chart and instantly draws accurate Fibonacci retracement levels between them. Stop drawing Fibs manually—let the indicator do it for you dynamically as the market evolves. Feature highlights - Auto Swing Detection: identifies the most relevant market extremes based on a configurable swing period and lookback range. - Dynamic Updates: the Fibonacci levels automatically adjust to new highs and lows
FREE
Free automatic Fibonacci is an indicator that automatically plots a Fibonacci retracement based on the number of bars you select on the BarsToScan setting in the indicator. The Fibonacci is automatically updated in real time as new highest and lowest values appears amongst the selected bars. You can select which level values to be displayed in the indicator settings. You can also select the color of the levels thus enabling the trader to be able to attach the indicator several times with differe
FREE
LT Agression Indicator
Thiago Duarte
5 (3)
This is a buyer and seller aggression indicator that analyzes the shape of each candle and project this data in a histogram form. There are 4 histograms in one. On the front we have two: Upper - Buyer force. Lower - Seller force. At the background we also have two histogram, both with same color. They measure the combined strenght of buyers and sellers. This histograms can be turned off in Input Parameters. It is also possible to have the real or tick volume to help on this force measurement. IN
FREE
Rectangle editor
Yeny Lucia Caro Useda
5 (1)
Rectangle Editor – Control total sobre tus zonas Rectangle Editor es una herramienta avanzada diseñada para traders que utilizan zonas, bloques o áreas de interés en su operativa. Permite , editar y gestionar rectángulos directamente en el gráfico de forma rápida, precisa y profesional. El indicador facilita la manipulación de objetos rectangulares en el gráfico, permitiendo: Dibujar zonas de oferta y demanda Marcar Order Blocks Delimitar Fair Value Gaps (FVG) Definir zonas de ent
FREE
Ratio
Radim Kucera
3.67 (3)
This indicator shows ratios between extremes on the chart. You can specify your own ratios (e.g. Fibonacci). Parameters Most important Density - how much in details to search ratios in extremes. Bigger number means less details, smaller number means more details. Base unit is 1 bar on the chart. History - how far to go in history while searching. When you set -1, the indicator processes all bars from history. Base unit is 1 bar on the chart. Range - how far search ratios from given extreme. Bas
FREE
Easy Support and Resistance
Danny Giovanni Romero Lozano
EASY SUPPORT AND RESISTANCE Visualize support and resistance levels across multiple timeframes with dynamic color-coded lines Overview This powerful MT5 indicator automatically identifies and highlights key price levels by drawing rectangles on the last closed candle and its first opposite-colored candle across six different timeframes (M15, M30, H1, H2, H4, D1). The lines dynamically change color based on price action confirmation, transforming into support or resistance levels when validated
FREE
XAU VWAP Mean Reversion H4 Expert Advisor for MetaTrader 5 — Gold / XAUUSD focus Version: 1.00 What it is XAU VWAP Mean Reversion H4 is an Expert Advisor for gold on the H4 chart. Intraday VWAP mean-reversion style participation on gold H4. Built for structured automated participation — not grid , not martingale . Evaluate on your broker and risk profile before any live use. This product is a technical system . Exact thresholds and entry equations remain internal product design and are not publ
FREE
The   Pivot Point indicator   automatically calculates and displays the pivot point line and support and resistance levels. Pivot can be calculated according to the Classic, Floor, Fibonacci, Woodie, Camarilla or DeMark formula. It is also possible to select the period for calculating the indicator. A trader can choose from daily, weekly, monthly, or user-defined periods. Types of pivots Classic Floor Fibonacci Woodie Camarilla DeMark Main features The indicator shows the current and historic
FREE
Auric Mohd iK
Md Iqbal Kaiser
AURIC MOHD-iK is a dynamic, logic-based Expert Advisor (EA) engineered specifically for trading XAUUSD (Gold). Unlike standard trading systems that rely on lagging, unreliable indicators, this EA operates purely on clean price logic—executing trades the way an experienced human trader naturally reads the market. This version is completely free with limitations, offering permanent value to your trading setup with zero hidden costs. Active Auric Mode That's it!!!!!!!!!! Core Trading Parameters Ac
FREE
Cybertrade Keltner Channels
Emanuel Andriato
4.67 (6)
Cybertrade Keltner Channels - MT5 Created by Chester Keltner, this is a volatility indicator used by technical analysis. It is possible to follow the trend of financial asset prices and generate support and resistance patterns. In addition, envelopes are a way of tracking volatility in order to identify opportunities to buy and sell these assets. It works on periods longer than the period visible on the chart. All values ​​are available in the form of buffers to simplify possible automations.
FREE
SR zones ATR adaptive
Dimitri Patrick A Daumerie
SR Zones ATR-Adaptive — Multi-Timeframe Support & Resistance Support and resistance, built the way price actually respects it: as zones, not single lines. Most S/R indicators either plot raw fractals (noisy, fixed sensitivity) or a handful of manually-placed horizontal lines. SR Zones ATR-Adaptive instead detects confirmed swing pivots and clusters the ones that are genuinely close together into clean price zones — then ranks them by how many times price has actually reacted there. Zone width i
FREE
Pivots Lines
Abakou Nazaire Ayelenou
5 (1)
모든 시간대에 Traditionnal, Fibonacci, Woodie, Classic, Demark, Camarilla의 피벗 포인트 그리기 모든 유형의 피벗 Traditionnal, Fibonacci, Woodie, Classic, Demark, Camarilla 지원 모든 기간 지원(M1...H1...D1...MN1...매년) 서버 일광 절약 시간제 지원 시드니에서 미국으로 열리는 외환 일일 섹션 지원 닫기 암호화 거래 지원 피벗과 추세 사이의 간격을 채우면 매우 유용합니다. 피벗 포인트는 추세의 방향을 보여주고 수요와 공급을 모니터링하기 위한 결정적인 영역을 제공합니다. 추세 지표로서 피벗 포인트는 주로 감상적 분석에 도움이 됩니다. PP보다 높은 가격은 강세를 나타내고, PP보다 낮은 가격은 시장에서 약세를 나타냅니다.
FREE
이 제품의 구매자들이 또한 구매함
Trend Sniper X
Sarvarbek Abduvoxobov
4.9 (42)
Trend Sniper X 는 트레이더가 추세 방향과 잠재적 반전 지점을 명확하고 정확하게 포착할 수 있도록 도와주는 MetaTrader 5용 멀티 타임프레임 추세 추종 지표입니다. MT4용: https://www.mql5.com/en/market/product/193245 가격 정보: 현재 가격은 프로모션 할인가이며, 향후 업데이트 및 새로운 기능이 출시됨에 따라 변동될 수 있습니다. 보너스 혜택: 본 지표 전용 무료 자동매매 Assistant EA를 받으시려면 구매 후 작성자에게 메시지를 보내주시기 바랍니다. Code2Profit 채널 멀티 타임프레임 분석으로 시장을 마스터하세요! Trend Sniper X로 승률을 극대화하는 방법: 핵심 규칙 및 세션 팁 기술 사양 플랫폼 MetaTrader 5 지표 유형 멀티 타임프레임 추세 지표 운용 타임프레임 모든 차트 타임프레임 지원, 독립적으로 선택 가능한 상위 타임프레임(M1–MN1) 주요 상품 외환, 금(XAUUSD) 및 기타 C
Smart Trend Trading System — MetaTrader 5 구매 후 MQL5에서 저에게 메시지를 보내시면 Smart Universal Expert Advisor를 무료로 받으실 수 있으며, 온라인 강좌, PDF 매뉴얼 및 비공개 그룹 이용 권한도 함께 제공됩니다. STTS는 추세 방향, 진입·청산 신호, 반전 구간, 주요 가격 수준을 차트에 모아 보여줍니다. 시스템을 참고해 수동으로 거래하거나, 별도의 호환 EA를 연결하여 선택한 설정에 따라 자동으로 거래를 실행할 수 있습니다. 하나의 시스템, 네 가지 트레이딩 접근법 STTS의 트레이딩 접근법은 크게 네 가지로 나뉩니다. • 스캘핑 — 단기 신호와 시장 움직임을 살펴봅니다. • 추세 매매 — 방향을 평가하고 추세 안에서 기회를 찾습니다. • 반전 매매 — 잠재적인 전환 구간과 방향 변화를 파악합니다. • 거래량 매매 — 거래량 기반 정보로 시장 활동을 평가합니다. 진입·청산 화살표, 추세 정보, 지지·저항 수
Zoryk Gold
Reda El Koutbane
4.76 (17)
ZORYK — MetaTrader 5용 XAUUSD 전문 신호 및 트레이드 플래닝 시스템 이런 경험이 있을 것입니다. 골드를 분석하고 진입을 기다린 뒤 마침내 포지션을 열었지만 가격이 곧바로 반대 방향으로 움직입니다. 너무 일찍 청산하거나 Stop Loss를 옮기거나 몇 초 동안 망설입니다. 그 후 시장은 내가 없이도 처음 예상했던 목표까지 정확히 움직입니다. 문제는 항상 방향이 아니었습니다. 진짜 문제는 불확실성이었습니다. 정확한 진입 위치를 몰랐습니다. 어느 지점에서 원래의 트레이드 아이디어가 무효가 되는지 몰랐습니다. 가까운 수익을 확보해야 할지 더 큰 움직임을 기다려야 할지 판단하기 어려웠습니다. 현재 setup이 정말 강한지 아니면 단지 새로운 거래를 억지로 찾고 있는지도 확신하기 어려웠습니다. 골드는 매우 빠르게 움직입니다. 명확한 계획이 없다면 좋은 분석도 몇 초 만에 나쁜 결정으로 바뀔 수 있습니다. ZORYK는 이 문제를 해결하기 위해 개발되었습니다.
SuperScalp Pro
Van Minh Nguyen
4.56 (36)
SuperScalp Pro - Professional Multi-Layer Confluence Scalping System SuperScalp Pro는 클래식 Supertrend에 여러 지능형 확인 필터를 추가한 고급 스캘핑 지표입니다. 더 높은 확률의 Buy/Sell 거래 기회를 식별하는 데 도움을 주며, 잘못된 신호를 크게 줄이는 데 도움을 줍니다. 명확한 Buy 및 Sell 화살표가 차트에 직접 표시되며, ATR 기반 Stop Loss 및 Take Profit 수준이 실시간으로 자동 계산됩니다. 구매 후 설정 방법 및 권장 구성에 대한 안내가 필요하시면 저에게 문의해 주세요. SuperScalp Pro Auto Trader를 사용하여 신호를 쉽게 자동화할 수 있습니다: [Auto Trader] 권장 설정 파일 다운로드: [Set File] 전체 문서는 제품 블로그에서 확인할 수 있습니다: [User Guide] 업데이트를 확인하려면 공식 채널에 참여하세요: [Official C
새로운 왕의 등장 - 인디케이터 + 주문 관리 표시(TP1 + TP2 + TP3) + 선택형 텔레그램 시그널 전송 기능 포함 (무료) (완전한 트레이딩 및 시그널 시스템) 골드를 위한 최고의 EA: Gold Slayer 이 인디케이터는 고급 전략, 사용자 지정 가능한 주문 관리 시스템, 그리고 엔벨로프 확장을 결합한 평균 회귀(mean reversion) 시스템을 포함하고 있습니다. 또한 RSI와 같은 여러 지능형 확인 필터를 통해 높은 확률의 반전 진입 구간을 포착하여 BUY 및 SELL 시그널을 제공합니다. 단순히 거래 방법만 배우는 것이 아니라, 여러 포지션을 효과적으로 관리하고 이전에 수익 중인 오픈 포지션으로 손실 거래를 커버하는 방법까지 익힐 수 있습니다. M5 전용으로 설계 및 최적화되었으며, 유동성이 풍부해 시그널이 더 깔끔하고 신뢰도 높은 BTCUSD와 XAUUSD에서 뛰어난 성능을 발휘합니다. 이 인디케이터는 ATR 기반으로 자동 계산된 진입가, 손절가, 익절가와
SMC Intraday Formula
VividMind Digital Solutions
5 (26)
먼저 솔직하게 말하겠습니다. 어떤 인디케이터도 단독으로 당신을 수익성 있게 만들어주지 않습니다. 누군가 그렇게 말한다면, 그는 당신에게 꿈을 파는 것입니다. 완벽한 매수/매도 화살표를 보여주는 모든 인디케이터는 완벽하게 보이도록 만들 수 있습니다 — 단지 올바른 과거 구간을 확대하고 승리한 거래만 캡처하면 됩니다. 우리는 그렇게 하지 않습니다.  SMC Intraday Formula는 도구입니다. 시장 구조를 읽고, 가장 높은 확률의 가격 구간을 표시하며, 현재 스마트 머니의 흐름이 어떻게 보이는지 아주 단순한 언어로 보여줍니다. 최종 결정은 여전히 당신이 합니다. 실행도 당신이 합니다. 하지만 이제는 희망이 아니라 정확성으로 거래하게 됩니다. 우리는 이 인디케이터를 지난 약 3년 동안 골드(XAUUSD) 및 주요 외환 통화쌍의 데이 트레이딩 스캘핑에 사용해 왔습니다. M1, M5, M15, M30에서 우리의 핵심 도구입니다. 이 도구는 미래를 예측하려 하지 않습니다 — 지금 형성
GoldenX Entry MT5
VividMind Digital Solutions
5 (16)
GoldenX Entry는 MT5용 인디케이터로, 적응형 Smart Entry Trend 알고리즘, 신호 스코어링 시스템, 시장 레짐 감지 기능, 그리고 변동성 필터를 포함합니다. 각 신호에는 계산된 진입 레벨, 3개의 익절(TP1, TP2, TP3) 레벨, 그리고 손절(Stop-Loss) 레벨이 포함됩니다. 이 인디케이터는 다양한 시장 환경에 적응하도록 설계된 다중 분석 레이어 구조 위에 구축되어 있으며, 내장 최적화기와 통계 추적 시스템을 결합합니다. 또한 Risk-to-Reward(RR) 지표와 과거 거래 행동 기반의 정량 분석을 제공합니다. 시작은 간단합니다 — 선택한 타임프레임에서 최적화기를 실행한 뒤 차트에서 바로 인디케이터를 사용하면 됩니다. 핵심 기능 GoldenX Entry는 하나의 차트에서 신호 엔진, 트레이드 관리 기능, 그리고 과거 통계 추적을 통합합니다: - 내장 최적화기: 최적화기는 차트에서 원클릭으로 실행됩니다. 200개의 파라미터 조합을 두 단계 탐색
Entry Points Pro for MT5
Yury Orlov
4.52 (151)
전설이 돌아왔습니다: Entry Points Pro 10. MQL5 마켓 Top-3 자리를 3년간 지켜온 전설적인 지표의 재출시입니다. 수백 개의 호평 리뷰(두 버전 합산 589개), 매일 이 지표로 거래하는 수천 명의 트레이더, 31,000회 이상의 데모 다운로드   MT4+MT5 . 지난 5년간 여러분이 남긴 리뷰를 하나도 빠짐없이 읽었고, 약속 대신 그 답을 버전 10에 담았습니다. 1999년부터 시장에서 활동하며 정직함과 자신의 평판, 그리고 고객을 소중히 여기는 개발자가 만들었습니다. Entry Points Pro의 진입 시그널은 절대 리페인팅되지 않습니다. 그리고 이번에는 개발자의 말뿐이 아니라 검증 가능한 사실입니다: 확정 시그널은 캔들 종가에서만 표시되며, 자동화 테스트에서 리페인팅 0건 이 확인되었습니다(EURUSD, XAUUSD, BTCUSD에서 2,486,568회의 불변조건 검사 — 위반 0건). 검증 방법은 공개되어 있으니 전략 테스터에서 직접 재현해 보실 수
Neuro Poseidon MT5
Daria Rezueva
4.75 (52)
Neuro Poseidon is a new indicator by Daria Rezueva. It combines precise trading signals with adaptive TP/SL levels - creating best possible trades as a result! Message me and get  Neuro Poseidon Assistant  as a gift to automize your trading process! What makes it stand out? 1. Proven profitability on all assets and timeframes 2. Only confirmed BUY and SELL signals present on the chart 3. Adaptive TP & SL levels generated by the software for each trade 4. Easy to understand - suitable for al
M5 Sniper
MeanFX
5 (3)
당신의 트레이딩 우위를 한눈에 확인하세요! M5 Sniper 는 MeanFX의 새로운 지표입니다. 정확한 트레이딩 신호 와 적응형 TP/SL 레벨 을 결합하여, 결과적으로 가능한 최고의 통계적 트레이딩을 만들어냅니다! 5회 구매마다 가격이 인상되며, 다음 가격은 69$입니다. 구매 후 저에게 메시지를 보내주시면 팁/가이드와 보너스 EA를 제공해 드립니다. 무엇이 이 지표를 특별하게 만들까요? Gold XAUUSD에서 검증된 통계적 성과 ( 거의 모든 자산에서 작동 하며, 일관된 결과 없이 모든 것을 다루려고 하기보다는 하나의 타임프레임을 완전히 익히는 데 집중합니다) 각 심볼당 하루 1~8회의 트레이드 와 높은 승률을 제공하며, 모든 통계적 우위를 우리의 편으로 가져갑니다. 차트에는 확인된 BUY 및 SELL 신호만 표시됩니다. 각 트레이드에 대해 지표가 생성하는 적응형 TP 및 SL 레벨 평균 승률 75%+ 평균 Signal Ratio 최소 1.1+ 알람 및 알림이 휴대폰 으로도
M1 Sniper MT5
Oleg Rodin
5 (7)
M1 SNIPER 는 사용하기 쉬운 거래 지표 시스템입니다. M1 시간대에 맞춰 설계된 화살표 지표입니다. 이 지표는 M1 시간대 스캘핑을 위한 단독 시스템으로 사용할 수 있으며, 기존 거래 시스템의 일부로도 사용할 수 있습니다. 이 거래 시스템은 M1 시간대 거래용으로 특별히 설계되었지만, 다른 시간대에도 사용할 수 있습니다. 원래는 XAUUSD와 BTCUSD 거래를 위해 이 방법을 설계했지만, 다른 시장 거래에도 유용하다는 것을 알게 되었습니다. 이 지표의 신호는 추세 방향과 반대로 거래될 수 있습니다. 저는 지표의 신호를 활용하여 양방향으로 거래할 수 있도록 돕는 특별한 거래 기법을 알려드립니다. 이 방법은 특별한 동적 지지선과 저항선 가격 영역을 활용하는 것을 기반으로 합니다. 구매하시면 M1 SNIPER 화살표 지표를 바로 다운로드하실 수 있습니다. 또한, 아래 스크린샷에 표시된 Apollo Dynamic SR 지표는 M1 SNIPER 도구를 사용하는 모든 사용자에게 무료로
Adaptive Price Action Engine 지표를 구매하면 EA(자동매매 프로그램)가 무료 멀티 타임프레임 기반 자기 최적화 추세 & 캔들 패턴 분석 시스템 시장은 끊임없이 변화하며, 모든 Price Action 패턴이 모든 시장 환경에서 동일한 가치를 가지는 것은 아닙니다. Adaptive Price Action Engine 은 변화하는 시장 환경에 적응할 수 있도록 설계되었으며, 추세 구조, 멀티 타임프레임 분석, 캔들 패턴 및 통계적 최적화 를 하나의 분석 프레임워크로 결합합니다. 두 가지 적응형 모드 Dual Alpha Trend Mode 낮은 타임프레임과 높은 타임프레임에서 적합한 Alpha Trend 파라미터를 자동으로 탐색하여, 최근 시장 움직임에 맞춰 추세 분석을 조정합니다. Candlestick + Alpha Mode Alpha Trend를 통한 시장 국면 분석과 22개의 상승 및 하락 캔들 패턴 을 결합합니다. 모든 패턴을 동일하게 취급하는 대신, 다양
ARIPoint
Temirlan Kdyrkhan
1 (4)
ARIPoint is a powerful trading companion designed to generate high-probability entry signals with dynamic TP/SL/DP levels based on volatility. Built-in performance tracking shows win/loss stats, PP1/PP2 hits, and success rates all updated live. Key Features: Buy/Sell signals with adaptive volatility bands Real-time TP/SL/DP levels based on ATR Built-in MA Filter with optional ATR/StdDev volatility Performance stats panel (Success, Profit/Loss, PP1/PP2) Alerts via popup, sound, push, or email Cu
Gann Made Easy MT5
Oleg Rodin
5 (12)
Gann Made Easy 는 mr.의 이론을 사용하여 최고의 거래 원칙을 기반으로 하는 전문적이고 사용하기 쉬운 Forex 거래 시스템입니다. W.D. 간. 이 표시기는 Stop Loss 및 Take Profit Levels를 포함하여 정확한 BUY 및 SELL 신호를 제공합니다. PUSH 알림을 사용하여 이동 중에도 거래할 수 있습니다. 구매 후 거래 방법 안내 및 유용한 추가 지표를 무료로 받으시려면 저에게 연락주세요! 아마도 Gann 거래 방법에 대해 이미 여러 번 들었을 것입니다. 일반적으로 Gann의 이론은 초보자 거래자뿐만 아니라 이미 거래 경험이 있는 사람들에게도 매우 복잡한 것입니다. Gann의 거래 방식은 이론적으로 적용하기 쉽지 않기 때문입니다. 나는 그 지식을 연마하고 Forex 지표에 최고의 원칙을 적용하기 위해 몇 년을 보냈습니다. 표시기는 적용하기가 매우 쉽습니다. 차트에 첨부하고 간단한 거래 권장 사항을 따르기만 하면 됩니다. 지표는 지속적으로 시장 분석
Gold Entry Sniper
Tahir Mehmood
5 (21)
Gold Entry Sniper – 골드 스캘핑 & 스윙 트레이딩을 위한 전문 다중 시간 프레임 ATR 대시보드 Gold Entry Sniper 는 XAUUSD 및 기타 종목에 대해 정확한 매수/매도 신호 를 제공하는 고급 MetaTrader 5 지표입니다. ATR 트레일링 스톱 로직 과 다중 시간 프레임 분석 을 기반으로 설계되어 스캘핑과 스윙 트레이딩 모두에 적합합니다. 주요 기능 및 장점 다중 시간 프레임 분석 – M1, M5, M15 추세를 한눈에 확인. ATR 기반 트레일링 스톱 – 변동성에 따라 자동 조정. 전문 차트 대시보드 – 신호 상태, ATR 레벨, 회귀선, 매매 방향 표시. 명확한 매수/매도 마커 – 자동 화살표와 텍스트 라벨. 종료 알림 & 거래 관리 – 수익 보호를 위한 자동 종료 감지. 완전 사용자 설정 가능 – 대시보드 위치, 색상, ATR/회귀선 파라미터 조정. 골드(XAUUSD) 최적화 – M1~M15 스캘핑에 완벽, 외환/지수/암호화폐에도 적용 가능.
Scalper Vault MT5
Oleg Rodin
5 (1)
Scalper Vault는 당일 매매(intraday trading)에서 일관된 성과를 내고자 하는 트레이더를 위해 설계된, 강력하고 모든 기능을 갖춘 트레이딩 시스템입니다. 이 고정밀 지표는 외환(Forex) 및 바이너리 옵션 트레이더 모두에게 기관급 분석을 제공하는 독립적인 종합 트레이딩 시스템 역할을 합니다. 구매 후 저에게 연락해 주시면, 트레이딩 팁과 함께 특별한 보너스를 제공해 드립니다! Scalper Vault는 추측에 의존하거나 복잡한 수동 분석을 할 필요를 없애주며, 사용하기 쉬운 트레이딩 기법을 통해 오직 매매 실행에만 집중할 수 있도록 돕습니다. 정확한 추세 추종 신호: 핵심 알고리즘이 시장 구조를 분석하여, 지배적인 시장 추세 방향과 일치하는 고확률 신호만을 제공함으로써 잘못된 진입을 획기적으로 줄여줍니다. 정밀한 고점 및 저점 탐지: 시장의 움직임이 소진되는 지점을 스캔하여 잠재적인 반전 구간을 식별합니다. 간(Gann) 이론 기반의 매수/매도 구간: 수학적
Gold Trend Coach MT5
Cristhian Alexander Gaibor Cuasquer
5 (1)
Gold Trend Coach는 MetaTrader 5용 골드(XAUUSD) 추세 지표로, 매수 및 매도 신호, 손절과 세 개의 익절 목표를 봉 마감 시 확정하며, 멀티 타임프레임 코치 대시보드와 휴대폰 및 Telegram 알림을 제공합니다. 런던과 뉴욕 세션의 M5 스캘핑과 M15 데이트레이딩을 위해 만들어졌습니다. Gold Trend Coach: 진입, 손절, 세 개의 목표가 있는 XAUUSD 골드 추세 신호. 출시 가격 $39, 처음 20개 한정, 이후 $59. 구매 후 메시지를 주시면 구매자 키트를 바로 보내 드립니다. 최악의 연속 손실을 차트 위에 그대로 보여 주는 골드 지표. 이 마켓의 모든 XAUUSD 지표는 자신의 승리 신호를 보여 줍니다. Gold Trend Coach는 손실 신호도 보여 줍니다. 빨간색으로 세고, 최악의 연속 손실과 순결과를 보기 좋은 것만이 아니라 모든 것을 세는 패널에 표시합니다. 신호가 손절에 닿으면 보입니다. 세 번 연속 손절에 닿아도 보입
Auto Optimized SpeedAngle 은 지속적인 워크포워드 최적화(Walk-Forward Optimization, WFO)를 통해 곡선 적합(curve-fitting)을 제거한 기관 수준의 모멘텀 벡터화 시스템입니다. 시장 체제가 바뀔 때 성능이 떨어지는 정적 입력에 의존하는 대신, 이 지표는 표본 외(Out-of-Sample, OOS) 검증을 사용하여 매개변수를 동적으로 재보정하며, 표시되는 신호가 과거의 우연이 아닌 진정한 통계적 우위를 나타내도록 보장합니다. 핵심 기관용 프레임워크 워크포워드 최적화 엔진: 핵심 알고리즘은 수천 가지의 룩백(lookback) 및 임계값 조합을 지속적으로 스캔하며, 데이터를 인샘플(in-sample)과 표본 외(out-of-sample) 세트로 엄격하게 분리합니다. 미지의 데이터 환경에서 수학적 우수성이 증명된 경우에만 새로운 매개변수 구성을 채택합니다. 정량적 목적 함수: 순수한 총이익을 쫓는 대신, 최적화 엔진은 기관 수준의 안정성
Tokyo mt5 Indicator
Vasiliy Strukov
5 (10)
Tokyo Indicator는 추세 방향, 잠재적 거래 신호 및 시장 상황을 명확하고 시각적으로 보여줍니다. 색상으로 구분된 계단식 추세선은 강세 구간(파란색)과 약세 구간(자홍색)을 명확히 구별해 줍니다. 추세가 전환될 때 나타나는 방향성 화살표는 잠재적인 매수 및 매도 기회를 강조하여 보여줍니다. 통합 대시보드는 현재 신호, 시장 성향(bias), 모멘텀, 변동성, 신호 품질 등의 정보를 한눈에 파악할 수 있도록 구성되어 있습니다. 이를 통해 트레이더는 별도의 패널을 오갈 필요 없이 가격 움직임(price action)과 지표의 데이터를 동시에 분석할 수 있습니다. 깔끔한 차트 화면과 간결한 시장 개요를 제공하는 Tokyo Indicator는 체계적인 추세 분석과 거래 결정을 지원합니다. 모든 시간대와 다양한 자산(특히 금)에서 활용할 수 있습니다. 추세 방향, 잠재적 거래 신호 및 시장 상황을 명확하고 시각적으로 보여줍니다. 색상으로 구분된 계단식 추세선은 강세 구간(파란색)
Entry In The Zone and SMC Multi Timeframe is a real-time market analysis tool based on Smart Money Concepts (SMC), designed to analyze market structure, price direction, and key trading zones. It supports both Single-Timeframe and Multi-Timeframe Analysis, providing a clearer view of overall market structure across multiple timeframes, with real-time BUY / SELL signals designed with a strict focus on No-Repaint principles. The signals are designed to help filter unclear setups and evaluate tradi
Trend Catcher ind mt5
Ramil Minniakhmetov
5 (18)
트렌드 캐처 인디케이터 트렌드 캐처 인디케이터는 개발자가 자체 개발한 맞춤형 적응형 트렌드 분석 지표들을 조합하여 시장 가격 움직임을 분석합니다. 단기적인 노이즈를 제거하고 근본적인 모멘텀 강도, 변동성 확대, 가격 구조 움직임에 집중하여 진정한 시장 방향을 파악합니다. 또한 이동 평균, RSI, 변동성 필터와 같은 맞춤형 지표들을 활용하여 가격을 평활화하고 트렌드를 필터링합니다. 실제 운영 모니터링 및 기타 제품은 다음 링크에서 확인하실 수 있습니다:   https://www.mql5.com/en/users/mechanic/seller 텔레그램에서는 EA나 설정 파일을 판매하지 않습니다. 사기이니 주의하세요. 모든 설정 파일은 블로그에서 무료로 제공됩니다. 중요! 구매 후 즉시 연락 주시면 사용 방법 및 보너스를 드립니다!
안녕하세요, 트레이더 여러분! 많은 개인 투자자들이 느린 웹 스크립트에 의존하고 있습니다. 수익성 있는 거래를 위해서는 체계적인 프레임워크가 필수적입니다. Astro AI 지표는 단순한 차트 오버레이가 아닙니다. 터미널에서 직접 실행되는 두 개의 에이전트로 구성된 정교한 신경망입니다. 시스템 기술 상세 설명: 1. 에이전트 1: 분석가 (그래픽 신경망 – GNN) 시장은 개별 가격 막대로 이루어진 것이 아니라 상호 연결된 데이터 네트워크입니다. 기능: 에이전트 1은 그래픽 신경망을 사용하여 이러한 복잡하고 비선형적인 관계를 파악합니다. 장점: 기존 지표는 과거 이동 평균만을 고려하는 반면, 저희 GNN은 시장의 심층적인 구조적 관계를 실시간으로 처리하여 개별 트레이더의 거래량이 시장에 큰 영향을 미치기 전에 숨겨진 상관관계를 찾아냅니다. 2. 에이전트 2: 실행기 (근접 전략 최적화 – PPO) 패턴 인식은 절반의 성공일 뿐입니다. 현재 시장 변동에 기반하여 올바른
Divergence Bomber
Ihor Otkydach
4.89 (94)
이 지표를 구매하신 분께는 다음과 같은 혜택이 무료로 제공됩니다: 각 거래를 자동으로 관리하고, 손절/익절 수준을 설정하며, 전략 규칙에 따라 거래를 종료하는 전용 도우미 툴 "Bomber Utility" 다양한 자산에 맞게 지표를 설정할 수 있는 셋업 파일(Set Files) "최소 위험", "균형 잡힌 위험", "관망 전략" 모드로 설정 가능한 Bomber Utility의 셋업 파일 이 전략을 빠르게 설치, 설정, 시작할 수 있도록 돕는 단계별 영상 매뉴얼 주의: 위의 모든 보너스를 받기 위해서는 MQL5 개인 메시지 시스템을 통해 판매자에게 연락해 주세요. 독창적인 커스텀 지표인 “Divergence Bomber(다이버전스 봄버)”를 소개합니다. 이 지표는 MACD 다이버전스(괴리) 전략을 기반으로 한 올인원(All-in-One) 거래 시스템입니다. 이 기술 지표의 주요 목적은 가격과 MACD 지표 간의 다이버전스를 감지하고, **향후 가격이 어느 방향으로 움직일지를 알려주
PainX GainX Blue Spike Fusion AI Advanced Synthetic Index Spike Detection Indicator for MetaTrader 5 Discover potential spike setups with a clear, organized, and professional trading interface. PainX GainX Blue Spike Fusion AI is a specialized indicator designed for traders who monitor synthetic indices and want a structured way to observe potential price spike opportunities. The indicator combines signal monitoring, market-condition analysis, visual alerts, and event tracking in one convenient
Unix Scalper
Issam Kassas
4 (4)
Unix Scalper — MetaTrader 5 구매 후 MQL5에서 저에게 메시지를 보내시면 Smart Universal Expert Advisor를 무료로 받으실 수 있으며, 온라인 강좌, PDF 매뉴얼 및 비공개 그룹 이용 권한도 함께 제공됩니다. 매매 기회를 찾고, 거래 계획을 확인하고, 실행 방법을 선택하세요. UNIX Scalper는 시장 분석, BUY/SELL/WAIT 판단, Entry, Stop Loss, TP1 및 TP2 가격 수준을 하나의 정돈된 패널에 제공합니다. 신호와 거래 계획을 한눈에 • 명확한 판단: BUY, SELL 또는 WAIT. • 구체적인 가격 수준: Entry, Stop Loss, TP1 및 TP2. • 다중 시간대 개요: 패널의 여러 시간대 신호를 비교하세요. • 판단을 돕는 분석: 추세, 모멘텀, 거래량, 변동성, 지지와 저항, 시장 품질. • 다양한 레이아웃: Minimized, Compact, Standard 또는 Full. 신호와
Volatility Master for MetaTrader is a real-time dashboard tool that scans up to  50 symbols  to identify high-volatility , trending markets instantly. With bullish/bearish signals, customizable alerts, and a user-friendly interface, it helps you avoid range-bound conditions and focus on high-probability trades. Clarity leads to confidence. Trade confidently and protect your capital effectively with this powerful dashboard. We don't offer free or bonus indicators in exchange of reviews from you.
Atomic Analyst MT5
Issam Kassas
4.48 (62)
Atomic Analyst — MetaTrader 5 구매 후 MQL5에서 저에게 메시지를 보내시면 Smart Universal Expert Advisor를 무료로 받으실 수 있으며, 온라인 강좌, PDF 매뉴얼 및 비공개 그룹 이용 권한도 함께 제공됩니다. Atomic Analyst는 가격 움직임 분석, 추세 방향, 진입·청산 신호, 손절 수준, 여러 익절 수준을 차트에 모아 보여줍니다. 신호를 확인하고 매매 상황을 이해하세요 Atomic Analyst는 분석 결과를 명확한 시각 정보로 정리합니다. • 잠재적인 진입 기회를 확인할 수 있는 매수·매도 화살표. • 거래 계획에 도움이 되는 손절 수준과 여러 익절 수준. • 시장 방향을 평가할 수 있는 추세, 강도, 모멘텀 수치. • 더 넓은 시장 맥락을 비교할 수 있는 여러 시간대 분석. • 변화하는 시장 상황을 따라갈 수 있는 색상별 캔들과 알림. 신호와 보조 분석을 함께 검토한 다음, 해당 매매 상황이 자신의 거래 규칙에
Market Structure Order Block Dashboard MT5는 시장 구조와 주요 가격 반응 구역을 차트에서 직접 읽고자 하는 트레이더를 위해 설계된 MT5 지표입니다. BOS, ChoCH, 오더 블록, Fair Value Gap (FVG), 유동성, Kill Zones, Volume Profile 그리고 빠른 분석을 위한 콤팩트한 대시보드를 결합합니다. 이 지표는 시장 구조, ICT 및 Smart Money 개념을 의사결정 프레임워크로 사용하는 트레이더를 대상으로 합니다. 추세 지속, 가능한 반전, 가격 불균형, 유동성 타겟 및 관심 구역을 보다 체계적으로 식별하는 데 도움을 줄 수 있습니다. 구매자를 위한 포함 리소스 구매 후 MQL5 개인 메시지로 요청하시면 완전한 PDF 사용 설명서와 파라미터 설정 팁을 제공해 드립니다. MQL5 개인 메시지를 통한 직접 기술 지원. 1.20 버전은 두 가지 주요 추가 기능을 제공합니다: Pending BOS / Pending
Break and Retest Hunter
Mohamed Hassan
5 (2)
Break and Retest Hunter is a powerful MetaTrader 5 indicator designed to automatically identify support and resistance levels, breakout structures, and potential retest opportunities in real time. Bonus Indicator: After purchasing Break and Retest Hunter , contact me to receive Trade Indicator Assistant EA completely free as a bonus utility. $65 for the next 10 copies . Next price is $120.  Combining adaptive market analysis, clear BUY/SELL signals, Fibonacci-based profit targets, and a premiu
FiboSniper Pro
Van Minh Nguyen
5 (3)
FiboSniper Pro – Multi-Filter Fibonacci System with Auto SL/TP and Control Panel FiboSniper Pro는 동적 Fibonacci Envelopes와 여러 확인 필터를 결합하여 선별된 Buy 및 Sell 신호를 생성하는 기술적 지표입니다. Fibonacci 레벨은 Moving Average와 ATR을 기반으로 계산된 후 ADX, EMA, RSI, ATR, Volume, Time 및 Candle 구조를 통해 필터링됩니다. 이 지표는 ATR 기반의 자동 Stop Loss 및 Take Profit 레벨을 차트에 직접 표시하며, 빠른 설정 조정을 위한 인터랙티브 Control Panel을 제공합니다. 구매 후 권장 설정 파일과 자세한 사용 방법을 받으려면 저에게 문의해 주세요. Auto Trader X를 사용하여 FiboSniper Pro 신호를 자동화할 수 있습니다: [Auto Trader X] User Guide 및 Se
제작자의 제품 더 보기
Objects synchronization
Andrej Hermann
4.63 (8)
The indicator synchronizes eight types of markings on several charts of one trading instrument. This indicator is convenient to use in conjunction with "Multichart Dashboard" or other similar assistant that allows you to work with several charts at the same time. "Multichart Dashboard" can be found under the link on my youtube channel. Settings: enable vertical line synchronization enable horizontal line synchronization enable Trend Line synchronization enabling Fibonacci Retracement synchron
FREE
Mirror Chart MT5
Andrej Hermann
5 (1)
The Mirror Chart MT5 is a overlay indicator specifically designed to project a second financial instrument directly onto the main chart window. This tool is invaluable for traders who rely on correlation analysis, as it visualizes the price movements of two different instruments in real time. Unlike traditional overlays, this indicator utilizes intelligent, dynamic centering and scaling logic. It continuously analyzes the visible price range in the current window for both symbols and calculates
FREE
Trade Simulator        With this toolbar you have both: a compact surface, which simultaneously shows you the most important information you need for trading.    You can use it with your real account or also in the strategytester mode. This toolbar allows you to trade in the strategytester as real as possible with every  option available from the MT4 platform.   Settings available: Magic Number - When the 'MagicNumber' number is 0, the toolbar will watch all orders without a 'MagicNumber'. If th
FREE
ADRActive
Andrej Hermann
어댑티브 ADR  어댑티브 ADR 은 일일 평균 범위(ADR)를 계산하고 표시하는 전문 트레이딩 지표로, 하루 동안의 변동성을 체계적으로 파악하려는 트레이더에게 적합합니다. 다양한 설정 옵션을 통해 여러 시장 상황에 유연하게 대응할 수 있습니다. 계산 및 방법 네 가지 평활화 방식: SMA, EMA, SMMA(Wilder), LWMA 거래 스타일과 변동성 모델에 맞게 선택 가능 추세장과 박스권 모두에서 활용 가능 동적 일일 로직 거래 세션 시작과 동시에 자동 실행 시초가를 기준으로 두 개의 대칭 레벨 설정 ADR 값에 도달할 때까지 레벨이 점진적으로 좁아짐 도달 후 하루 종료까지 고정되어 명확한 일일 변동 범위를 제공 과도한 변동성이나 비정상적 가격 움직임을 식별하는 데 도움 시각적 안내 시초가 라인 표시 옵션 색상, 라인 스타일, 투명도, 표시 여부를 자유롭게 설정 어떤 차트 테마에도 자연스럽게 어울리는 구성 장점 명확한 인트라데이 구조 제공 일일 변동성의 정밀한 평가 브레이크아웃
이 지표는 과거 가격 범위를 일일 박스 형태로 표시하여 각 거래일 내부의 가격 구조를 세밀하게 분석할 수 있게 합니다. 각 날짜마다 개별 색상을 지정할 수 있습니다. 박스 내부에는 시가와 종가 사이의 범위를 방향별 색상으로 표시하여 누적 구간과 조정 구간을 빠르게 파악하는 데 도움이 됩니다. Version for MT5 : https://www.mql5.com/ru/market/product/161828?source=Unknown The indicator displays historical price ranges as daily boxes, enabling detailed analysis of intraday structure and market behavior. Each trading day can be assigned an individual color. Inside every box, the range between the opening and closing prices is
FREE
Shadow Chart
Andrej Hermann
The Shadow Chart  indicator is the advanced evolution of the Mirror Chart MT5. Rather than overlaying the second instrument directly onto the main chart with dynamic scaling, it renders it in a dedicated sub-window with its own independent price axis. The second symbol behaves exactly like a separately opened chart window — the scale is absolute and undistorted. The sub-window automatically adapts its display mode to match the main chart — candles, bars, or line — and inherits all color settings
FREE
Objects synchronization for mt4
Andrej Hermann
4.25 (12)
The indicator synchronizes eight types of markings on several charts of one trading instrument. This indicator is convenient to use in conjunction with "Multichart Dashboard" or other similar assistant that allows you to work with several charts at the same time. "Multichart Dashboard" can be found under the link on my youtube channel. Settings: enable vertical line synchronization enable horizontal line synchronization enable Trend Line synchronization enabling Fibonacci Retracement synchron
FREE
Multichart Dashboard — Your Central Command Center for Trading The **Multichart Dashboard** Expert Advisor transforms your MetaTrader interface into a clean, professional trading hub. Manage up to **6 charts simultaneously** , switch between symbols in an instant and always stay in control — all within one compact, fully configurable panel. What does Multichart Dashboard do? **Up to 6 charts in parallel** — Set the desired number of charts (1–6) with a single input. All associated charts are
FREE
Clonify PRO - Local Trade Copier for MT5 and MT4 Professional tool for copying trades between MT5 and MT4 accounts (via the shared "Common" folder). FEATURES: 1. SENDER: Exports trades in real-time Sends everything (no filters) Requires no additional settings 2. RECEIVER: Copies trades. Magic Number: Uses the sender's account ID (default) or a custom number. Lot Modes: Analogous: Exactly the same volume as the sender. The Lot Multiplier allows you to decrease or increase the transmitted lot. Pr
FREE
WOz
Andrej Hermann
5 (3)
Universal trading advisor "WOz" with a built-in trading panel The EA's capabilities can be easily tested in the strategy tester in visual mode. The EA can simulate real trading with the ability to move the SL and TP levels.  The EA has 5 modes of operation:  1. AUTOTRADING automatic trading mode on a set signal  2. ONLY SIGNAL mode of tracking the set signal without auto trading  3. RANGE MODUS mode of automatic placement of equidistant orders on Bayi Sell at a specified time  4. HAND MODUS
FREE
Clonify PRO MT5
Andrej Hermann
5 (1)
Clonify PRO - Local Trade Copier for MT5 and MT4            (  Local trade copier for MT4   https://www.mql5.com/ru/market/product/15992   ) Professional tool for copying trades between MT5 and MT4 accounts (via the shared "Common" folder). FEATURES: 1. SENDER: Exports trades in real-time Sends everything (no filters) Requires no additional settings 2. RECEIVER: Copies trades. Magic Number: Uses the sender's account ID (default) or a custom number. Lot Modes: Analogous: Exactly the same volume
ADR Active
Andrej Hermann
어댑티브 ADR  어댑티브 ADR 은 일일 평균 범위(ADR)를 계산하고 표시하는 전문 트레이딩 지표로, 하루 동안의 변동성을 체계적으로 파악하려는 트레이더에게 적합합니다. 다양한 설정 옵션을 통해 여러 시장 상황에 유연하게 대응할 수 있습니다. 계산 및 방법 네 가지 평활화 방식: SMA, EMA, SMMA(Wilder), LWMA 거래 스타일과 변동성 모델에 맞게 선택 가능 추세장과 박스권 모두에서 활용 가능 동적 일일 로직 거래 세션 시작과 동시에 자동 실행 시초가를 기준으로 두 개의 대칭 레벨 설정 ADR 값에 도달할 때까지 레벨이 점진적으로 좁아짐 도달 후 하루 종료까지 고정되어 명확한 일일 변동 범위를 제공 과도한 변동성이나 비정상적 가격 움직임을 식별하는 데 도움 시각적 안내 시초가 라인 표시 옵션 색상, 라인 스타일, 투명도, 표시 여부를 자유롭게 설정 어떤 차트 테마에도 자연스럽게 어울리는 구성 장점 명확한 인트라데이 구조 제공 일일 변동성의 정밀한 평가 브레이크아웃
이 지표는 과거 가격 범위를 일일 박스 형태로 표시하여 각 거래일 내부의 가격 구조를 세밀하게 분석할 수 있게 합니다. 각 날짜마다 개별 색상을 지정할 수 있습니다. 박스 내부에는 시가와 종가 사이의 범위를 방향별 색상으로 표시하여 누적 구간과 조정 구간을 빠르게 파악하는 데 도움이 됩니다. The indicator displays historical price ranges as daily boxes, enabling detailed analysis of intraday structure and market behavior. Each trading day can be assigned an individual color. Inside every box, the range between the opening and closing prices is drawn with separate directional colors, helping traders identify accumulation
필터:
리뷰 없음
리뷰 답변