ADRActive
- 지표
- 버전: 4.82
- 활성화: 20

어댑티브 ADR
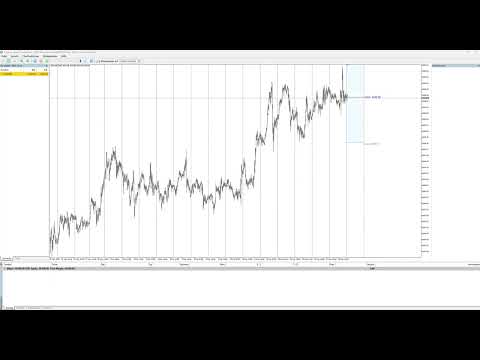
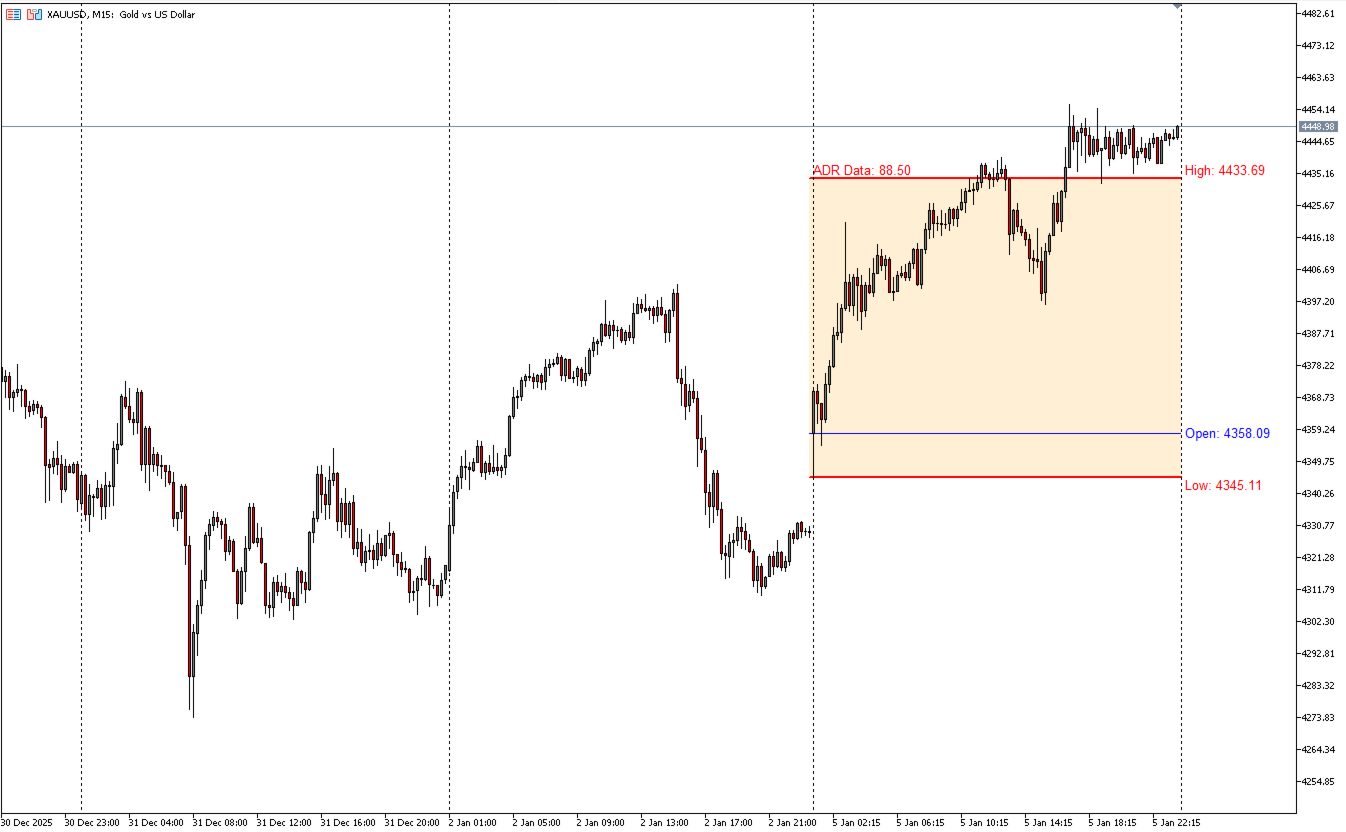
어댑티브 ADR 은 일일 평균 범위(ADR)를 계산하고 표시하는 전문 트레이딩 지표로, 하루 동안의 변동성을 체계적으로 파악하려는 트레이더에게 적합합니다. 다양한 설정 옵션을 통해 여러 시장 상황에 유연하게 대응할 수 있습니다.
계산 및 방법
-
네 가지 평활화 방식: SMA, EMA, SMMA(Wilder), LWMA
-
거래 스타일과 변동성 모델에 맞게 선택 가능
-
추세장과 박스권 모두에서 활용 가능
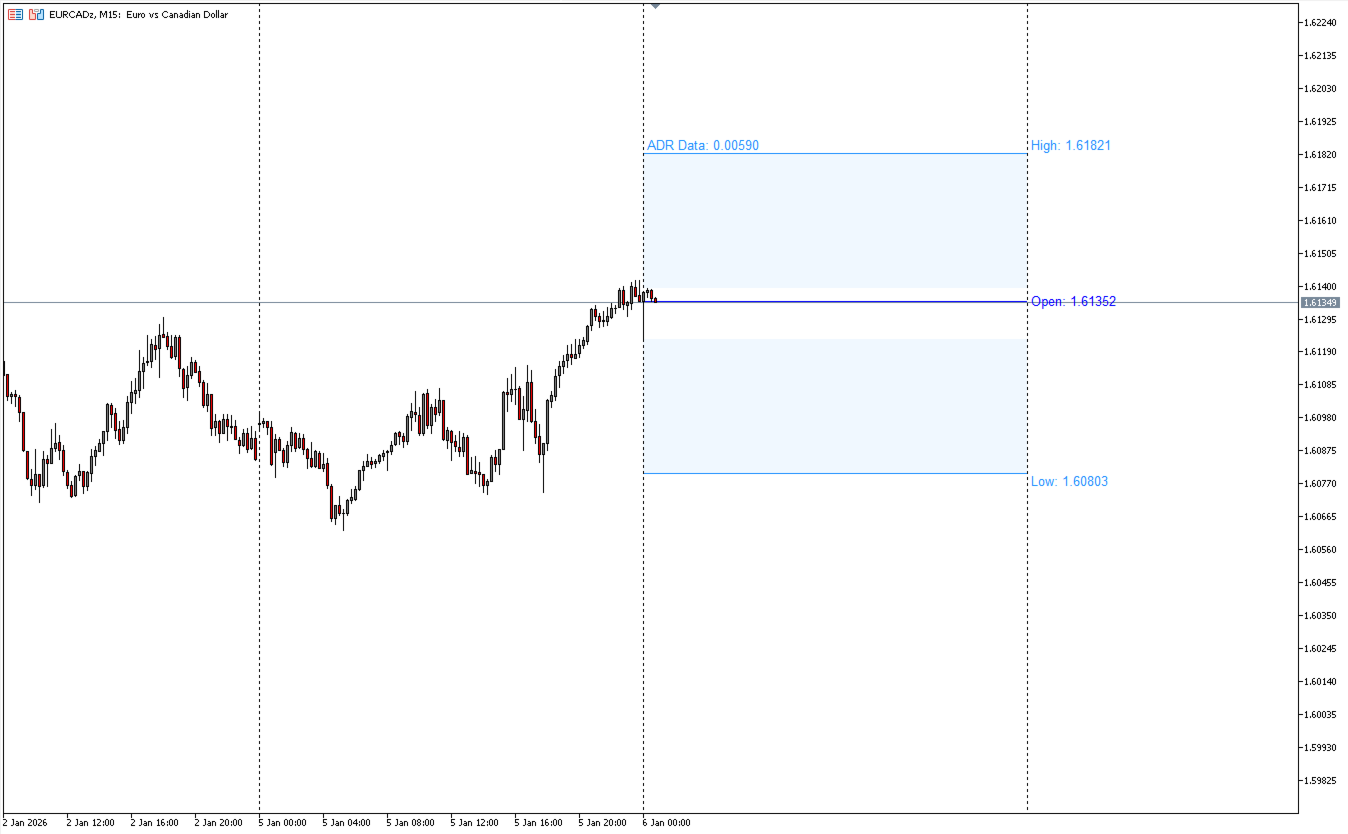
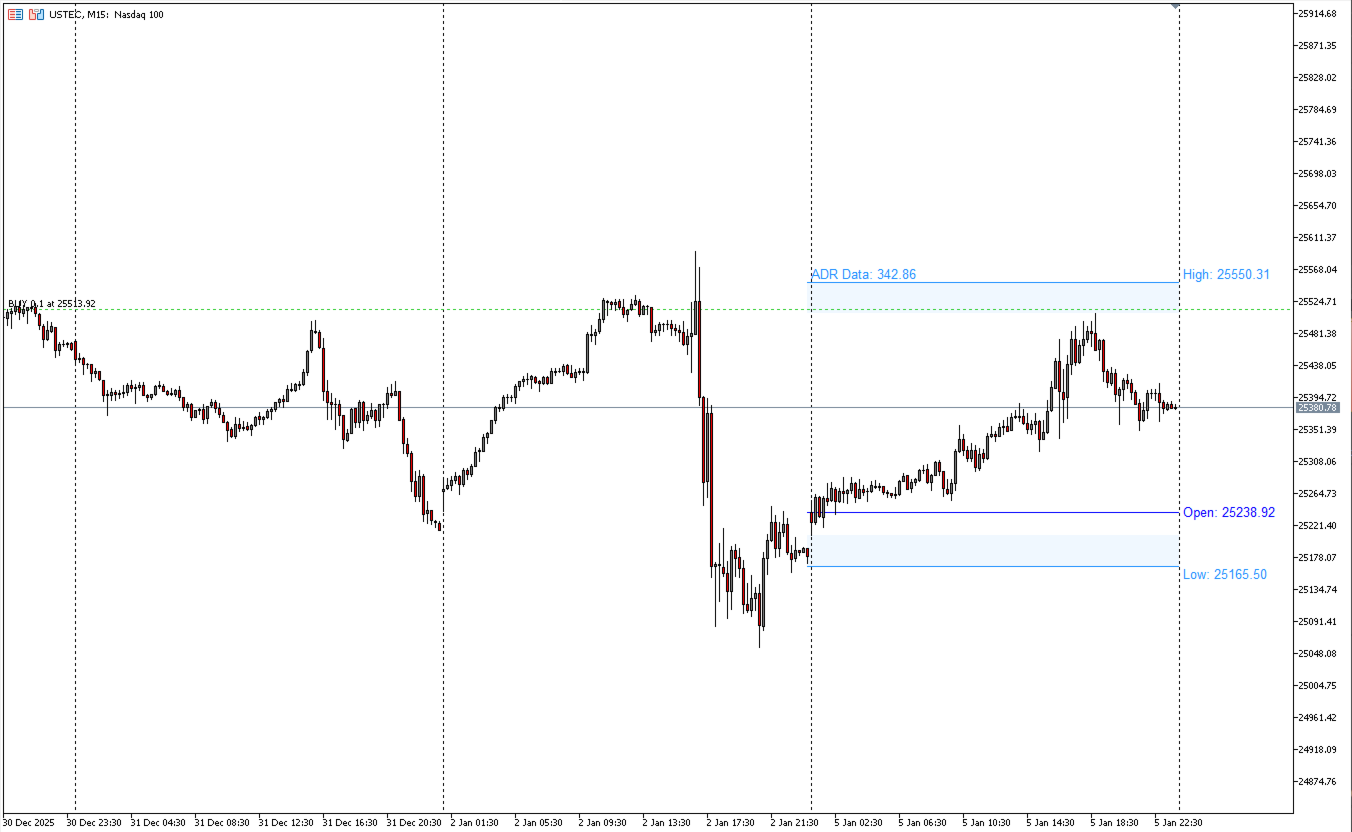
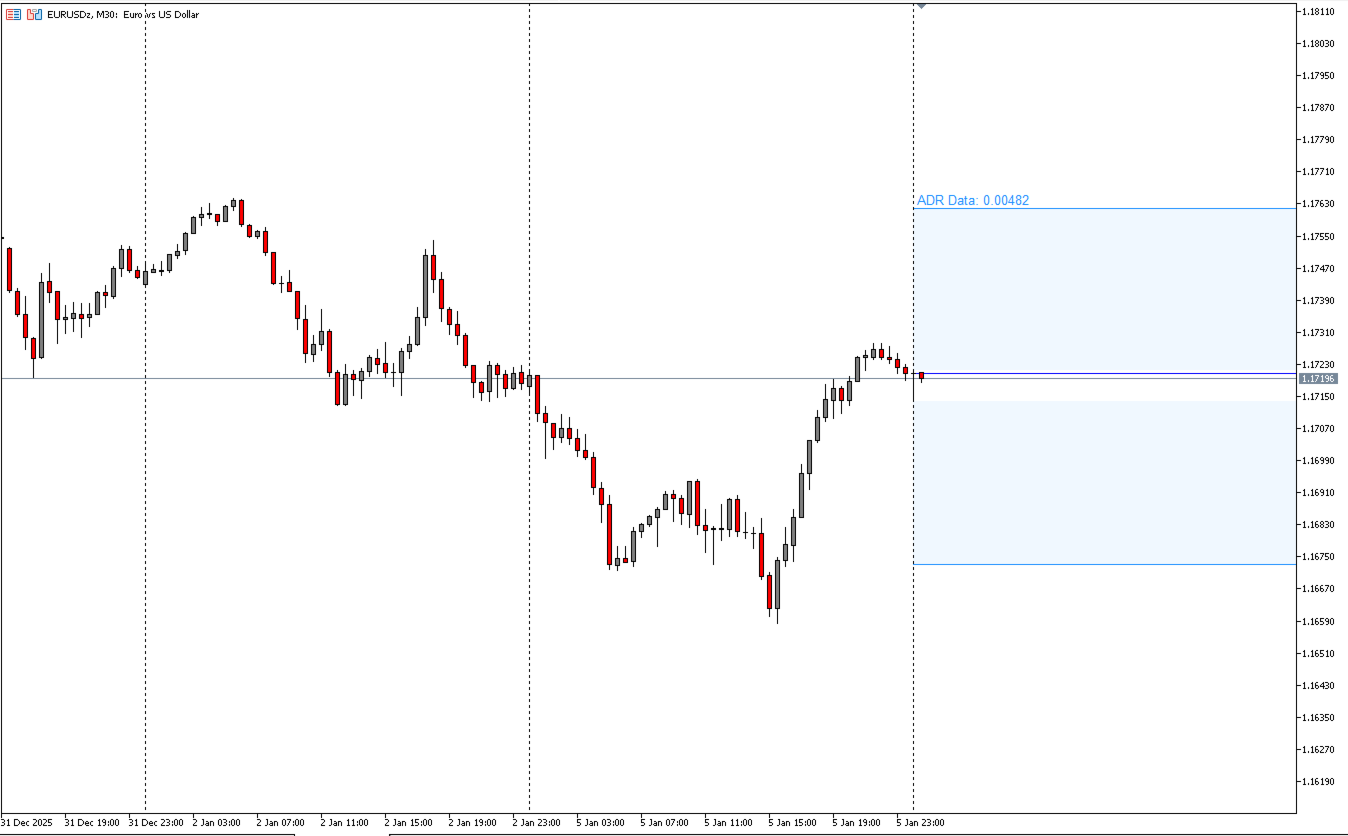
동적 일일 로직
-
거래 세션 시작과 동시에 자동 실행
-
시초가를 기준으로 두 개의 대칭 레벨 설정
-
ADR 값에 도달할 때까지 레벨이 점진적으로 좁아짐
-
도달 후 하루 종료까지 고정되어 명확한 일일 변동 범위를 제공
-
과도한 변동성이나 비정상적 가격 움직임을 식별하는 데 도움
시각적 안내
-
시초가 라인 표시 옵션
-
색상, 라인 스타일, 투명도, 표시 여부를 자유롭게 설정
-
어떤 차트 테마에도 자연스럽게 어울리는 구성
장점
-
명확한 인트라데이 구조 제공
-
일일 변동성의 정밀한 평가
-
브레이크아웃, 평균회귀, 변동성 전략에 적합
-
불필요한 진입을 줄이고 고확률 구간을 파악하는 데 유용