PZ Swing Trading MT5
- 지표
- 버전: 7.0
- 업데이트됨: 18 7월 2024
- 활성화: 20

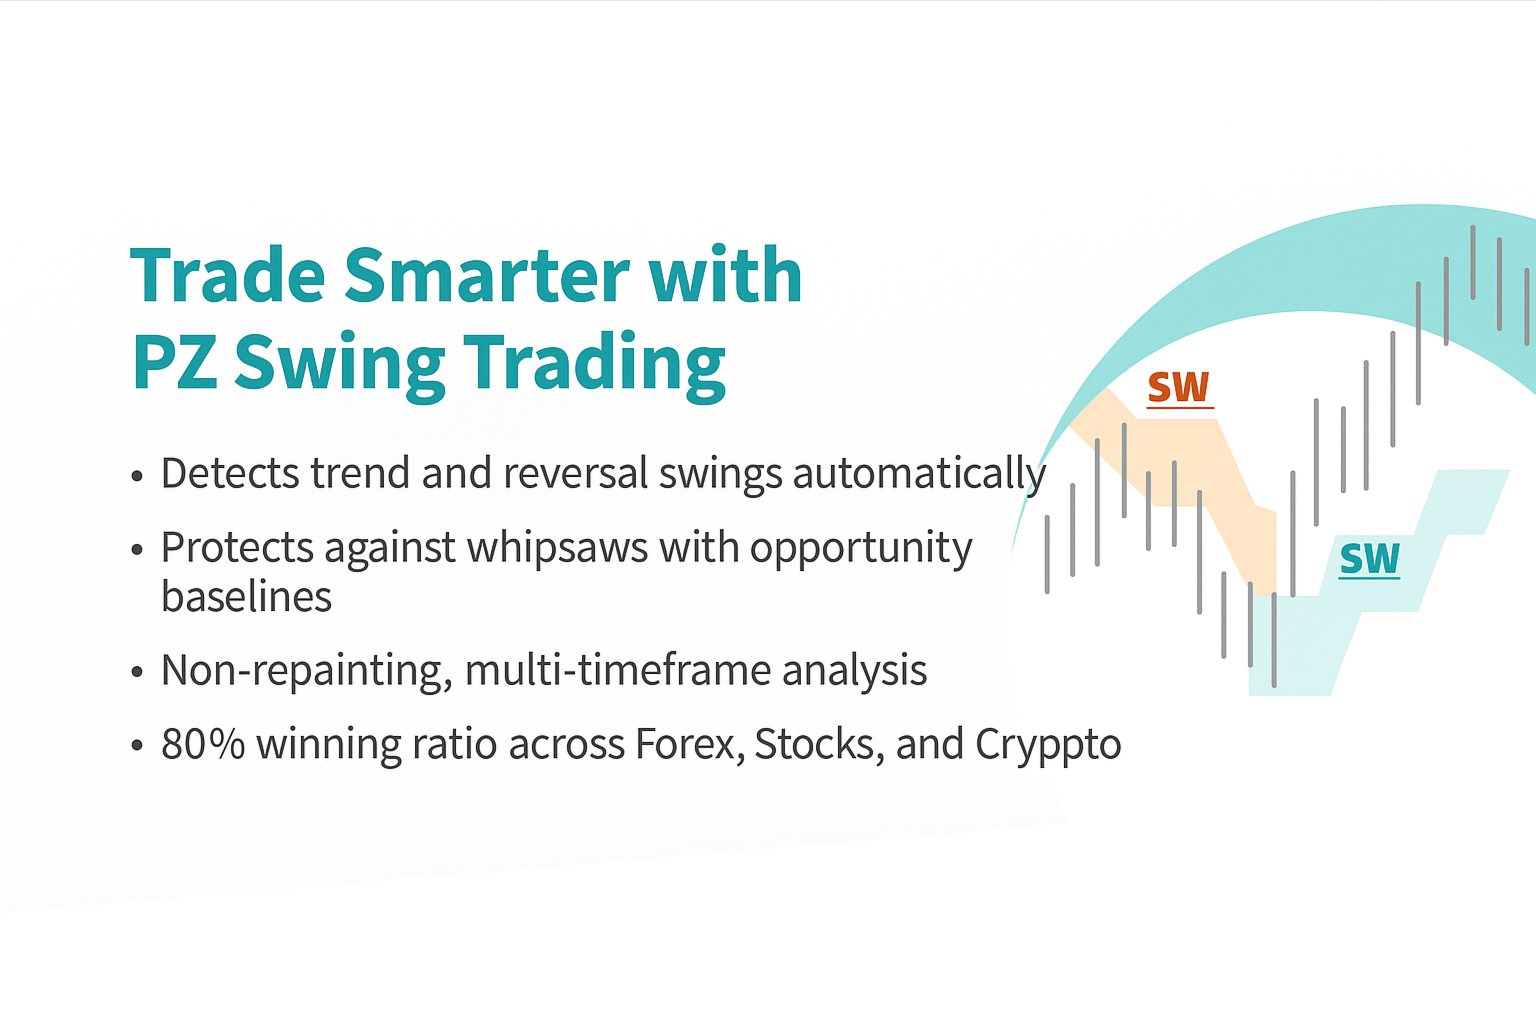
Protect against whipsaws: revolutionize your swing trading approach
Swing Trading is the first indicator designed to detect swings in the direction of the trend and possible reversal swings. It uses the baseline swing trading approach, widely described in trading literature. The indicator studies several price and time vectors to track the aggregate trend direction and detects situations in which the market is oversold or overbought and ready to correct.
[ Installation Guide | Update Guide | Troubleshooting | FAQ | All Products]
- Profit for market swings without getting whipsawed
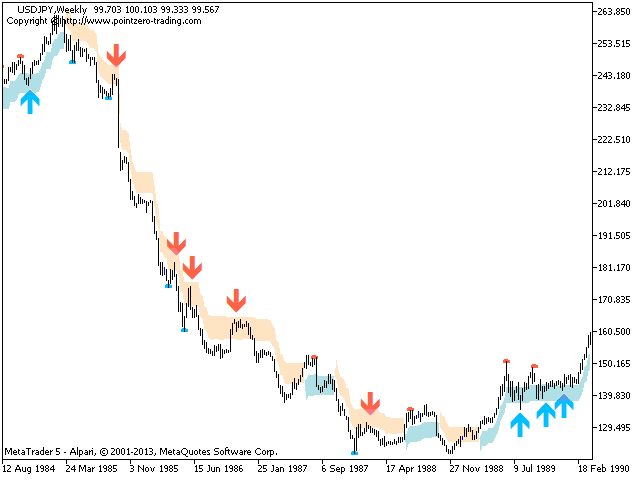
- The indicator displays the trend direction at all times
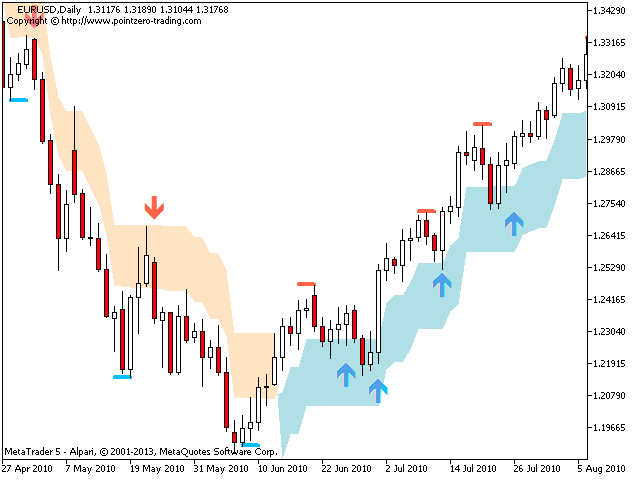
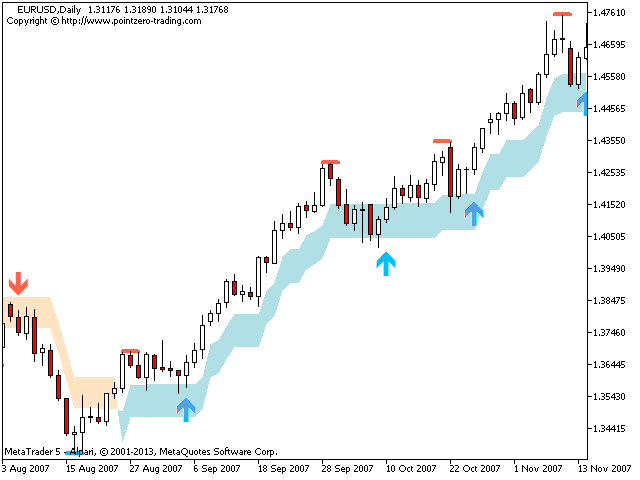
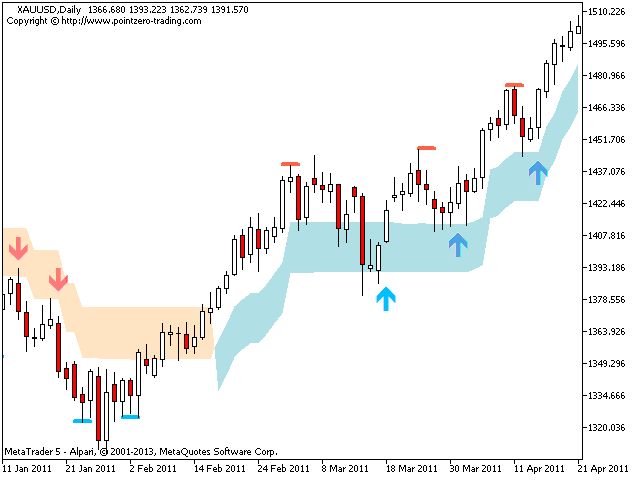
- A colored price band represents the opportunity baseline
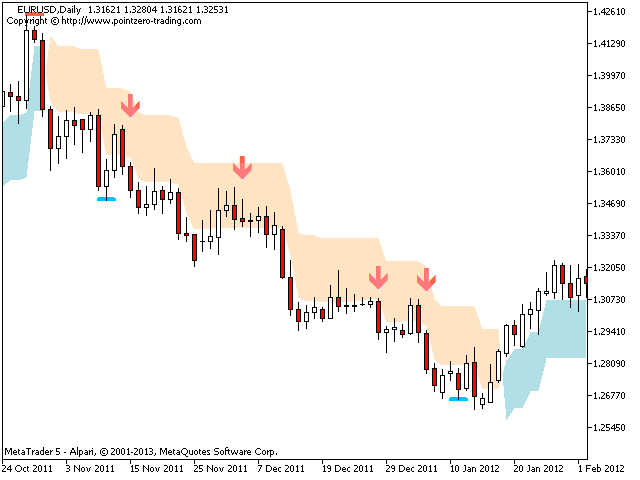
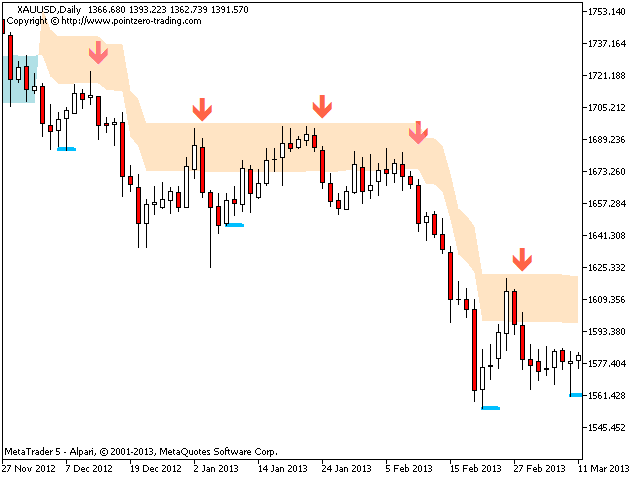
- Colored dashes represent possible reversal swings
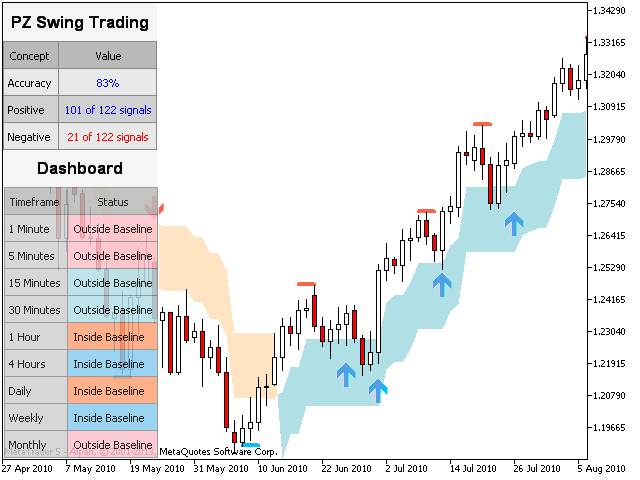
- The indicator analyzes its own quality and performance
- It implements a multi-timeframe dashboard
- Customizable trend and swing periods
- It implements email/sound/push alerts
- The indicator is non-repainting or backpainting
What is Swing Trading
Swing Trading is a style of trading that attempts to capture gains in a security within one day to a week, although some trades can eventually be kept alive for longer. Swing traders use technical analysis to buy weakness and sell strength, and have the patience to wait for these opportunities to happen, because it makes more sense to buy a security after a wave of selling has occurred rather than getting caught in a sell-off
The Opportunity Baseline
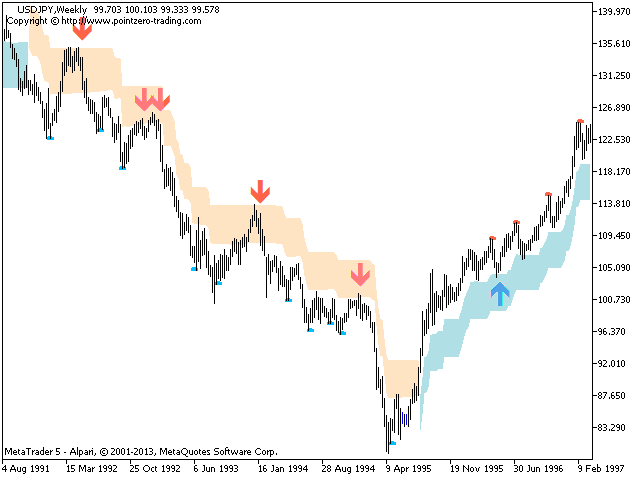
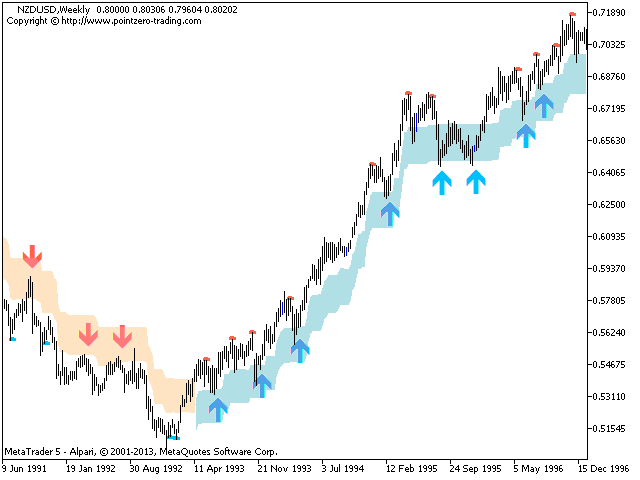
Much research on historical data has proven that markets suitable for swing trading tend to trade above and below a baseline price band, which is portrayed on the chart by a colored band, calculated using the Average True Range. The baseline is used by the swing trader, which strategy is buying normalcy and selling mania or shorting normalcy and covering depression. In absence of exhaustion patterns, the swing trader goes long at the baseline when the stock is heading up and short at the baseline when the stock is on its way down.
Swing traders are not looking to hit the home run with a single trade, they are not concerned about perfect timing to buy a stock exactly at its bottom and sell exactly at its top. In a perfect trading environment, they wait for the stock to hit its baseline and confirm its direction before they make their moves.
The story gets more complicated when a stronger uptrend or downtrend is at play on the current or higher timeframe: the trader may paradoxically go long when the stock jumps below its baseline and wait for the stock to go back up in an uptrend, or he may short a stock that has stabbed above the baseline and wait for it to drop if the longer trend is down. To this effect, the indicator displays reversals as colored dashes.
Input Parameters
- Trend period - This parameter controls the sensitivity to trend changes. A big trend period will lead to longer trends being captured. A small trend period will lead to shorter trends being capture, but a faster recognition of trend changes.
- Baseline period - This parameter controls the sensitivity of the baseline. The period for the baseline should always be below the trend period. Increase it to trade using a bigger opportunity band and decrease it to make it smaller.
- Display swing signals - Enable this parameter to display arrows when the price retraces to the baseline and breakouts out of it.
- Display corrections - Enable this parameteter to display colored dashes when the trend starts to correct.
- Display the dashboard - Enable this parameter to see the multi-timeframe dashboard on the chart.
- Display statistics -Enable this parameter to display the stats dashboard on the chart.
- Drawing Settings -Choose your own colors and sizes for arrows and reversal dashes.
- Alerts - Enable display/email/push/sound alerts for patterns.
Author
Arturo López Pérez, private investor and speculator, software engineer and founder of Point Zero Trading Solutions.


I like it. I prefer it on longer time frames and as Arturo says, use an oscillator to verify signals; which will further improve the base line efficiency score (frequently in the region of 80%).
Note: This is the first review since the recent update Feb 2019.
26/04/21: Indicator has been updated. Appreciate the continued support for this product.