Pattern 1 2 3 MT5
- 지표
- 버전: 4.1
- 업데이트됨: 17 4월 2025
- 활성화: 5

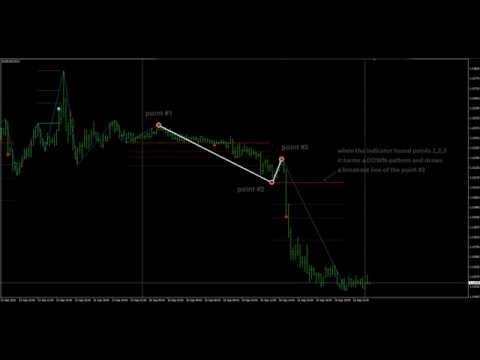
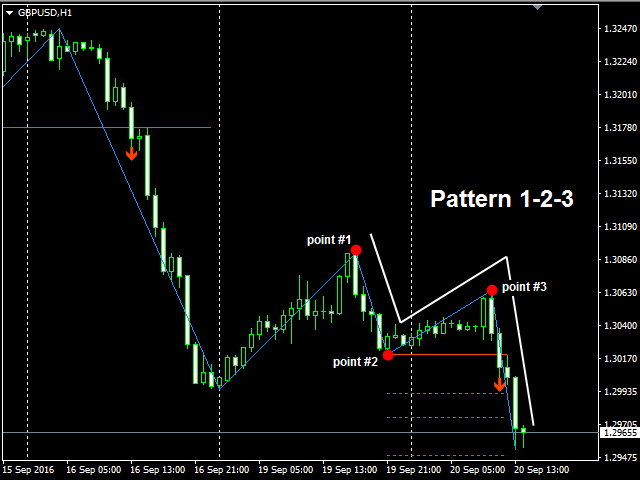
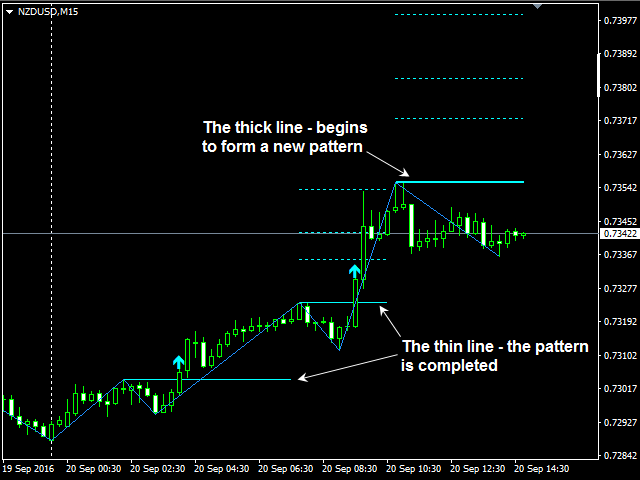
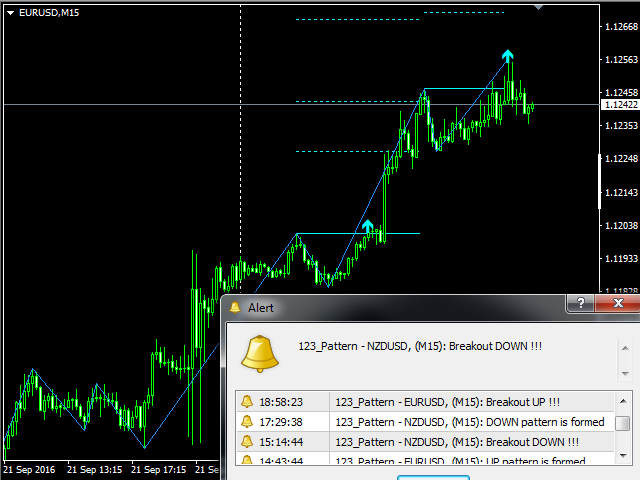
The indicator automatically identifies the 1-2-3 pattern on the chart.
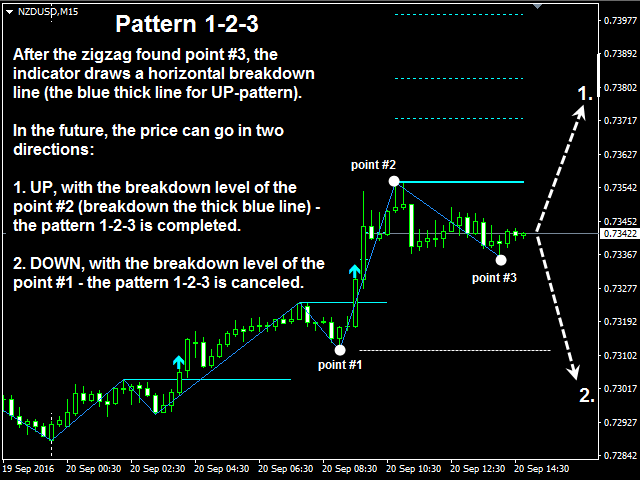
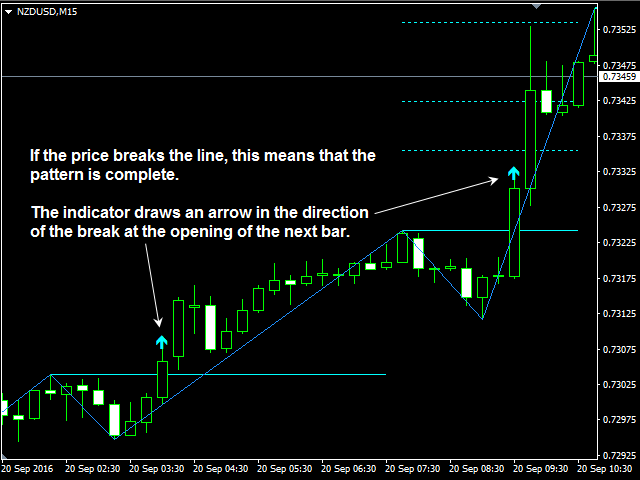
- The indicator is able to monitor the formation of pattern in real time. It informs the trader when the pattern is completely formed (when the price breaks the line in point 2) and displays the completed patterns in history. The patterns are never redrawn.
- The indicator can identify patterns on any instruments (currency pairs, stock market, gold, etc.) without the need to adjust to each instrument.
- Simple and clear visualization of patterns. It is possible to display points 1,2,3 on a chart
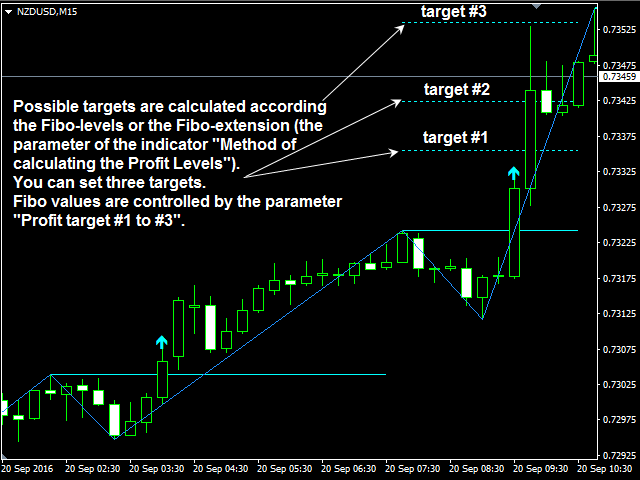
- The indicator determines the possible levels of profit-taking:
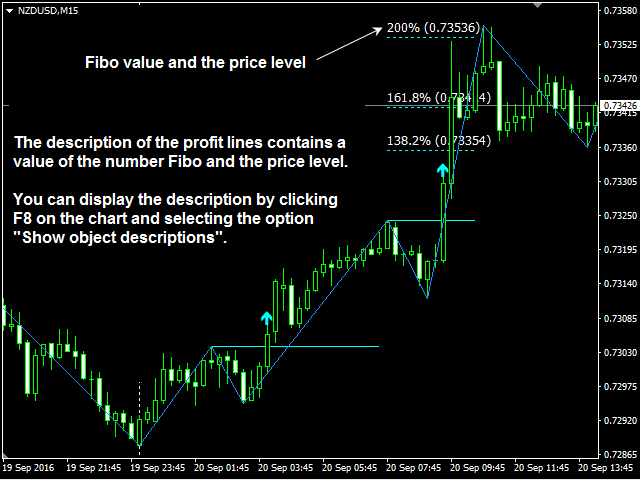
- Fibonacci levels or Fibo extension (parameter "Method of calculating the Fibo Levels"). One to five levels can be calculated. To display the Fibo number and the price value at the level - turn on the description of graphical objects (press the F8 button on the chart and select the "Show object descriptions" option)
- "Awesome Profit Zones" - new levels of profit-taking, which statistically have a very high probability of execution! The probability of working out the near zone is about 80-70%, the far zone is about 30-20%.
- The indicator uses a custom proprietary non-redrawing ZigZag for determining patterns, therefore the indicator never repaints its signals.
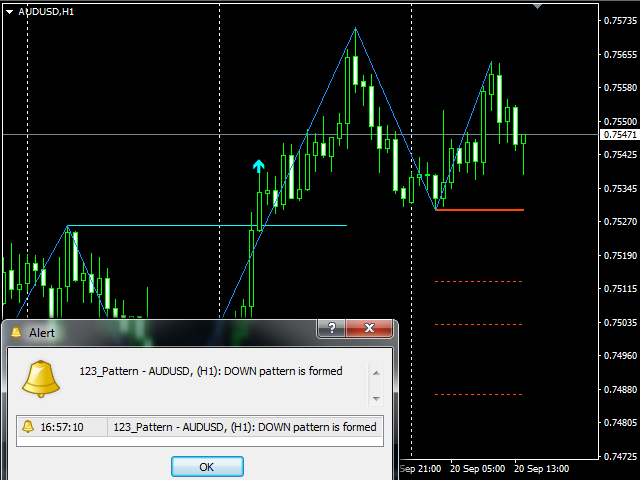
- The indicator generates audio and text message when a pattern is formed. It features sending email messages and push notifications to mobile devices (the 'ON/OFF-Mail' and 'ON/OFF-Push' parameters).
You can test the functionality of the program by downloading the test version from the Comments tab
Features of trading the 1-2-3 pattern
- The 123 pattern can indicate either a reversal or a trend.
- The 123 pattern is effective on any instruments and timeframes from M5 to MN.
- The greater the number of bars forming the pattern (from point 1 to point 3), the greater the price movement is predicted after breaking the pattern.
- If point 1 has a pin-bar (Hammer or Shooting Star in candlestick analysis), it strengthens the pattern.
- For Intraday trading, it is recommended to look for the pattern only on the European and American sessions.
- According to the trading system, a pattern is considered to be triggered when a bar breaks the line at the level of point 2. That is, the bar must close on the other side of the line, and not simply touch or pierce it. However, the indicator can also consider a simple touch of the line from point 2 as pattern triggering (parameter "Method for pattern triggering").
See video https://youtu.be/aBvWfBKTLTE
Parameters
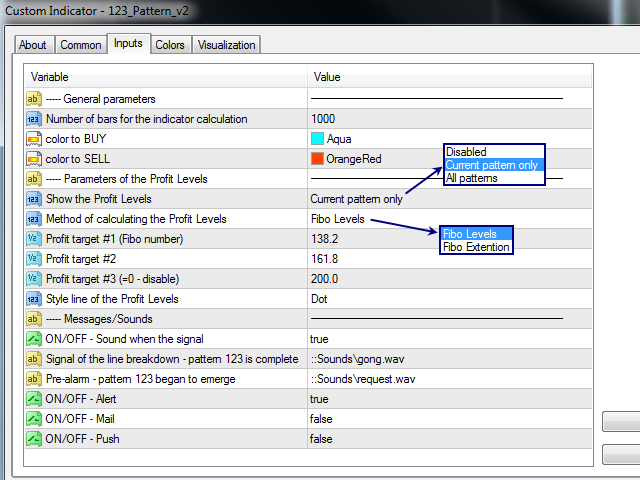
Main parameters:
- Number of bars for the indicator calculation - the number of bars for the indicator calculation
- Depth of ZigZag - the number of bars to search for ZigZag peaks (analogue of the Depth parameter of the standard ZigZag)
- Method for pattern triggering - choose method: "Touch of the line from point #2" or "Breakout of the line from point #2"
Parameters of target profit levels:
- Show "Awesome Profit Zones" - show profit-taking zones with a high probability of execution
- Show the Profit Levels - show the target profit levels (Disabled - do not show; Current pattern only - show the target levels for the current pattern only; All patterns - show the target profit levels for all patterns in history)
- Method of calculating the Profit Levels - method for calculation of profit levels (Fibo Levels; Fibo Extention)
- Profit target #1 (Fibo number) - Profit target #5 (=0 - disable) - Fibonacci number for calculating the target №1 - №5 (if =0, line is not displayed)
- Style line of the Profit Levels - line style of profit levels
- Color to BUY / Color to SELL - the color of lines forming a buy / sell pattern
Notifications and Alerts
- ON/OFF – Sound when the signal – enable/disable sound signal
- Signal of the line breakdown - pattern 123 is complete – name of the sound file for line breakout - the 1-2-3 pattern completed
- Pre-alarm - pattern 123 began to emerge – name of the sound file played when a pattern starts to form.
- ON/OFF - Alert – enable/disable notifications about signals
- ON/OFF - Mail – sending emails
- ON/OFF - Push – sending push notifications to mobile devices


hI, HOW DO I ALLOW ONLY SOUND SIGNAL FOR S the line breakdown - pattern 123 is complete – name of the sound file for line breakout - the 1-2-3 pattern completed.
Other than that I am impressed, I recommend.