Binary Rise Fall
- 지표
- Israr Hussain Shah
- 버전: 1.0
- 활성화: 5
Fractals_Price Indicator Description
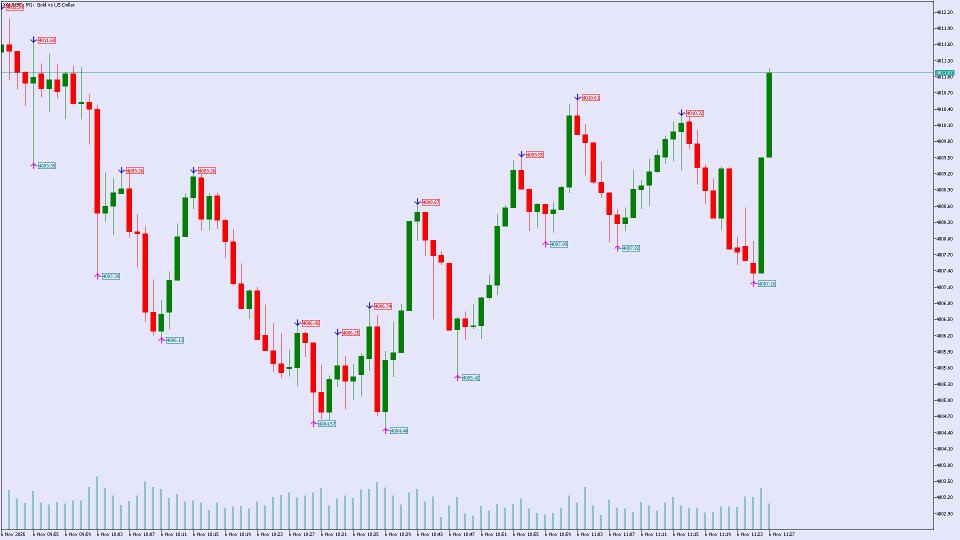
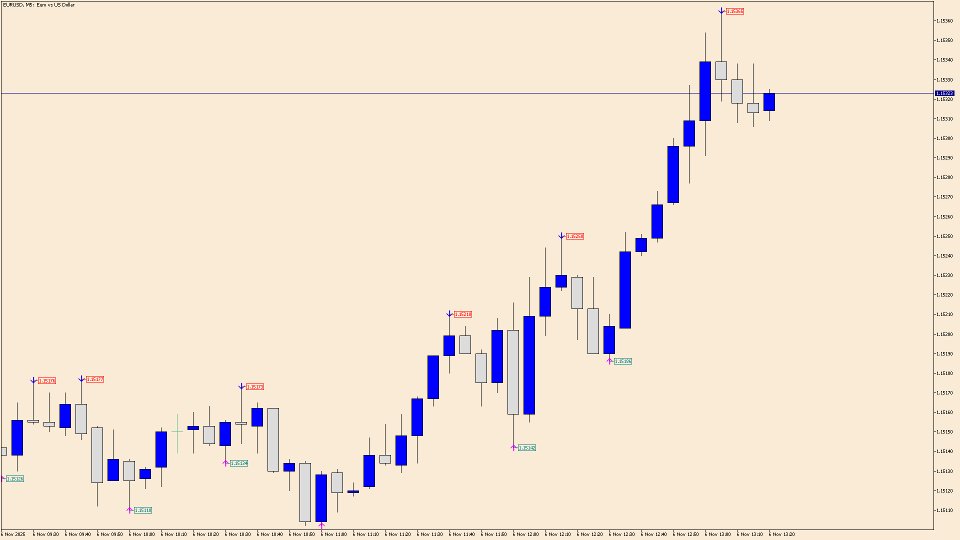
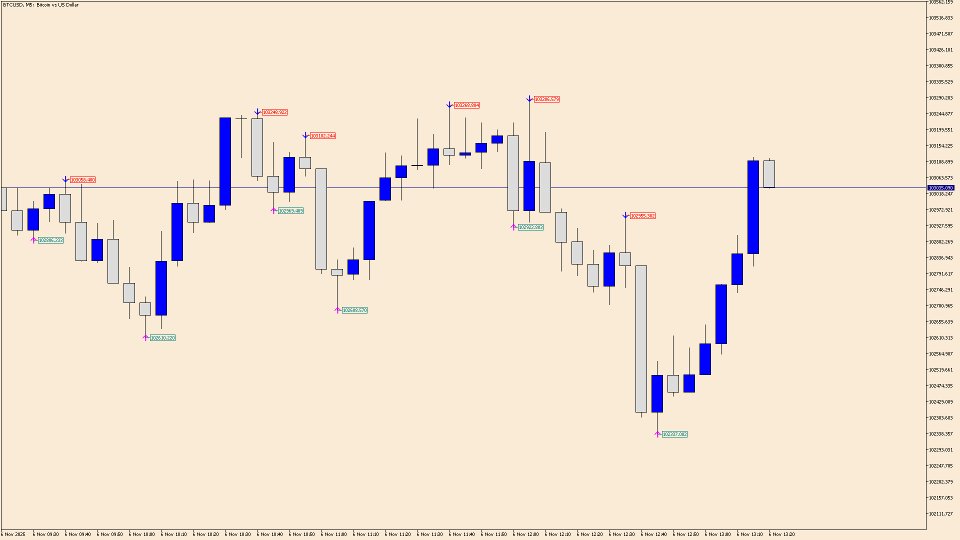
The Fractals_Price indicator is a technical analysis tool that identifies fractal patterns on price charts. Fractals are recurring patterns that signal potential trend reversals or continuation points. This indicator marks both upward and downward fractals with colored arrows and can display price labels at these points.
- Key Features
- Identifies upward fractals (magenta arrows) marking potential resistance levels
- Identifies downward fractals (blue arrows) marking potential support levels
- Detects fractals across multiple timeframes (5-9 bars)
- Customizable colors and size
- Optional price display at fractal points
- Guide for Deriv Binary Trading (Rise/Fall)
- Understanding Fractals in Binary Trading
- Fractals help identify key price levels where the market may reverse or continue its trend, making them valuable for timing binary options entries.
- Using the Indicator for Rise/Fall Trades
- 1. Identifying Support and Resistance
- Downward fractals (blue arrows) indicate potential support levels
- Upward fractals (magenta arrows)indicate potential resistance levels
- Rise Trade Strategy
- Wait for a downward fractal to form (blue arrow)
- Confirm price bounces off this level with a bullish candle
- Enter a Rise trade when price moves above the fractal level
- Set expiry based on the timeframe (e.g.3-5 candles for M5 charts)
- Fall Trade Strategy
- Wait for an upward fractal to form (magenta arrow)
- confirm price rejects this level with a bearish candle
- Enter a Fall trade when price moves below the fractal level
- Set expiry based on the timeframe (e.g., 3-5 candles for M5 charts)
- Trend Continuation Strategy
- In an uptrend, buy on dips to downward fractals
- In a downtrend, sell on rallies to upward fractals
Best Practices
- Combine with other indicators(RSI, MACD) for confirmation
- Use on multiple timeframes for higher probability setups
- Practice on demo account before trading with real money
- Set proper risk management (limit risk to 2-5% per trade)
- Consider market conditions (avoid trading during high volatility news)
Timeframe Recommendations
M1-M5 charts For quick trades (5-15 minute expiries)
This indicator is most effective when used as part of a comprehensive trading strategy rather than as a standalone signal generator.
