Heiken Ashi Smoothed Indicator

Heiken Ashi Smoothed 지표 (MT5 전용)

노이즈 제거 + 스무딩 기능 탑재 Heiken Ashi. 가짜 신호 감소, 트렌드 조기 포착. 외환, 지수, 암호화폐에 최적 (H1-D1).

작동 원리 및 스무딩 방식

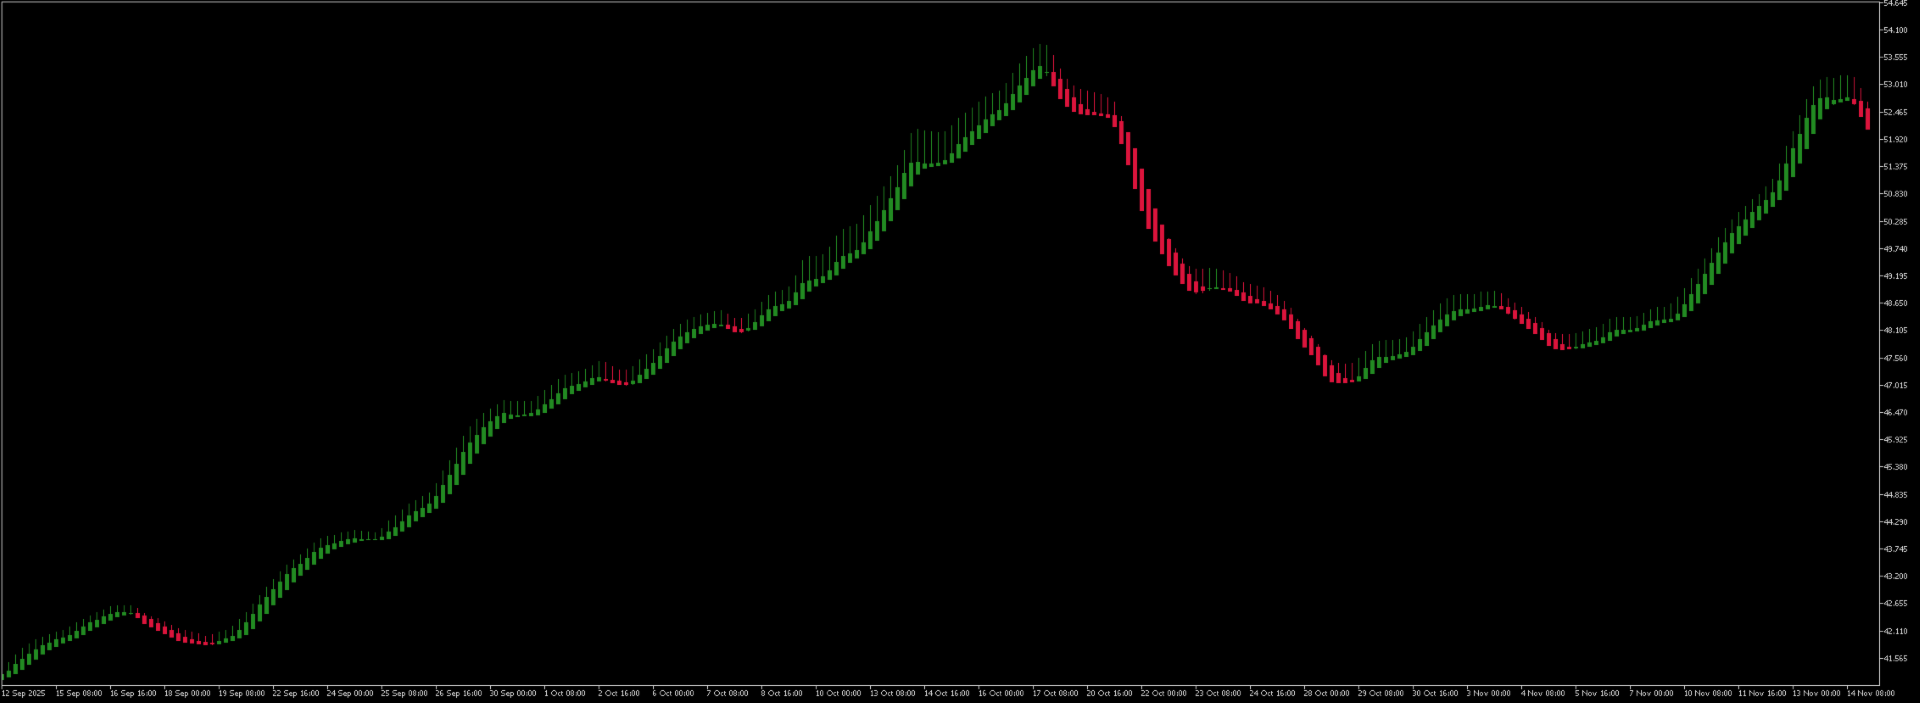
기존 Heiken Ashi는 과거 시가・종가・고가・저가를 평균화하여 캔들을 계산, 이미 작은 변동 영향을 줄입니다. 그러나 Heiken Ashi Smoothed는 "원시" 가격(raw)에 추가 스무딩 필터를 적용하여 이 접근을 향상시킵니다. 직접 가격 대신 이동평균(EMA 또는 SMA, 설정 가능)을 사용해 입력 데이터를 처리, 더 안정적이고 유연한 트렌드를 나타내는 캔들을 생성합니다.

이 스무딩 과정은 두 단계로 진행됩니다:

  1. 기본 Heiken Ashi 계산: 가격을 평균화하여 초기 캔들 형성. 강세 캔들(보통 녹색 또는 백색)은 상승 트렌드, 약세(적색 또는 흑색)는 하락 트렌드를 나타냅니다.
  2. 재귀적 스무딩: 결과에 이동평균 적용, 돌발 피크 제거 및 가격 움직임의 선형 표현 생성. 일시적 변동성 "노이즈" 최소화, 과도한 지연 없이 실시간 분석에 이상적.

결과적으로 스무딩된 캔들은 동적 이동평균처럼 작동: 캔들 위 가격은 강세, 아래는 약세. 가격 교차로 명확한 진입/청산 신호 발생.

주요 장점

이 지표는 트레이딩 정확도 향상 능력으로 돋보이며 구체적 이점 제공:

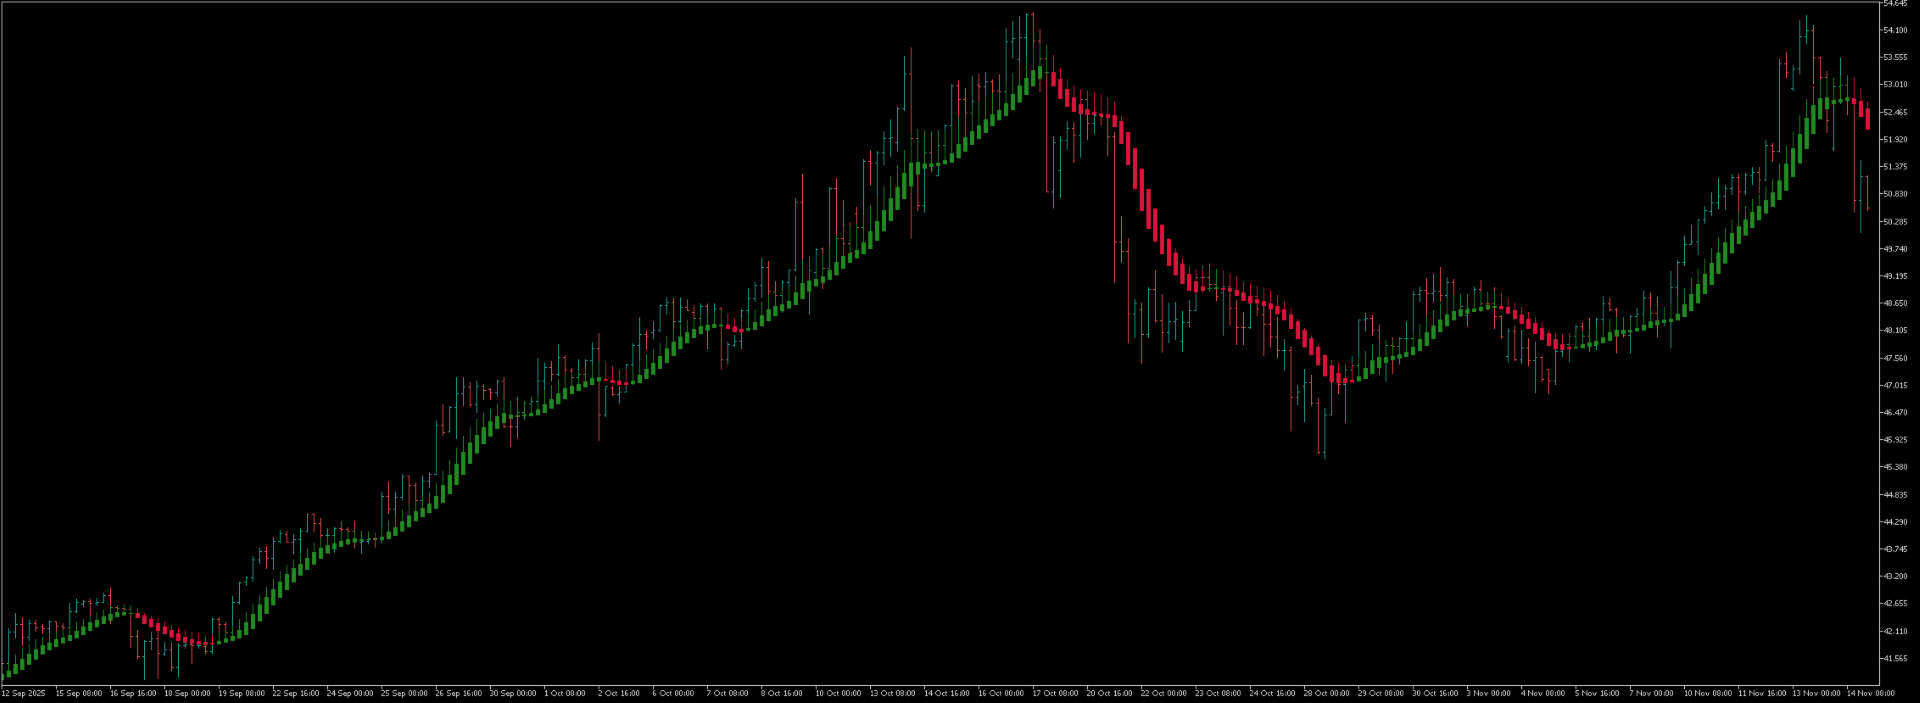
  • 가짜 신호 감소: 시장 노이즈 필터링으로 whipsaw(가짜 움직임) 대폭 줄여, 실제 트렌드에 규율 있는 초점 가능.
  • 트렌드 조기 식별: 그림자 짧은 컬러 캔들이 표준 캔들보다 먼저 방향 변화 강조, 트렌드 팔로우 전략 용이.
  • 사용 편의성: 시각적으로 직관적, 스무딩 기간, 평균 유형(EMA/SMA), 색상 변경 또는 교차 알림 등 커스터마이징 옵션.
  • EA 호환: iCustom을 통해 트레이딩 로봇 통합 가능, 자동 시스템 활용 확대.
  • 감정 스트레스 감소: 변동성 스무딩으로 choppy 시장에서 침착 유지, 운영 일관성 향상.

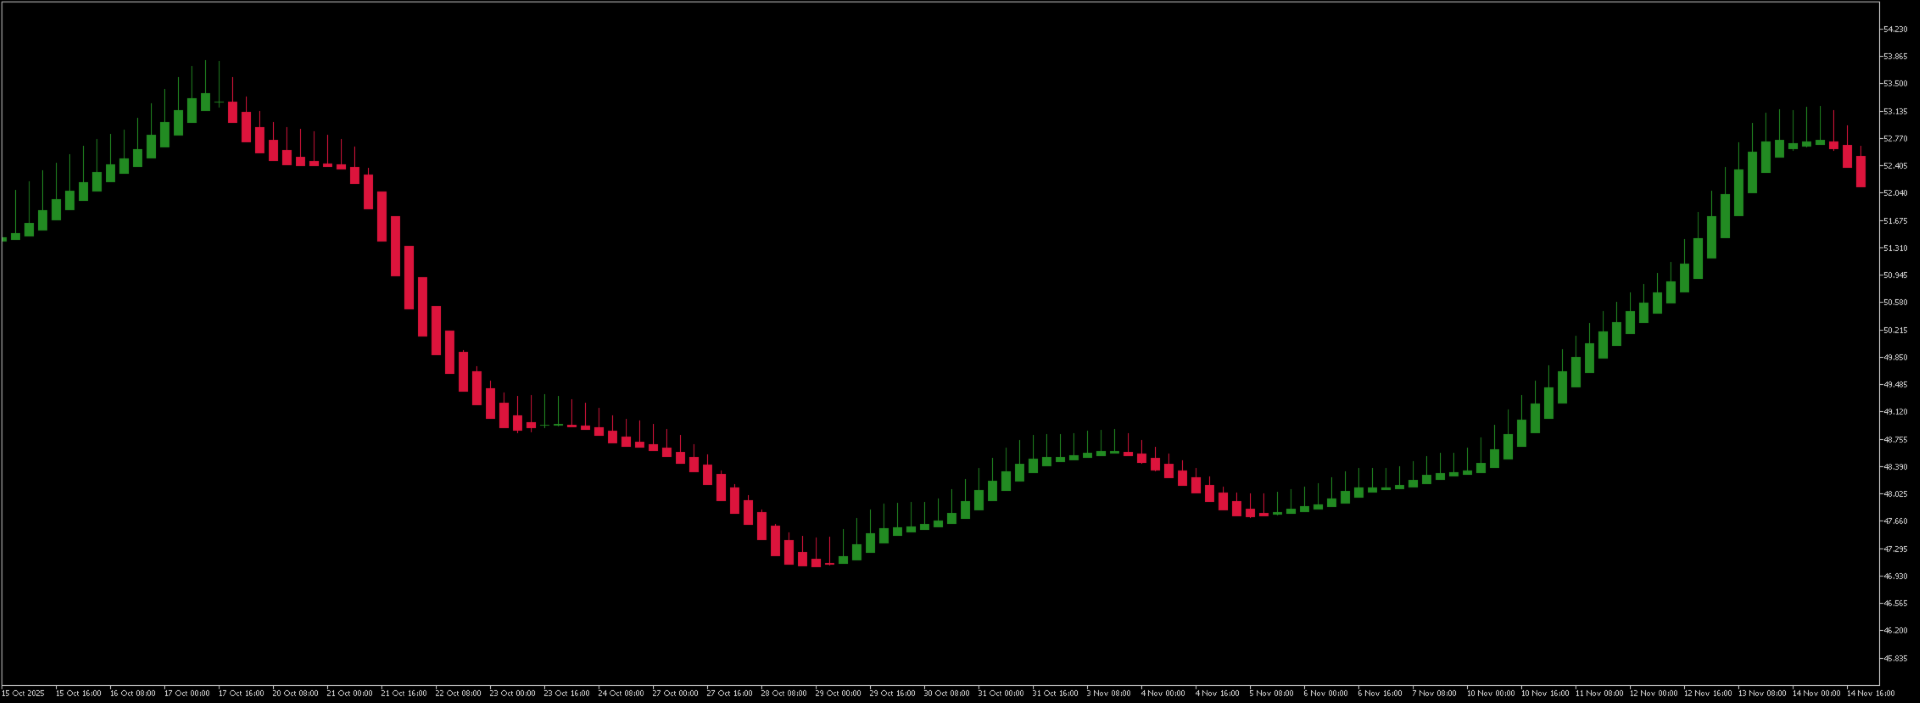
표준 Heiken Ashi 대비 스무딩 버전은 민감성과 신뢰성 균형 잡는 제어된 지연 제공, 중급~고급 트레이더 적합.

추천 자산 및 타임프레임

Heiken Ashi Smoothed 지표는 명확한 트렌드와 중간 변동성 자산에서 빛나며 스무딩이 효과 최대화:

  • 외환: EUR/USD 또는 GBP/USD 등 메이저 페어에 완벽, 데이 트렌드 흔함.
  • 지수 및 주식: S&P 500 또는 고유동성 주식에서 지속 랠리 또는 하락 포착 유용.
  • 원자재: 금(XAU/USD) 또는 원유 추천, 강한 방향성 움직임이지만 가끔 노이즈.
  • 암호화폐: BTC/USD 또는 ETH/USD 극단 변동성 필터링, 매크로 트렌드 집중.

중고 타임프레임(H1, H4, D1)에 최적 적응, 저(T1-M15) 과도 노이즈 피함. 스캘핑 시 RSI 또는 ATR 등 추가 확인 결합.
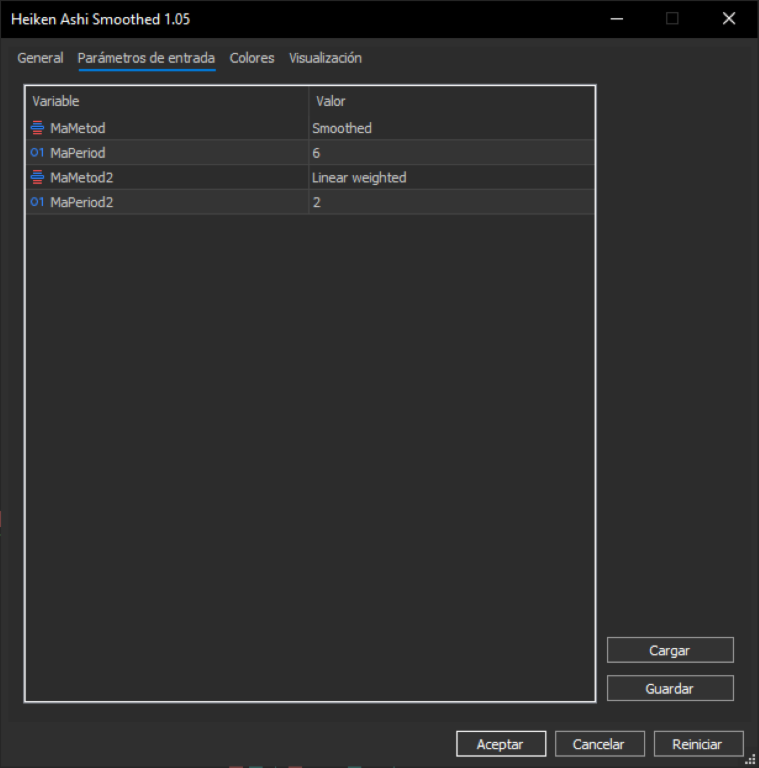
설치 및 설정

  1. MQL5 Market에서 MT5에 지표 다운로드 및 설치.
  2. 원하는 차트에 드래그.
  3. 주요 매개변수 조정: 스무딩 기간(균형 위해 8-14 추천), 평균 유형, 캔들 색상.

추천 제품
SSACD - Singular Spectrum Average Convergence/Divergence This is an analogue of the MACD indicator based on the Caterpillar-SSA ( Singular Spectrum Analysis ) method. Limited version of the SSACD Forecast indicator. Limitations include the set of parameters and their range. Specificity of the method The Caterpillar-SSA is an effective method to handle non-stationary time series with unknown internal structure. The method allows to find the previously unknown periodicities of the series and make
FREE
Big data Triple Average
Cesar Afif rezende Oaquim
This project did not reach the basic funding number, so I am abandoning it momentarily. The system is now free for other traders to continue the idea. You can follow my new project through my signals. A tool for institutional investor, now avaliable for Home users. We equip you like banks equip their analysts! How it works Focused on the Forex market, it takes advantage of the need of nations to control the value of their currency and the world exchange variations to analyze, through the pro
FREE
ChannelRSI5
Iurii Tokman
5 (5)
ChannelRSI5   과매수 및 과매도 영역의 동적 수준이 있는 상대 강도 지수(RSI) 표시기. 동적 수준은 지표 및 가격의 현재 변화에 따라 변경 및 조정되며 일종의 채널을 나타냅니다. 표시기 설정 period_RSI - RSI 인덱스를 계산하기 위한 평균 주기. apply_RSI - 적용 가격. PRICE_CLOSE - 종가, PRICE_OPEN - 시가, PRICE_HIGH - 해당 기간의 최고 가격, PRICE_LOW - 해당 기간의 최소 가격, PRICE_MEDIAN - 중간 가격(고가 + 저가) 중 하나일 수 있습니다. / 2, PRICE_TYPICAL - 일반 가격(고가 + 저가 + 종가) / 3, PRICE_WEIGHTED - 가중 평균 가격, (고가 + 저가 + 종가 + 종가) / 4. period_channel - 과매수 및 과매도 구역의 동적 채널에 대한 계산 기간.
FREE
An analogue of the Stochastic oscillator based on algorithms of singular spectrum analysis (SSA) SSA is an effective method to handle non-stationary time series with unknown internal structure. It is used for determining the main components (trend, seasonal and wave fluctuations), smoothing and noise reduction. The method allows finding previously unknown series periods and make forecasts on the basis of the detected periodic patterns. Indicator signals are identical to signals of the original i
FREE
GPF Stochastic
Fabio Passaro Roy Casanova
5 (1)
GPF Stochastic:  a momentum indicator that compares a specific closing price of an asset to a range of its prices over a certain period. It helps traders identify potential overbought or oversold conditions in the market. The indicator consists of two lines: %K Line : The main line, which represents the current closing price relative to the price range over a set period. %D Line : The signal line, which is a moving average of %K. The Stochastic Oscillator ranges from 0 to 100 , with levels typic
FREE
KeltnerChannelIndicatorMT5
Todd Terence Bates
3 (2)
The Keltner Channel is a volatility-based technical indicator composed of three separate lines. The middle line is an exponential moving average (EMA) of the price. Additional lines are placed above and below the EMA. The upper band is typically set two times the Average True Range (ATR) above the EMA, and the lower band is typically set two times the ATR below the EMA. The bands expand and contract as volatility (measured by ATR) expands and contracts. Since most price action will be encompasse
FREE
Daily High Low Danilo Monteiro
Danilo Hudson Couto Monteiro
4 (1)
# Indicador Daily High - Danilo Monteiro - MT5 ## Descrição O Daily High/Low Labels é um indicador personalizado para MetaTrader 5 que exibe automaticamente as máximas e mínimas diárias no gráfico, facilitando a identificação rápida dos níveis importantes de preço. O indicador marca os preços com etiquetas e linhas horizontais, permitindo uma visualização clara dos níveis críticos do dia atual e anterior. ## Principais Características ### 1. Marcação Automática - Exibe automaticamente as máxi
FREE
AvgVolumes
Marco Montemari
5 (1)
This indicator is based on Volumes standard indicator, calculates the average of Volumes based on the last N bars set by users, and if the value of the volume is bigger then a set % respect the average a different color will be used. The indicator is shown in a separate indicator window. This version has now a limitation in setting the % about the threshold. If you are interested to set threshold consider to buy the PRO version ( https://www.mql5.com/en/market/product/35925 ) If you want to use
FREE
Thread
Sergei Kuzmenko
Thread indicator is calculating possible values for the upcoming periods. It is built by author’s system, with ability to learn. Input data   ( recommended interval ): Sensitivity to oscillatory motion (integer value, 0 - 8) increase of value shifts priority of calculation towards high-frequency vibrations (increase loads the system) Shift of diagram (integer value, 0 - 8) shifts output of indicator to the right Diagram forecast (integer value, maximum 10) defies the number of periods calculated
FREE
Intraday Momentum Index IMI
Danilo Hudson Couto Monteiro
Indicador IMI (Intraday Momentum Index) Descrição O Indicador IMI (Intraday Momentum Index) é uma poderosa ferramenta de análise técnica desenvolvida para identificar a força do momentum e potenciais reversões no mercado. Este indicador quantifica a relação entre ganhos e perdas durante um período específico, ajudando traders a avaliar a dinâmica atual do mercado. Características Oscila entre 0 e 100, facilitando a interpretação das condições de mercado Identifica com precisão áreas de sobrecomp
FREE
Trading Sessions by Mahefa R is an indicator for MetaTrader 5 that visually identifies the four main trading sessions: New York, London, Tokyo, and Sydney . Designed to provide a clean, intuitive, and professional market view, it highlights the most active periods of the Forex market using smart visualization of session ranges , session-specific candle colors , and daily separators . Main Features: Automatic detection of the 4 major sessions New York London Tokyo Sydney Each session is fully c
FREE
TTM Squeeze MT5
Tinashe Ndarimani
4.88 (8)
Overview The TTM Squeeze indicator helps identify low volatility periods (squeeze) that often precede price breakouts. It uses Bollinger Bands (BB) and Keltner Channels (KC) to determine when the market is "coiling" and ready to move. Configuration Guide Volatility Settings The indicator uses Bollinger Bands to measure market volatility. When BBs are inside Keltner Channels, a squeeze is detected. The squeeze suggests the market is consolidating and may soon break out. True Range Option Optional
FREE
Gold Levels MTF MT5
Sergei Linskii
5 (8)
Gold Levels MTF - this is a fine stock technical indicator. The indicator algorithm analyzes the movement of the asset price, displays price levels of support and resistance from all time frames (TF) using the Murray method based on the Gann theory. The indicator indicates overbought and oversold fields, giving an idea of possible reversal points and at the same time giving some idea of the strength of the current trend. Description of levels: (Extreme Overshoot) - these levels are the ultimate
FREE
Sma Plus
Roberto Mubonane Muiambo
5 (1)
A   moving average   is simply a way to   smooth out   price fluctuations to help you distinguish between typical market “noise” and the actual   trend direction . By “moving average”, we mean that you are taking the average closing price of a currency pair for the last ‘X’ number of periods. Like every technical indicator, a moving average (MA) indicator is used to help us forecast future prices.
FREE
Trend Quality
Alex Rodin De Sousa E Silva
The Trend Quality Indicator  (by David Sepiashvili) is intended to measure trend activity. Some benchmarks can be used to determine the strength of a trend.  In the range of values from -1 to +1 ( Ignored zone parameter) ,  the trend is buried beneath noise. It is preferable to stay out of this zone.  The greater the value, the less the risk of trading with a trend, and the more reliable the trading opportunity.  The range from +1 to +2, or from -1 to -2, may be treated as zone of weak trend
MACD with 4-Color Histogram Overview MACD with 4-Color Histogram is a modern upgrade of the classic MACD indicator — redesigned for clarity, precision, and visual power . It provides instant insight into market momentum , signal strength , and trend reversals using four distinct color zones that make trading decisions faster and more confident. Color Logic Color Condition Interpretation Green MACD > 0, Signal < MACD Bullish momentum strengthening Orange MACD > 0, Signal > MACD Bul
FREE
Standard RSI uses a fixed smoothing factor. Every bar gets the same weight whether the market is trending cleanly or chopping sideways. That is why most RSI signals fail during consolidation. Mystical RSI measures how chaotic price action is on every bar using the Fractal Dimension Index and dynamically adjusts its smoothing in real time. When the market trends, it reacts fast. When the market chops, it slows down and filters out noise. No manual adjustment needed. How It Works The indicator cal
FREE
MACD Titanium
Donovan Tjin-a-tak
MACD Titanium은 MetaTrader 5용 Zero-Lag MACD 지표로, 기존 MACD보다 더 빠르고 명확한 모멘텀 신호를 제공합니다. Zero-Lag EMA 계산 방식을 사용하여 신호 지연을 줄이고 시장 모멘텀 변화에 더욱 빠르게 반응하면서도, 전통적인 MACD 구조를 유지합니다. 차별점 • Zero-Lag EMA 사용 • 모멘텀 변화에 빠른 반응 • 교차 지점을 명확히 표시 • 동적 배경 색상으로 현재 방향성 표시 • 모든 시간대와 종목에서 사용 가능 리페인트 없음. 모든 계산은 실시간 수행. 시각적 구조 아쿠아 라인 – MACD 오렌지 라인 – 시그널 녹색 점 – 상승 교차 빨간 점 – 하락 교차 배경 색상 – 현재 모멘텀 방향 녹색 = 상승 우세 빨간색 = 하락 우세 명확성을 중심으로 설계되었습니다. MACD Titanium Pro가 곧 출시됩니다 — 알림 기능, 멀티 타임프레임 분석 및 고급 다이버전스 감지 기능이 포함됩니다. MACD Titanium Trend
FREE
Phoenix Moving Average Meter
PHOENIX GLOBAL INVESTMENTS LTD
피닉스 이동평균 미터 (MT5) MetaTrader 5용 전문 이동평균 추세 분석 및 시각화 도구입니다. 지능형 기울기 분석, 구름 폭 측정, 체제 분류 기능을 깔끔한 실시간 대시보드에 통합했습니다. 개요 피닉스 이동평균 미터는 빠른 이동평균과 느린 이동평균 간의 관계를 분석하여 추세 방향, 강도, 성숙도를 판단합니다. 지표는 이동평균 기울기 각도, 구름 폭 확장/수축, 교차 발생 후 경과 시간을 지속적으로 모니터링하여 실시간으로 현재 시장 체제를 분류합니다. 이 시스템은 이중 말굽형 미터 디스플레이를 특징으로 합니다. 기울기 위치 미터는 빠른 이동평균의 각도를 감소에서 평탄, 증가로 시각화하며, 구름 폭 미터는 역사적 평균 대비 추세 압축 및 확장을 측정합니다. 이 둘은 함께 모멘텀 품질과 추세 지속 가능성에 대한 즉각적인 통찰력을 제공합니다. 추세 상태는 강세 및 약세 조건 모두에서 자동으로 ‘약세’, ‘보통’, ‘강세’, '연장'으로 분류됩니다. 구름 색상은 추세 상태
FREE
MT5 opnMAX Sysifus
Nelson Rodrigo Caldeira Patrao
opnMAX Sysifus: Indicator Overview Traditional Volume Profile and TPO (Time Price Opportunity) indicators suffer from a fatal flaw: they rely on hundreds of heavy graphical objects that lag the MetaTrader 5 terminal, drain CPU resources, and interfere with Expert Advisor execution. opnMAX Sysifus is engineered to solve this. It is a razor-sharp, highly optimized structural mapper that dives into granular 1-minute tick data to reveal exactly where institutional liquidity is parked and where sudd
FREE
The Volume Weighted ATR indicator is a helpful tool for measuring market activity. It is based on the idea of the Volume-Weighted ATR. Combining these two elements helps identify potential turning points or breakout opportunities. The indicator for the classification of the activity of the market uses the moving average and its multiples. Accordingly, where the VWATR bar is located (relative to the moving average), it is labelled as ultra-low, low, average, high, very high or ultra high. The Vo
FREE
ToolBot Probabilistic Analysis
Josue De Matos Silva
4 (1)
ToolBot Probabilistic Analysis - FREE   An effective indicator for your negotiations The toolbot indicator brings the calculation of candles and a probabilistic analysis so that you have more security on your own. Also test our  FREE tops and bottoms indicator: :   https://www.mql5.com/pt/market/product/52385#description Also test our  FREE (RSI, ATR, ADX, OBV) indicator:   https://www.mql5.com/pt/market/product/53448#description Try our EA ToolBot for free:   https://www.mql5.com/market/prod
FREE
Tushar Chande Aroon
Flavio Javier Jarabeck
4 (5)
The name Aroon means “ Dawn's Early Light ” in Sanskrit. His creator Tushar Chande chose this name because the indicator is designed to catch the beginning of a new trend. At first sight it seems a little confusing all those jagged lines but after you understand the basics of it, you will find this indicator pretty cool and use it in a variety of ways, i.e.: Trigger, Trend Filtering System, and so on. The Aroon indicator was created in 1995 so it is a "modern" indicator compared to the Jurassic
FREE
BeST Oscillators Collection MT5
Eleni Koulocheri
4.33 (9)
BeST_Oscillators Collection is a Composite MT5 Indicato r including the Chaikin ,  Chande and TRIX Oscillators from which by default Chaikin and TRIX Oscillators but not Chande Momentum Oscillator are contained in MT5 platform. It also provides for each Oscillator the option of displaying or not a Mov. Average as a  Signal Line and the resulting Signals as Arrows in a Normal (all arrows) or in a Reverse Mode (without showing up any resulting successive and of same type arrows). Analytically fo
FREE
FractalEfficiencyIndicator   A ratio between 0 and 1 with the higher values representing a more efficient or trending market,  It is used in the calculation of Perry J. Kaufman Adaptive Moving Average (KAMA), dividing the price change over a period by the absolute sum of the price movements that occurred to achieve that change. The Fractal Efficiency or also known as Efficiency Ratio was first published by Perry J. Kaufman in his book   ‘Smarter Trading‘. This is mostly considered a filter for v
FREE
Menora Indicator
Arnold Kurapa
4.5 (2)
Menora (All In One) Indicator. This is the advanced and premium indicator for the Magic Trend, a free indicator.  It has 3 output signals driven by different market conditions. This indicator has a double function of working as an indicator and utility at the same time. Specifications  1]  3 output signals a) Slow Moving Average with color change - The MA has a non-repaint color change, which makes it perfect for entry signals. b) Fast Moving Average (the original Magic Trend line) - Gives a
FREE
The  ATR Finder  indicator for MT5 is a powerful tool designed to help traders analyze market volatility using the  Average True Range (ATR) . This indicator calculates and displays ATR values dynamically, allowing traders to identify periods of high and low volatility, optimize stop-loss and take-profit levels, and refine their trading strategies. Key Features: • Real-time ATR Calculation – Continuously updates ATR values to reflect current market conditions. • Customizable Settings – Adjust
FREE
Explosion Signal Indicator analyzes the market for sharp changes in volatility and volume that often precede significant price movements. The indicator uses the ratio of short-term and long-term ATR to assess current volatility relative to the average level. Simultaneously, it monitors current volume compared to the average over a specified period. When the volatility or volume exceeds the defined thresholds, the indicator determines the direction of movement through momentum calculation — the
FREE
An improved version of the standard Standard Deviation indicator. It is now a responsive and smoothed line. The setup is not straightforward - but I hope you can do it. It is very easy to understand the readings of this indicator, the meaning is the same as that of the usual Standard Deviation. //////////////////////////////////////////////// /////////////////////////////////// I hope this indicator will be very useful to you in successful trading. Good luck.
FREE
MegaSpikes Boom and Crash
Kwaku Bondzie Ghartey
4.53 (30)
MegaSpikes Boom and Crash MegaSpikes Boom and Crash is a MetaTrader 5 technical indicator for studying Boom and Crash synthetic index charts, mainly on the M1 timeframe. It brings several MegaSpikes modes into one indicator so users can observe chart conditions, alerts, and technical confirmations from a single tool. Main features Version selector for MegaSpikes 1, 1.31, 1.32, Divergence, and Last Red Candle modes. Technical-analysis components based on RSI, ATR, Alligator, moving averages, Para
FREE
이 제품의 구매자들이 또한 구매함
ARIPoint
Temirlan Kdyrkhan
ARIPoint is a powerful trading companion designed to generate high-probability entry signals with dynamic TP/SL/DP levels based on volatility. Built-in performance tracking shows win/loss stats, PP1/PP2 hits, and success rates all updated live. Key Features: Buy/Sell signals with adaptive volatility bands Real-time TP/SL/DP levels based on ATR Built-in MA Filter with optional ATR/StdDev volatility Performance stats panel (Success, Profit/Loss, PP1/PP2) Alerts via popup, sound, push, or email Cu
SuperScalp Pro
Van Minh Nguyen
4.57 (21)
SuperScalp Pro – 고급 멀티 필터 스캘핑 지표 시스템 SuperScalp Pro는 클래식 Supertrend와 여러 지능형 확인 필터를 결합한 고급 스캘핑 지표로, 거래 기회를 식별하는 데 도움을 줍니다. M1부터 H4까지 다양한 시간대에서 효율적으로 작동하며, XAUUSD, BTCUSD 및 주요 Forex 통화쌍에 최적화되어 있습니다. 이 지표는 명확한 매수 및 매도 신호를 제공하며, ATR 기반으로 진입가, 손절가, 익절가를 자동 계산하여 보다 효과적인 리스크 관리를 지원합니다. Fibonacci Take Profit 기능은 중요한 가격 구간에서 더 빠르게 포지션을 청산할 수 있도록 하며, 해당 수준 도달 시 알림을 전송합니다. 기본 설정은 Fibonacci Take Profit이 활성화된 상태로 최적화되어 있으며, 보다 안정적이고 일관된 거래 경험에 중점을 둡니다. 차트에 적용하는 것만으로 즉시 사용할 수 있습니다. 고급 사용자를 위해 모든 파라미터는 자유롭게 사용
Divergence Bomber
Ihor Otkydach
4.9 (87)
이 지표를 구매하신 분께는 다음과 같은 혜택이 무료로 제공됩니다: 각 거래를 자동으로 관리하고, 손절/익절 수준을 설정하며, 전략 규칙에 따라 거래를 종료하는 전용 도우미 툴 "Bomber Utility" 다양한 자산에 맞게 지표를 설정할 수 있는 셋업 파일(Set Files) "최소 위험", "균형 잡힌 위험", "관망 전략" 모드로 설정 가능한 Bomber Utility의 셋업 파일 이 전략을 빠르게 설치, 설정, 시작할 수 있도록 돕는 단계별 영상 매뉴얼 주의: 위의 모든 보너스를 받기 위해서는 MQL5 개인 메시지 시스템을 통해 판매자에게 연락해 주세요. 독창적인 커스텀 지표인 “Divergence Bomber(다이버전스 봄버)”를 소개합니다. 이 지표는 MACD 다이버전스(괴리) 전략을 기반으로 한 올인원(All-in-One) 거래 시스템입니다. 이 기술 지표의 주요 목적은 가격과 MACD 지표 간의 다이버전스를 감지하고, **향후 가격이 어느 방향으로 움직일지를 알려주는
Entry In The Zone and SMC Multi Timeframe is a real-time 2-in-1 market analysis tool that combines market structure analysis and a No Repaint BUY / SELL signal system into a single indicator, built on Smart Money Concepts (SMC) — a widely adopted framework used by professional traders to understand market structure. This indicator helps you see the market more clearly, make decisions based on structure rather than guesswork, and focus on high-probability zones where price is more likely to react
Gold Entry Sniper
Tahir Mehmood
5 (8)
Gold Entry Sniper – 골드 스캘핑 & 스윙 트레이딩을 위한 전문 다중 시간 프레임 ATR 대시보드 Gold Entry Sniper 는 XAUUSD 및 기타 종목에 대해 정확한 매수/매도 신호 를 제공하는 고급 MetaTrader 5 지표입니다. ATR 트레일링 스톱 로직 과 다중 시간 프레임 분석 을 기반으로 설계되어 스캘핑과 스윙 트레이딩 모두에 적합합니다. 주요 기능 및 장점 다중 시간 프레임 분석 – M1, M5, M15 추세를 한눈에 확인. ATR 기반 트레일링 스톱 – 변동성에 따라 자동 조정. 전문 차트 대시보드 – 신호 상태, ATR 레벨, 회귀선, 매매 방향 표시. 명확한 매수/매도 마커 – 자동 화살표와 텍스트 라벨. 종료 알림 & 거래 관리 – 수익 보호를 위한 자동 종료 감지. 완전 사용자 설정 가능 – 대시보드 위치, 색상, ATR/회귀선 파라미터 조정. 골드(XAUUSD) 최적화 – M1~M15 스캘핑에 완벽, 외환/지수/암호화폐에도 적용 가능.
Power Candles MT5
Daniel Stein
5 (7)
Power Candles V3 - 최초의 자가 최적화 강도 지표 Power Candles V3 는 강도 분석을 즉시 실행 가능한 트레이딩 시스템으로 바꿉니다. 시장 강도에 따라 차트에 색을 입히는 것에 그치지 않고, 백그라운드에서 실시간 자동 최적화를 돌려 해당 심볼에 가장 적합한 Stop Loss, Take Profit, 시그널 임계값을 제시합니다. 원클릭으로 실거래에 그대로 적용됩니다. 이 도구는 Stein Investments 생태계의 일부입니다.  18종 도구 전체 탐색, AI 기반 셋업 추천,  커뮤니티 참여는 여기에서: https://stein.investments Version 3 신규 기능 - AUTO-OPTIMIZER 차트가 로드될 때마다, 그리고 각 봉이 마감될 때마다 Power Candles V3는 해당 심볼의 과거 데이터 위에서 3,000개 이상의 트레이드 조합 을 시뮬레이션합니다: 두 가지 전략 을 병렬 테스트: Momentum(MOM)과 Reversal(
Grabber System MT5
Ihor Otkydach
4.83 (23)
탁월한 기술적 지표인 Grabber를 소개합니다. 이 도구는 즉시 사용 가능한 “올인원(All-Inclusive)” 트레이딩 전략으로 작동합니다. 하나의 코드 안에 강력한 시장 기술 분석 도구, 매매 신호(화살표), 알림 기능, 푸시 알림이 통합되어 있습니다. 이 인디케이터를 구매하신 모든 분들께는 다음의 항목이 무료로 제공됩니다: Grabber 유틸리티: 오픈 포지션을 자동으로 관리하는 도구 단계별 영상 매뉴얼: 설치, 설정, 그리고 실제 거래 방법을 안내 맞춤형 세트 파일: 인디케이터를 빠르게 자동 설정하여 최고의 성과를 낼 수 있도록 도와줍니다 다른 전략은 이제 잊어버리세요! Grabber만이 여러분을 새로운 트레이딩의 정점으로 이끌어 줄 수 있습니다. Grabber 전략의 주요 특징: 거래 시간 프레임: M5부터 H4까지 거래 가능한 자산: 어떤 자산이든 사용 가능하지만, 제가 직접 테스트한 종목들을 추천드립니다 (GBPUSD, GBPCAD, GBPCHF, AUDCAD, AU
이 지표를 구매하면 제 프로페셔널 트레이드 매니저를 무료로 드립니다. 우선 이 거래 시스템이 리페인팅, 리드로잉 및 레이그 인디케이터가 아니라는 점을 강조하는 것이 중요합니다. 이는 수동 및 로봇 거래 모두에 이상적인 것으로 만듭니다. 온라인 강좌, 설명서 및 프리셋 다운로드. "스마트 트렌드 트레이딩 시스템 MT5"은 새로운 및 경험이 풍부한 트레이더를 위해 맞춤형으로 제작된 종합적인 거래 솔루션입니다. 10개 이상의 프리미엄 인디케이터를 결합하고 7개 이상의 견고한 거래 전략을 특징으로 하여 다양한 시장 조건에 대한 다목적 선택이 가능합니다. 트렌드 추종 전략: 효과적인 트렌드 추이를 타기 위한 정확한 진입 및 손절 관리를 제공합니다. 반전 전략: 잠재적인 트렌드 반전을 식별하여 트레이더가 범위 시장을 활용할 수 있게 합니다. 스캘핑 전략: 빠르고 정확한 데이 트레이딩 및 단기 거래를 위해 설계되었습니다. 안정성: 모든 인디케이터가 리페인팅, 리드로잉 및 레이그가 아니므로 신뢰
SignalTech MT5
Yue Wang
5 (4)
SignalTech MT5 is a trading system for EURUSD, USDCHF, USDJPY, AUDUSD, NZDUSD, EURJPY, AUDJPY, NZDJPY, CADJPY H2 and H3 Timeframe.  It can generate signals with Buy/Sell Arrows and Pop-Up/Sound Alerts. Each signal has clear Entry and Stop Loss levels, which should be automatically flagged on the chart, as well as potential Targets 1, 2, and 3. The Entry and TP levels are fixed after the trade is taken. The exit level is dynamic. If there are signs of a potential short-term trend reversal, the
Quantum TrendPulse
Bogdan Ion Puscasu
5 (23)
SuperTrend   ,   RSI   ,   Stochastic   의 힘을 하나의 포괄적인 지표로 결합하여 트레이딩 잠재력을 극대화하는 궁극의 트레이딩 도구   인 Quantum TrendPulse를   소개합니다. 정밀성과 효율성을 추구하는 트레이더를 위해 설계된 이 지표는 시장 추세, 모멘텀 변화, 최적의 진입 및 종료 지점을 자신 있게 식별하는 데 도움이 됩니다. 주요 특징: SuperTrend 통합:   주요 시장 추세를 쉽게 따라가고 수익성의 물결을 타세요. RSI 정밀도:   매수 과다 및 매도 과다 수준을 감지하여 시장 반전 시점을 파악하는 데 적합하며 SuperTrend 필터로 사용 가능 확률적 정확도:   변동성이 큰 시장에서 숨겨진 기회를 찾기 위해 확률적 진동   을 활용하고 SuperTrend의 필터로 사용 다중 시간대 분석:   M5부터 H1 또는 H4까지 다양한 시간대에 걸쳐 시장을 최신 상태로 유지하세요. 맞춤형 알림:   맞춤형 거래 조건이 충족되면
Gann Made Easy MT5
Oleg Rodin
5 (2)
Gann Made Easy 는 mr.의 이론을 사용하여 최고의 거래 원칙을 기반으로 하는 전문적이고 사용하기 쉬운 Forex 거래 시스템입니다. W.D. 간. 이 표시기는 Stop Loss 및 Take Profit Levels를 포함하여 정확한 BUY 및 SELL 신호를 제공합니다. PUSH 알림을 사용하여 이동 중에도 거래할 수 있습니다. 구매 후 거래 방법 안내 및 유용한 추가 지표를 무료로 받으시려면 저에게 연락주세요! 아마도 Gann 거래 방법에 대해 이미 여러 번 들었을 것입니다. 일반적으로 Gann의 이론은 초보자 거래자뿐만 아니라 이미 거래 경험이 있는 사람들에게도 매우 복잡한 것입니다. Gann의 거래 방식은 이론적으로 적용하기 쉽지 않기 때문입니다. 나는 그 지식을 연마하고 Forex 지표에 최고의 원칙을 적용하기 위해 몇 년을 보냈습니다. 표시기는 적용하기가 매우 쉽습니다. 차트에 첨부하고 간단한 거래 권장 사항을 따르기만 하면 됩니다. 지표는 지속적으로 시장 분석
Entry Points Pro for MT5
Yury Orlov
4.48 (138)
다시 색을 칠하지 않고 거래에 진입할 수 있는 정확한 신호를 제공하는 MT5용 지표입니다. 외환, 암호화폐, 금속, 주식, 지수 등 모든 금융 자산에 적용할 수 있습니다. 매우 정확한 추정값을 제공하고 매수와 매도의 가장 좋은 시점을 알려줍니다. 하나의 시그널로 수익을 내는 지표의 예와 함께 비디오 (6:22)시청하십시오! 대부분의 거래자는 Entry Points Pro 지표의 도움으로 첫 거래 주 동안 트레이딩 결과를 개선합니다. 저희의   Telegram Group 을 구독하세요! Entry Points Pro 지표의 좋은점. 재도색이 없는 진입 신호 신호가 나타나고 확인되면(시그널 캔들이 완성된 경우) 신호는 더 이상 사라지지 않습니다. 여타 보조지표의 경우 신호를 표시한 다음 제거되기 때문에 큰 재정적 손실로 이어집니다. 오류 없는 거래 게시 알고리즘을 통해 트레이드(진입 또는 청산)를 할 이상적인 순간을 찾을 수 있으며, 이를 통해 이를 사용하는 모든 거래자의 성공률이
Azimuth Pro
Ottaviano De Cicco
5 (7)
Azimuth Pro V2: Synthetic Fractal Structure and Confirmed Entries for MT5 Overview Azimuth Pro is a multi-level swing structure indicator by Merkava Labs . Four nested swing layers, swing-anchored VWAP, ABC pattern detection, three-timeframe structural filtering, and closed-bar confirmed entries — one chart, one workflow from micro-swings to macro-cycles. This is not a blind signal product. It is a structure-first workflow for traders who care about location, context, and timing. V2 Launch Offe
FX Trend MT5 NG
Daniel Stein
5 (4)
FX Trend NG: 차세대 멀티 마켓 트렌드 인텔리전스 개요 FX Trend NG 는 다중 시간 프레임 기반의 전문 트렌드 분석 및 시장 모니터링 도구입니다. 몇 초 만에 전체 시장 구조를 파악할 수 있도록 설계되었습니다. 여러 차트를 일일이 전환할 필요 없이, 어떤 종목이 추세에 있는지, 어디에서 모멘텀이 약화되고 있는지, 그리고 어떤 시간 프레임이 서로 정렬되어 있는지 즉시 확인할 수 있습니다. 출시 기념 특별 혜택 – FX Trend NG 를 $30 (6개월) 또는 $80 평생 라이선스 로 이용할 수 있습니다. 이미 Stein Investments 고객이신가요? -> 메시지를 보내 전용 고객 그룹에 참여하세요. 설정이나 사용 방법이 필요하신가요? -> Stein Investments 공식 페이지 를 방문하세요. 1. FX Trend NG가 특별한 이유 3단계 추세 로직 – 단순한 Buy / Sell이 아닙니다 • 대부분의 지표는 Buy 또는 Sell 두 가지 상태만 제
Meravith MT5
Ivan Stefanov
5 (1)
마켓 메이커를 위한 도구. Meravith는 다음과 같은 기능을 제공합니다: 모든 타임프레임을 분석하고 현재 유효한 추세를 표시합니다. 강세와 약세 거래량이 동일한 유동성 구간(거래량 균형 구간)을 강조 표시합니다. 서로 다른 타임프레임의 모든 유동성 레벨을 차트에 직접 표시합니다. 텍스트 기반 시장 분석을 생성하여 참고용으로 제공합니다. 현재 추세를 기반으로 목표가, 지지선 및 손절가를 계산합니다. 거래의 위험 대비 보상 비율(Risk/Reward)을 계산합니다. 계좌 잔고에 따라 포지션 크기를 산출하고 잠재 수익을 추정합니다. 시장에 중대한 변화가 발생할 경우 경고도 제공합니다. 지표의 주요 라인: 강세/약세 거래량 소진 라인 — 목표가로 사용됩니다. 시장 추세를 나타내는 라인. 시장이 강세인지 약세인지에 따라 색상이 변경되며 추세 지지선 역할을 합니다. 색상은 주로 시장 심리를 보여줍니다. 거래량 균형선(Eq). Eq(Volume Equilibrium) 라인은 시스템의 핵심입니
Btmm state engine pro
Garry James Goodchild
5 (4)
BTMM State Engine Pro is a MetaTrader 5 indicator for traders who use the Beat The Market Maker approach: Asian session context, kill zone timing, level progression, peak formation detection, and a multi-pair scanner from a single chart. It combines cycle state logic with a built-in scanner dashboard so you do not need the same tool on many charts at once. What it does Draws the Asian session range; session times can follow broker server offset or be set in inputs. Tracks level progression (L
Trend Screener Pro MT5
STE S.S.COMPANY
4.85 (104)
트렌드 표시기, 트렌드 트레이딩 및 필터링을 위한 획기적인 고유 솔루션, 하나의 도구 안에 내장된 모든 중요한 트렌드 기능! Forex, 상품, 암호 화폐, 지수 및 주식과 같은 모든 기호/도구에 사용할 수 있는 100% 다시 칠하지 않는 다중 시간 프레임 및 다중 통화 표시기입니다. Trend Screener는 차트에 점이 있는 화살표 추세 신호를 제공하는 효율적인 지표 추세 추종 지표입니다. 추세 분석기 표시기에서 사용할 수 있는 기능: 1. 트렌드 스캐너. 2. 최대 이익 분석이 있는 추세선. 3. 추세 통화 강도 측정기. 4. 경고가 있는 추세 반전 점. 5. 경고가 있는 강력한 추세 점. 6. 추세 화살표 Trend Screener Indicator가 있는 일일 분석 예, 일일 신호 성능...등은 여기에서 찾을 수 있습니다. 여기를 클릭하십시오. LIMITED TIME OFFER : Trend Screener Indicator는 50$ 및 평생 동안만 사용할 수 있습니다.
Atomic Analyst MT5
Issam Kassas
3.94 (31)
우선적으로 언급할 점은이 거래 지표가 다시 그리지 않고 지연되지 않으며 이를 통해 수동 및 로봇 거래 모두에 이상적이라는 점입니다. 사용자 매뉴얼: 설정, 입력 및 전략. Atomic Analyst는 가격의 강도와 모멘텀을 활용하여 시장에서 더 나은 이점을 찾는 PA Price Action Indicator입니다. 고급 필터를 장착하여 잡음과 거짓 신호를 제거하고 거래 잠재력을 높이는 데 도움이 됩니다. 복잡한 지표의 다중 레이어를 사용하여 Atomic Analyst는 차트를 스캔하고 복잡한 수학적 계산을 간단한 신호와 색상으로 변환하여 초보 트레이더가 이해하고 일관된 거래 결정을 내릴 수 있도록합니다. "Atomic Analyst"는 새로운 및 경험이 풍부한 트레이더를위한 종합적인 거래 솔루션입니다. 프리미엄 지표와 최고 수준의 기능을 하나의 거래 전략에 결합하여 모든 종류의 트레이더에 대한 다재다능한 선택지가되었습니다. 인트라데이 거래 및 스캘핑 전략 : 빠르고 정확한 일일
소개       Quantum Breakout PRO   , 브레이크아웃 존 거래 방식을 변화시키는 획기적인 MQL5 지표! 13년 이상의 거래 경험을 가진 숙련된 트레이더 팀이 개발한       퀀텀 브레이크아웃 PRO       혁신적이고 역동적인 브레이크아웃 존 전략으로 거래 여정을 새로운 차원으로 끌어올리도록 설계되었습니다. Quantum Breakout Indicator는 5개의 이익 목표 영역이 있는 브레이크아웃 영역의 신호 화살표와 브레이크아웃 상자를 기반으로 한 손절 제안을 제공합니다. 초보자 거래자와 전문 거래자 모두에게 적합합니다. Quantum EA 채널:       여기를 클릭하세요 중요한! 구매 후 설치 매뉴얼을 받으려면 개인 메시지를 보내주십시오. 추천: 기간: M15 통화쌍: GBPJPY, EURJPY, USDJPY,NZDUSD, XAUUSD 계정 유형: 스프레드가 매우 낮은 ECN, Raw 또는 Razor 브로커 시간: GMT +3 중개인 :
Bill Williams Advanced
Siarhei Vashchylka
5 (11)
Bill Williams Advanced is designed for automatic chart analysis using Bill Williams' "Profitunity" system. The indicator analyzes four timeframes at once. Manual (Be sure to read before purchasing) Advantages 1. Analyzes the chart using Bill Williams' "Profitunity" system. Signals are displayed in a table in the corner of the screen and on the price chart. 2. Finds all known AO and AC signals, as well as zone signals. Equipped with a trend filter based on the Alligator. 3. Finds "Divergence Bar
OmniSync Projection
Antonio-alin Teculescu
5 (1)
Chronos Fractal Engine is an innovative price projection indicator for MetaTrader 5, designed to transform your technical analysis by intelligently identifying and projecting historical price patterns. Built upon an advanced correlation algorithm and the fractal principles of the market, this powerful tool visualizes potential future price movements, giving you a unique edge in your trading decisions. What is Chronos Fractal Engine? At its core, the Chronos Fractal Engine employs a sophisticat
SMC Intraday Formula
Kareem Abbas
5 (4)
먼저 솔직하게 말하겠습니다. 어떤 인디케이터도 단독으로 당신을 수익성 있게 만들어주지 않습니다. 누군가 그렇게 말한다면, 그는 당신에게 꿈을 파는 것입니다. 완벽한 매수/매도 화살표를 보여주는 모든 인디케이터는 완벽하게 보이도록 만들 수 있습니다 — 단지 올바른 과거 구간을 확대하고 승리한 거래만 캡처하면 됩니다. 우리는 그렇게 하지 않습니다.  SMC Intraday Formula는 도구입니다. 시장 구조를 읽고, 가장 높은 확률의 가격 구간을 표시하며, 현재 스마트 머니의 흐름이 어떻게 보이는지 아주 단순한 언어로 보여줍니다. 최종 결정은 여전히 당신이 합니다. 실행도 당신이 합니다. 하지만 이제는 희망이 아니라 정확성으로 거래하게 됩니다. 우리는 이 인디케이터를 지난 약 3년 동안 골드(XAUUSD) 및 주요 외환 통화쌍의 데이 트레이딩 스캘핑에 사용해 왔습니다. M1, M5, M15, M30에서 우리의 핵심 도구입니다. 이 도구는 미래를 예측하려 하지 않습니다 — 지금 형성
FX Power MT5 NG
Daniel Stein
5 (31)
FX Power: 통화 강세 분석으로 더 스마트한 거래 결정을 개요 FX Power 는 어떤 시장 상황에서도 주요 통화와 금의 실제 강세를 이해하기 위한 필수 도구입니다. 강한 통화를 매수하고 약한 통화를 매도함으로써 FX Power 는 거래 결정을 단순화하고 높은 확률의 기회를 발견합니다. 트렌드를 따르거나 극단적인 델타 값을 사용해 반전을 예측하고자 한다면, 이 도구는 귀하의 거래 스타일에 완벽히 적응합니다. 단순히 거래하지 말고, FX Power 로 더 스마트하게 거래하세요. 1. FX Power가 거래자에게 매우 유용한 이유 통화와 금의 실시간 강세 분석 • FX Power 는 주요 통화와 금의 상대적 강세를 계산하고 표시하여 시장 역학에 대한 명확한 통찰력을 제공합니다. • 어떤 자산이 앞서고 있고 어떤 자산이 뒤처지는지 모니터링하여 보다 현명한 거래 결정을 내릴 수 있습니다. 포괄적인 멀티 타임프레임 뷰 • 단기, 중기 및 장기 타임프레임에서 통화와 금의 강세를
Crystal Heikin Ashi Signals
Muhammad Jawad Shabir
5 (2)
Crystal Heikin Ashi Signals - Professional Trend & Signal Detection Indicator Advanced Heikin Ashi Visualization with Intelligent Signal System for Manual & Automated Trading Final Price: $149 ---------> Price goes up $10 after every 10 sales . Limited slots available — act fast . Overview Crystal Heikin Ashi Signals is a professional-grade MetaTrader 5 indicator that combines pure Heikin Ashi candle visualization with an advanced momentum-shift detection system. Designed for both manual traders
Trend indicator AI mt5
Ramil Minniakhmetov
5 (17)
트렌드 인공 지능 지표는 실행 가능한 진입 점 및 반전 경고와 추세 식별을 결합하여 상인의 시장 분석을 향상시킬 훌륭한 도구입니다. 이 표시기는 사용자가 자신감과 정밀도로 외환 시장의 복잡성을 탐색 할 수 있도록 지원합니다 기본 신호 외에도 트렌드 인공 지능 지표는 풀백 또는 되돌림 중에 발생하는 2 차 진입 점을 식별하여 거래자가 기존 트렌드 내에서 가격 수정을 활용할 수 있도록합니다. 중요한 장점: ·작동 4 및 5 *명확한 구매 또는 판매 신호 *다시 칠하지 않습니다 *모든 자산에서 작동 나는 전보 사기에 개 또는 세트를 판매하지 않도록주의. 모든 설정은 블로그에 여기에 무료.  중요! 지침 및 보너스를 얻기 위해 구입 후 즉시 저에게 연락! 진짜 가동 감시는 뿐 아니라 나의 다른 제품 여기에서 찾아낼 수 있습니다: https://www.mql5.com/en/users/mechanic/seller&nbsp ; 설정 및 입력: 모든 자산에 대해 기본 설정을 권
Market Structure Order Block Dashboard MT5는 시장 구조와 주요 가격 반응 구역을 차트에서 직접 읽고자 하는 트레이더를 위해 설계된 MT5 지표입니다. BOS, ChoCH, 오더 블록, Fair Value Gap (FVG), 유동성, Kill Zones, Volume Profile 그리고 빠른 분석을 위한 콤팩트한 대시보드를 결합합니다. 이 지표는 시장 구조, ICT 및 Smart Money 개념을 의사결정 프레임워크로 사용하는 트레이더를 대상으로 합니다. 추세 지속, 가능한 반전, 가격 불균형, 유동성 타겟 및 관심 구역을 보다 체계적으로 식별하는 데 도움을 줄 수 있습니다. 구매자를 위한 포함 리소스 구매 후 MQL5 개인 메시지로 요청하시면 완전한 PDF 사용 설명서와 파라미터 설정 팁을 제공해 드립니다. MQL5 개인 메시지를 통한 직접 기술 지원. 1.20 버전은 두 가지 주요 추가 기능을 제공합니다: Pending BOS / Pending
Power Bar MT5
Daniel Stein
실제 자금을 투입하기 전에 어떤 전략이 내 심볼에서 효과적인지 확인하세요. Power Bar는 모든 심볼과 모든 타임프레임에서 극단적인 가격 바 를 감지한 다음, 3가지 다른 트레이딩 전략을 즉시 백테스트하여 승률, 수익 팩터, 손익을 나란히 비교할 수 있습니다. 모든 것이 하나의 인터랙티브 패널에 담겨 있습니다. 추측 없음. 커브 피팅 없음. 오직 데이터뿐입니다. Power Bar가 특별한 이유 대부분의 인디케이터는 신호를 주고 그것이 효과가 있는지는 추측에 맡깁니다. Power Bar는 한 걸음 더 나아갑니다 - 모든 신호를 세 가지 전략 에 대해 테스트하고 통계를 보여줍니다. FlipFlop, Momentum, Reversal을 원클릭으로 전환하고 숫자가 즉시 변하는 것을 확인하세요. FlipFlop - 항상 포지션 유지. 신호에 진입하고, 반대 신호에 청산. 당사의 연구에 따르면 US30, US500, DAX와 같은 추세가 있는 지수에서 가장 효과적입니다. Momentum
FX Levels MT5
Daniel Stein
5 (13)
FX Levels: 모든 시장을 위한 뛰어난 정확도의 지지와 저항 간단 요약 통화쌍, 지수, 주식, 원자재 등 어떤 시장이든 믿을 만한 지지·저항 레벨을 찾고 싶나요? FX Levels 는 전통적인 “Lighthouse” 기법과 첨단 동적 접근을 결합해, 거의 보편적인 정확성을 제공합니다. 실제 브로커 경험을 반영하고, 자동화된 일별 업데이트와 실시간 업데이트를 결합함으로써 FX Levels 는 가격 반전 포인트를 파악하고, 수익 목표를 설정하며, 자신 있게 트레이드를 관리할 수 있게 돕습니다. 지금 바로 시도해 보세요—정교한 지지/저항 분석이 어떻게 여러분의 트레이딩을 한 단계 끌어올릴 수 있는지 직접 확인하세요! 1. FX Levels가 트레이더에게 매우 유용한 이유 뛰어난 정확도의 지지·저항 존 • FX Levels 는 다양한 브로커 환경에서도 거의 동일한 존을 생성하도록 설계되어, 데이터 피드나 시간 설정 차이로 인한 불일치를 해소합니다. • 즉, 어떤 브로커를 사용하
Gartley Hunter Multi
Siarhei Vashchylka
5 (11)
Gartley Hunter Multi - An indicator for searching for harmonic patterns simultaneously on dozens of trading instruments and on all possible timeframes. Manual (Be sure to read before purchasing) | Version for MT4 Advantages 1. Patterns: Gartley, Butterfly, Shark, Crab. Bat, Alternate Bat, Deep Crab, Cypher 2. Simultaneous search for patterns on dozens of trading instruments and on all possible timeframes 3. Search for patterns of all possible sizes. From the smallest to the largest 4. All fou
Basic Harmonic Patterns Dashboard MT5
Mehran Sepah Mansoor
4.36 (11)
이 대시보드는 선택한 심볼에 대해 사용 가능한 최신 고조파 패턴을 표시하므로 시간을 절약하고 더 효율적으로 사용할 수 있습니다 /   MT4 버전 . 무료 인디케이터:   Basic Harmonic Pattern 인디케이터 열 Symbol :   선택한 심볼이 나타납니다 Trend :   강세 또는 약세 Pattern :   패턴 유형(가틀리, 나비, 박쥐, 게, 상어, 사이퍼 또는 ABCD) Entry :   진입 가격 SL:   스톱로스 가격 TP1:   1차 테이크프로핏 가격 TP2:   2차 테이크프로핏 가격 TP3:   3차 테이크프로핏 가격 Current price:   현재 가격 Age (in bars):   마지막으로 그려진 패턴의 나이 주요 입력 Symbols :   "28개 주요 통화쌍" 또는 "선택한 심볼" 중에서 선택합니다. Selected Symbols :   쉼표로 구분하여 모니터링하려는 원하는 심볼("EURUSD,GBPUSD,XAUUSD")을 선택
제작자의 제품 더 보기
Trend Trader Indicator
Leonardo Daniel Isaia
Trend Trader – 매수/매도 신호 및 추세 설명: Trend Trader는 이동평균선, MACD, ADX를 사용하여 시장 강도를 평가하고, 추세 분석과 명확한 매수/매도 신호를 결합합니다. MetaTrader 5용 이 지표는 추세 방향을 표시하고, 강세 및 약세 시점을 식별하며, 주요 교차점을 시각적으로 강조하여 거래 진입 및 청산을 최적화합니다. 주요 기능 자동 매수/매도 신호: 추세 강도 및 MACD + ADX 교차를 기반으로 기회 아이콘 표시 완전히 맞춤 설정 가능: MACD, ADX, EMA 기간, 색상 및 신호 활성화 사용 방법 추세 따르기: 녹색 막대 = 강세, 빨간색 막대 = 약세 신호 기반 거래: Buy/Sell 아이콘이 추천 진입점 표시 MA 리본으로 확인: 단기 및 장기 추세 정렬 시 신호 신뢰도 증가 ADX 필터링: ADX가 충분한 강도를 표시할 때만 신호 활성화 (>25) 실제 예시 녹색 막대 + Buy 신호 → 강한 강세 진입 시점 빨간색 막대 +
FREE
Andean Oscillator
Leonardo Daniel Isaia
Andean Oscillator – 추세 변동 오실레이터 시장 강도와 방향을 명확하게 보여줍니다. Andean Oscillator 는 각 자산의 상승 및 하락 변동을 측정하는 고급 오실레이터 로, 주요 구성 요소인 Bull(상승) , Bear(하락) 및 신호를 필터링하고 추세를 확인하는 Signal Line 을 포함합니다. 지수 엔벨로프 와 이동 평균을 사용하여 Andean Oscillator는 추세 강도와 가능한 변화를 명확하고 안정적으로 제공하여 거래에서 유리하게 활용할 수 있습니다. 주요 특징 Bull과 Bear 구성 요소: 가격의 상승 및 하락 변동을 반영. 신호선: 잘못된 신호를 필터링하고 추세를 확인. 간단한 해석: 상승 구성 요소가 하락을 초과 → 상승 추세, 하락 구성 요소가 상승을 초과 → 하락 추세. 반응형 오실레이터: 최대 반응성을 위해 지수 엔벨로프와 이동 평균 기반 계산. 모든 자산과 타임프레임에 호환 가능. 사용 방법 추세 식별: Bull > Bear → 시
FREE
Matrix Series Oscillator
Leonardo Daniel Isaia
Matrix Series – サポート、レジスタンス&モメンタム指標 重要なサポート/レジスタンスゾーン、買われすぎ/売られすぎレベル、市場の強さを1つの指標で表示します。 Matrix Series は、 動的CCI 、平滑化移動平均、標準偏差バンドを組み合わせ、市場の方向性と重要なレベルを明確に示します。ローソク足は強気・弱気圧力に応じて色付けされ、動的サポート/レジスタンスゾーンには買われすぎ/売られすぎの視覚アラートが表示されます。 主な特徴 トレンドに応じたローソク足の色: 緑=強気、赤=弱気 サポートとレジスタンスゾーン: CCIの設定可能な期間で動的に計算 買われすぎ/売られすぎインジケーター: 視覚的アラートで極端な状態を検出 分かりやすい解釈: ローソク足の方向とゾーンとの相互作用で市場の強さを表示 完全にカスタマイズ可能: 期間、平滑化、OB/OSレベル、ゾーン表示 使い方 トレンドの識別: 緑のローソク足 → 強気; 赤のローソク足 → 弱気 サポート/レジスタンスでのトレード: 価格の動的ゾーンとの相互作用を監視し、エントリー/エグジットに活用 OB/OSでの
FREE
FOTSI Indicator
Leonardo Daniel Isaia
1 (1)
FOTSI – 외환 진정 강도 지수 개요 각 통화의 진정한 강도를 발견하고 우위를 가지고 거래하세요. FOTSI 지표 는 모든 주요 통화(USD, EUR, GBP, JPY, CHF, AUD, CAD, NZD)의 실제 모멘텀을 모든 통화쌍에서 측정하는 다중 통화 오실레이터 입니다. 단일 차트를 분석하는 대신, FOTSI는 여러 통화쌍의 데이터를 결합하고 움직임을 평활화하며, True Strength Index (TSI) 알고리즘을 적용하여 각 통화의 상대적 강도를 명확하고 안정적이며 지연 없이 제공합니다. 주요 특징 다중 통화 오실레이터: 각 통화의 강도를 독립적으로 측정합니다. 과매수 및 과매도 수준: +50 → 통화 과매수 (조정 확률 높음). –50 → 통화 과매도. ±25 → 중립 영역. 간단한 해석: 0 이상/이하 곡선 = 강도/약점. 리페인트 없음: 모든 계산은 실시간으로 수행되며 안정적입니다. 모든 통화쌍과 시간 프레임에서 호환: 신뢰성을 위해 H1, H4, D1 권장.
BRA EA Bollinger Rsi Adx
Leonardo Daniel Isaia
Bollinger RSI ADX V3 - 전문 트레이딩 솔루션 Bollinger RSI ADX V3 는 MetaTrader 5용으로 설계된 정교하고 높은 수준의 사용자 정의가 가능한 전문가 고문(EA)으로, 볼린저 밴드, 상대 강도 지수(RSI), 평균 방향 지수(ADX)의 강력한 기능을 활용하여 정확하고 전략적인 트레이딩 결정을 제공합니다. 이 EA는 고급 리스크 관리, 유연한 트레이딩 설정, 다양한 시장 조건에서 성과를 최적화하기 위한 시간 기반 필터를 갖춘 견고한 자동 트레이딩 시스템을 찾는 트레이더에게 이상적입니다. 주요 기능 고급 트레이딩 로직 다중 지표 전략 : 볼린저 밴드, RSI, ADX를 결합하여 정확한 진입 신호를 제공합니다. 매수 신호 : 가격이 볼린저 밴드 하단에 닿거나 그 아래로 떨어지고, RSI가 과매도 상태를 나타내며, ADX가 강한 추세를 확인할 때 발동됩니다. 매도 신호 : 가격이 볼린저 밴드 상단에 닿거나 그 위로 올라가고, RSI가 과매수 상태를 나
ZAR Wave
Leonardo Daniel Isaia
ZAR Wave EA 시장의 파도를 ZAR Wave EA로 정복하세요. ZAR Wave EA는 MetaTrader 5용으로 설계된 최첨단 완전 자동 전문가 고문(EA)으로, Serghey Magalà 가 개발하고 소유한 FOTSI(Forex Overview True Strength Index) 지표의 힘을 활용하여 정교한 다중 통화 거래 전략을 제공합니다. 이 EA는 FOTSI의 고급 통화 강도 분석과 **지수 이동 평균(EMA)**을 결합하여 28개 주요 외환 통화 쌍에서 정확하고 효율적으로 거래합니다. 강력한 리스크 관리, 사용자 지정 가능한 로트 크기, 지능형 거래 실행을 갖춘 ZAR Wave EA는 트레이더가 자신 있게 외환 시장을 정복할 수 있도록 지원합니다. 주요 기능 다중 통화 거래 : EURUSD, GBPUSD, USDJPY, AUDUSD 등 28개 외환 쌍을 원활하게 거래하여 포트폴리오 다각화를 쉽게 실현합니다. FOTSI 기반 전략 : Serghey Magalà의
TimeRangeTrading TRT
Leonardo Daniel Isaia
Time Range Trading EA v4.2 - MQL5 마켓 설명 개요 Time Range Trading EA v4.2 는 MetaTrader 5용으로 설계된 고급이고 고도로 사용자 정의 가능한 전문가 고문(EA)으로, 지정된 시간 범위 내의 가격 움직임에서 수익을 창출할 수 있도록 합니다. 이 EA는 특히 US30, DAX, NASDAQ과 같은 트렌드 자산 거래에 탁월하며, 고급 기술 분석과 강력한 거래 관리 기능을 활용합니다. 이동 평균과 일목균형표 필터, 일일 거래 제한, 동적 손절매 추적 기능을 갖추고 있어 트렌드 시장에서 범위 기반 전략을 위한 안정적인 자동화 솔루션을 찾는 트레이더에게 이상적입니다. 주요 기능 시간 범위 기반 거래 : 사용자가 정의한 시간 범위 내에서 자동으로 식별하고 거래하여 가격 돌파 또는 반전을 포착하며, 인덱스와 같은 트렌드 자산에 최적화되어 있습니다. 유연한 거래 스타일 : 시장 조건에 따라 돌파(With_Break) 또는 평균 회귀(Oppo
HASH ExpertAdvisor
Leonardo Daniel Isaia
HASH EA - Estrategia Profesional con Heiken Ashi Smoothed y Gestión de Riesgo Avanzada ¡Domina el mercado con precisión y control! El HASH EA es un Expert Advisor (EA) totalmente automatizado y listo para el mercado real, diseñado para traders exigentes que buscan señales claras, filtros robustos y una gestión de riesgo impecable. Basado en la potente combinación de Heiken Ashi Smoothed (descargable gratis desde el Mercado MQL5), EMA de tendencia, ADX opcional y ATR dinámico, este EA opera en cu
필터:
리뷰 없음
리뷰 답변