
Self-testable and self-optimizable indicator Matreshka Part 1.1
1.3 Lvl and LvlCoefficient - the parameters responsible for the grouping of waves and wave construction of a senior(Lvl), up to the last level (Lvl),as well as the Trend of each level. Trend Up - the case when the minimum of the next wave up is above the minimum of the previous wave up.
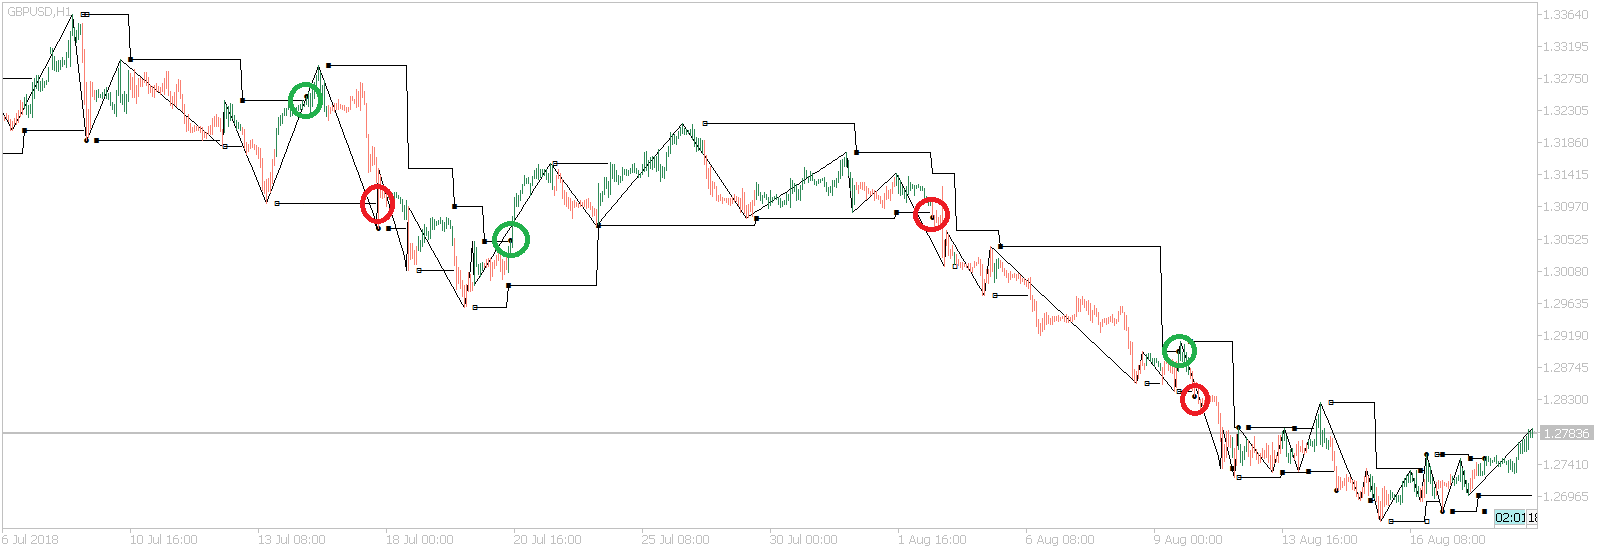
The beginning of the upward trend is indicated by green circles, the downward trend is marked in red
Level parameter - Lvl = 0 . ZigZag Level 0 is built. ZigZag Trend Level 0 is being built on top of it - the line is dotted.
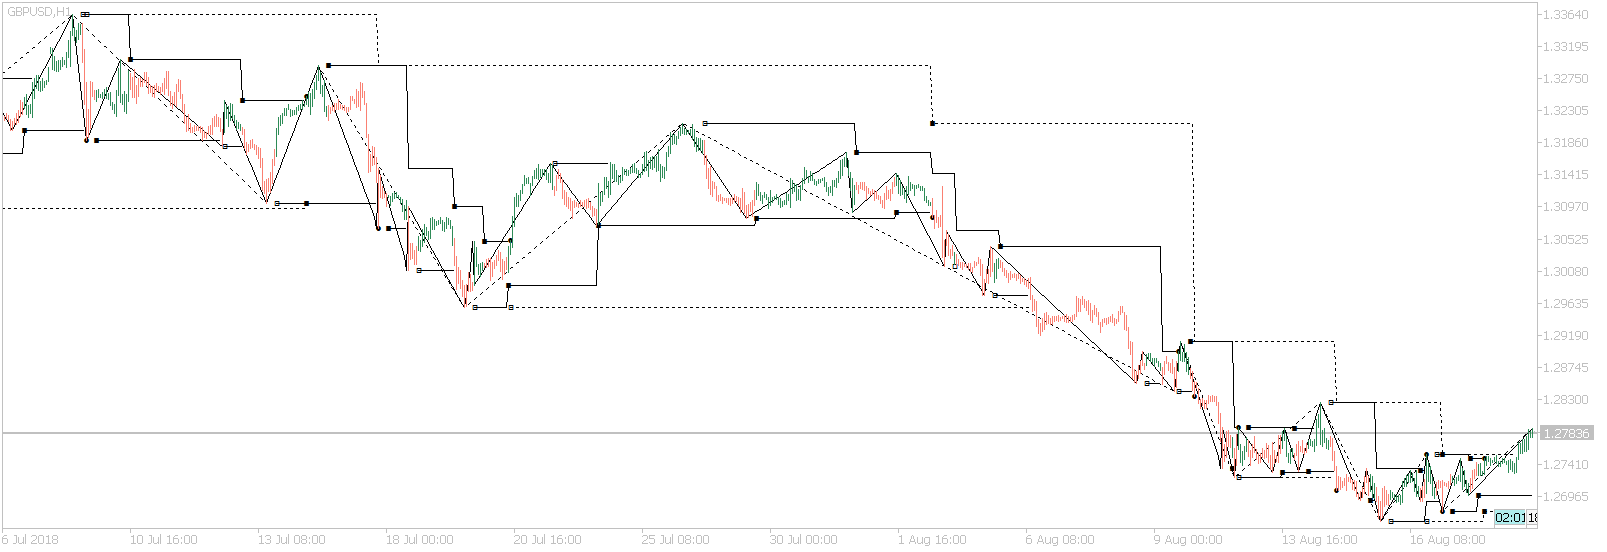
If Lvl > 0, then another ZigZag is built on top of the Black ZigZag - on the same principle but with different parameters:
DemarkPeriod (Lvl) = DemarkPeriod * ( LvlCoefficient * (2 ^ lvl))
HeightCoefficient (Lvl) = HeightCoefficient * ( LvlCoefficient * (2 ^ lvl))
For example, if specified in the indicator DemarkPeriod = 5 and HeightCoefficient = 2, then for ZigZag-a Lvl = 1 and LvlCoefficient = 1 these parameters will be
DemarkPeriod ( 1 ) = 5 * ( 1 * (2 ^ 1) = 10
HeightCoefficient ( 1 ) = 2 * ( 1 * (2 ^ 1) = 4
Below are examples with different indicator parameters:
Parameters DemarkPeriod = 5; HeightCoefficient = 2; Lvl = 1; LvlCoefficient = 1; The trend waves can be seen - Lvl = 1 down (red dotted line), with Lvl = 1 waves (red), with a Trend waves Lvl = 0 up and down (black dotted line), with Lvl = 0 black waves. Since the parameter Lvl = 1, in this example Last Level ( Lvl ) is Lvl = 1;
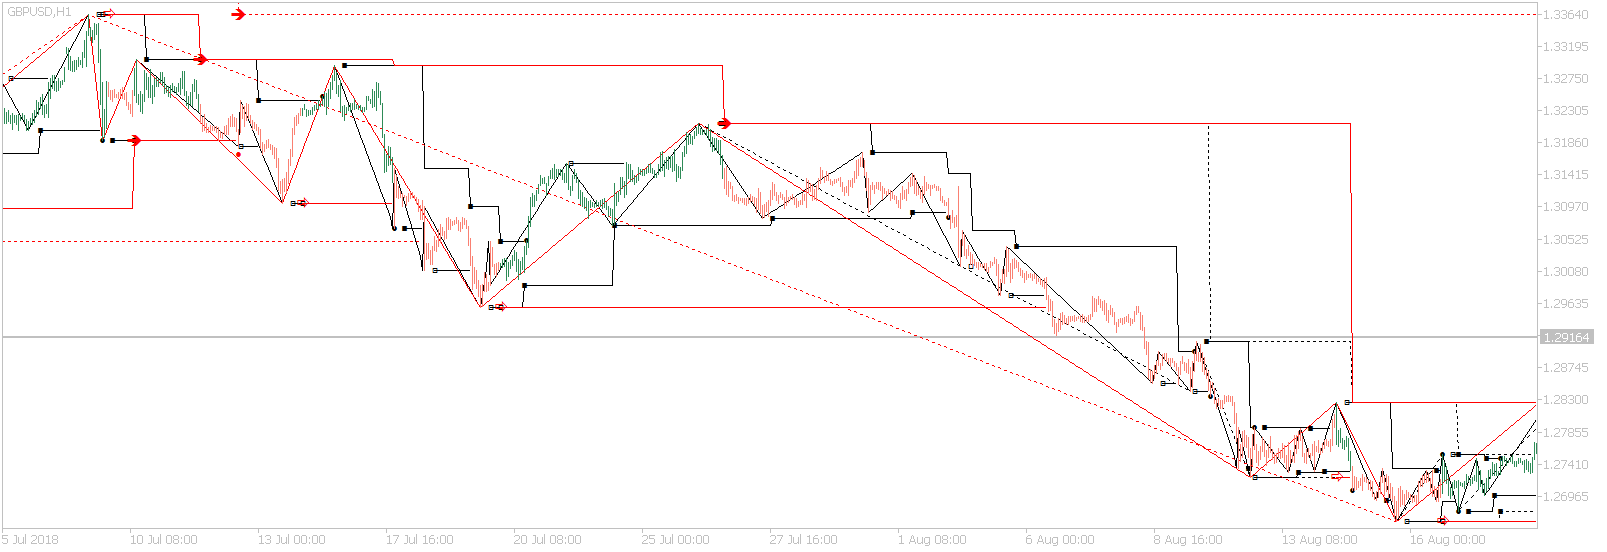
This is the indicator with the parameters DemarkPeriod = 5; HeightCoefficient = 2; Lvl = 5 ; LvlCoefficient = 1;
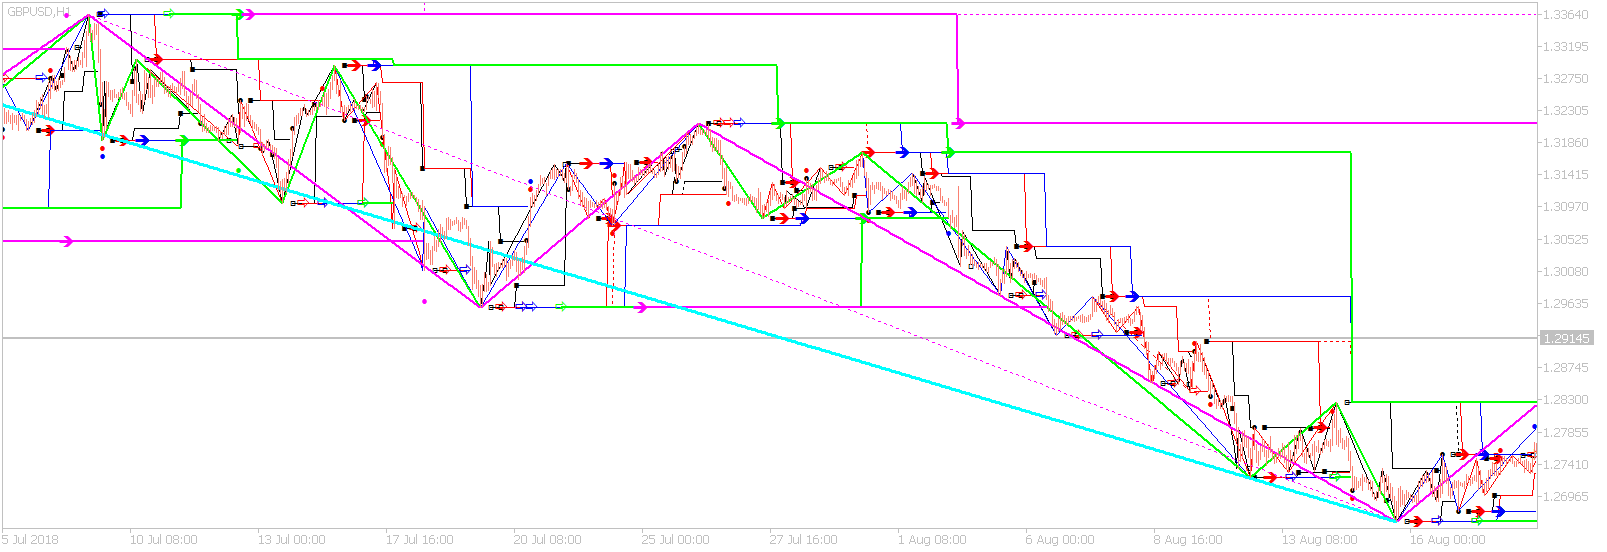
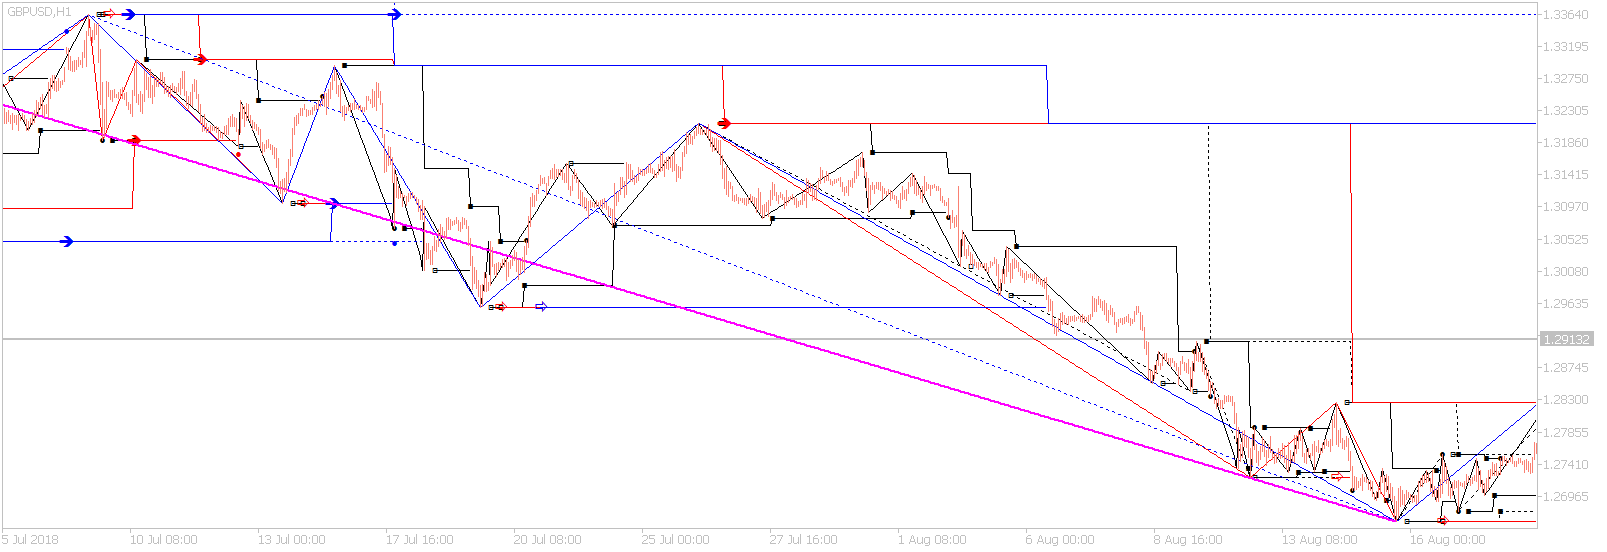
This is the indicator with the parameters DemarkPeriod = 5; HeightCoefficient = 0.5 ; Lvl = 5 ; LvlCoefficient = 1; The last Level in this example is Lvl = 5
Rollback Wave Index
The waves in the trend are two types - Trend Waves and Rollback Waves. The trend waves have odd order numbers - first, third, fifth, etc. , Rollback have even numbers - second, fourth, sixth, etc. On the chart below you can see arrows indicating the beginning of the Rollback waves, moment when starts a wave in the direction of the Trend.
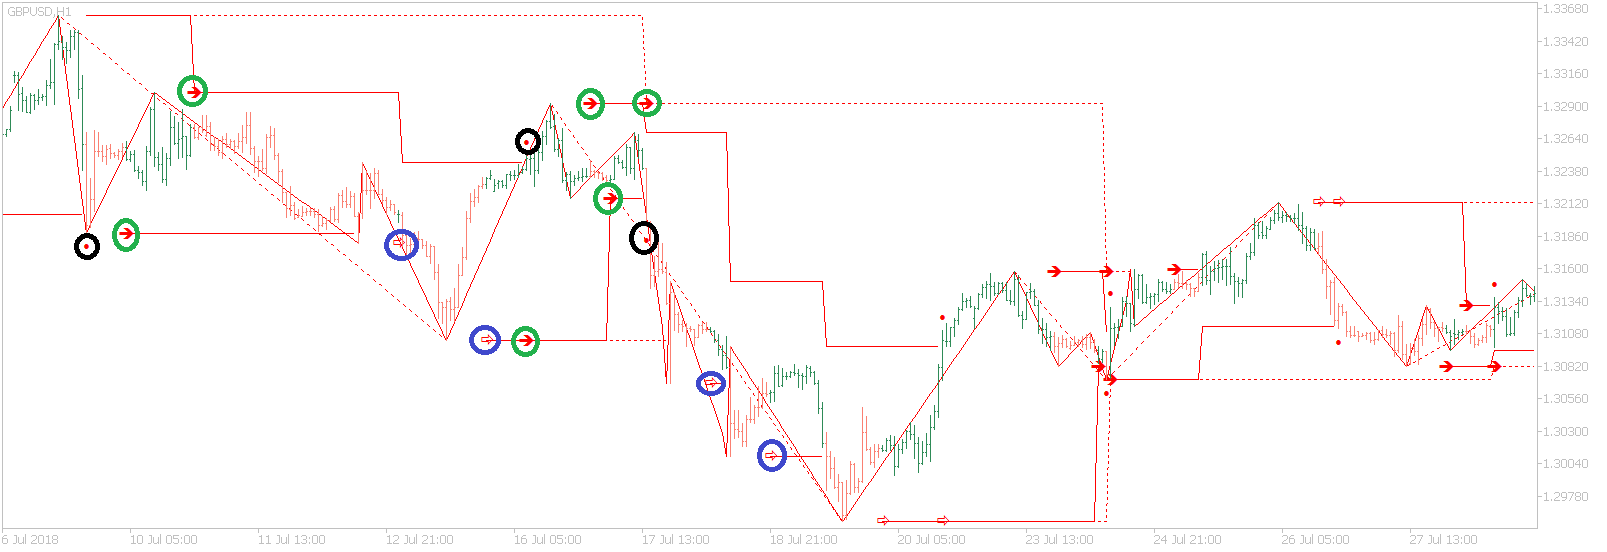
The indicator assumes that each wave can be a Wave A or the First Wave against the Trend. At its completion, a potential B or Second Wave begins.
The red dots on the chart (marked with black circles in the example) show the beginning of the Trend in one direction or another. The right arrows show the beginning of the Rollback (or B wave). Arrows above the price indicate the beginning of potential B wave in the upward movement, which can beacome a trend up.rrow below the chart - the beginning of the potential B waves in a downward motion. If the wave is the second in a row, the arrow is opaque (surrounded by green circles in the example). If the wave index is forth, sixth, eighth, etc. translucent arrow (surrounded by blue circles in the example). For visual convenience, the arrows for Level ( Lvl ) 0 are replaced by dots.
To be continued.
The indicator is published on the market https://www.mql5.com/en/market/product/33478


")
")