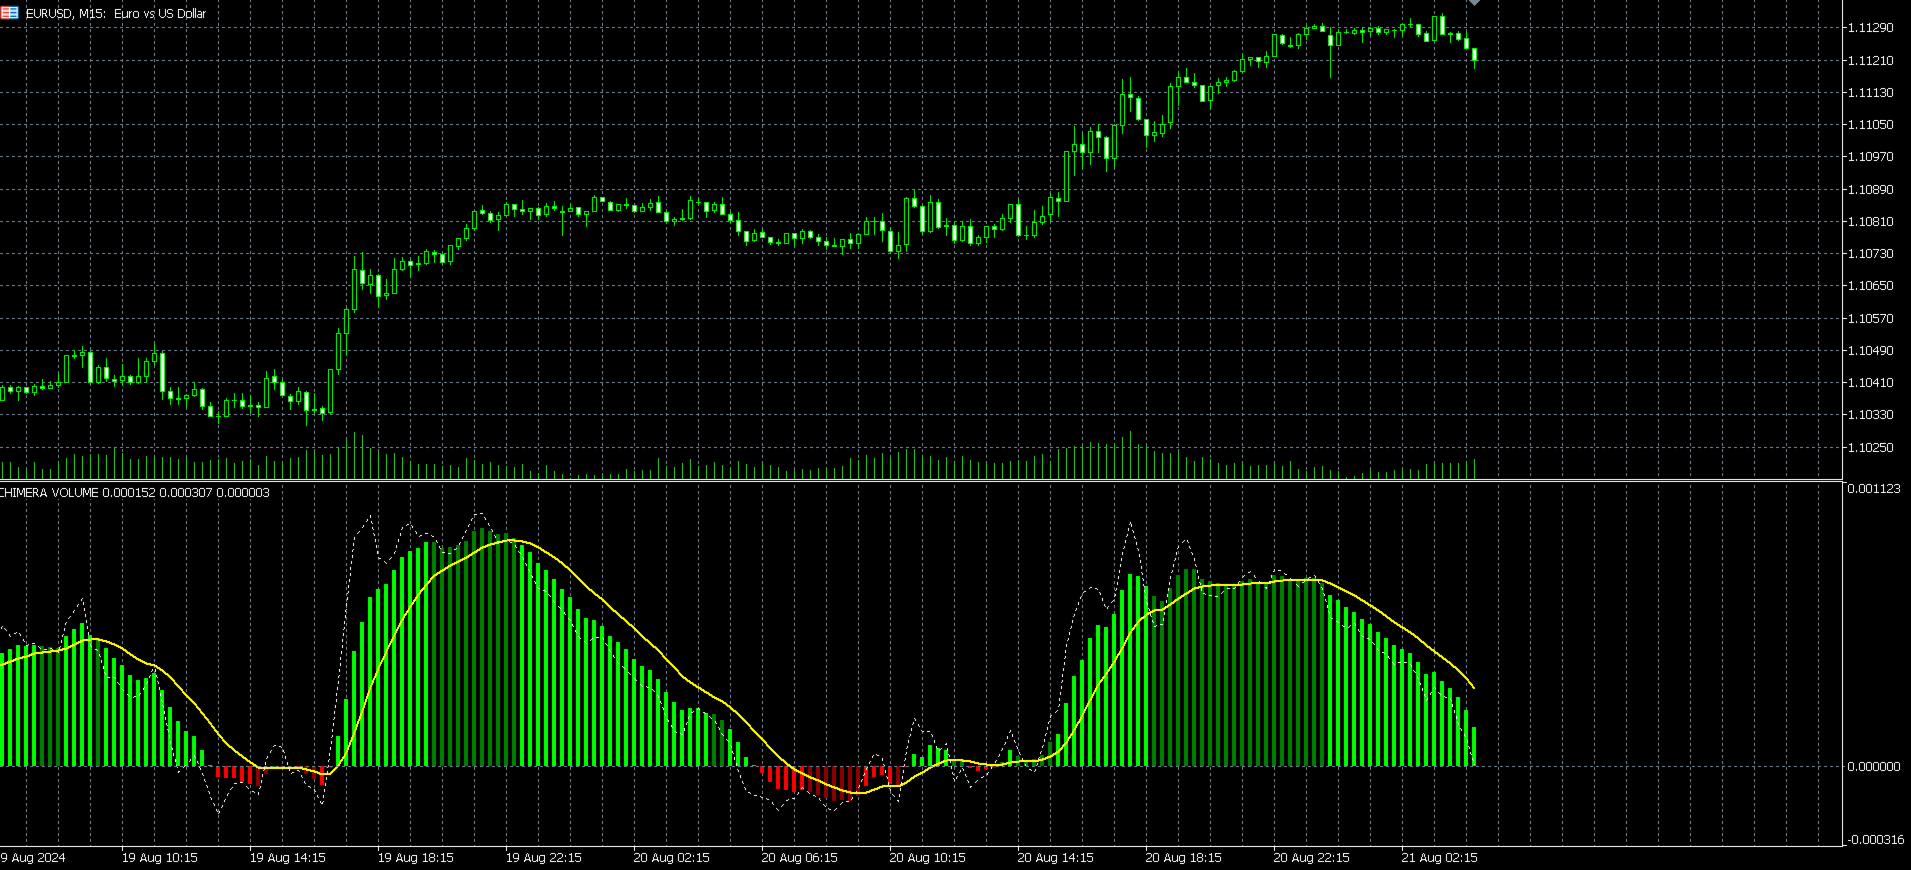
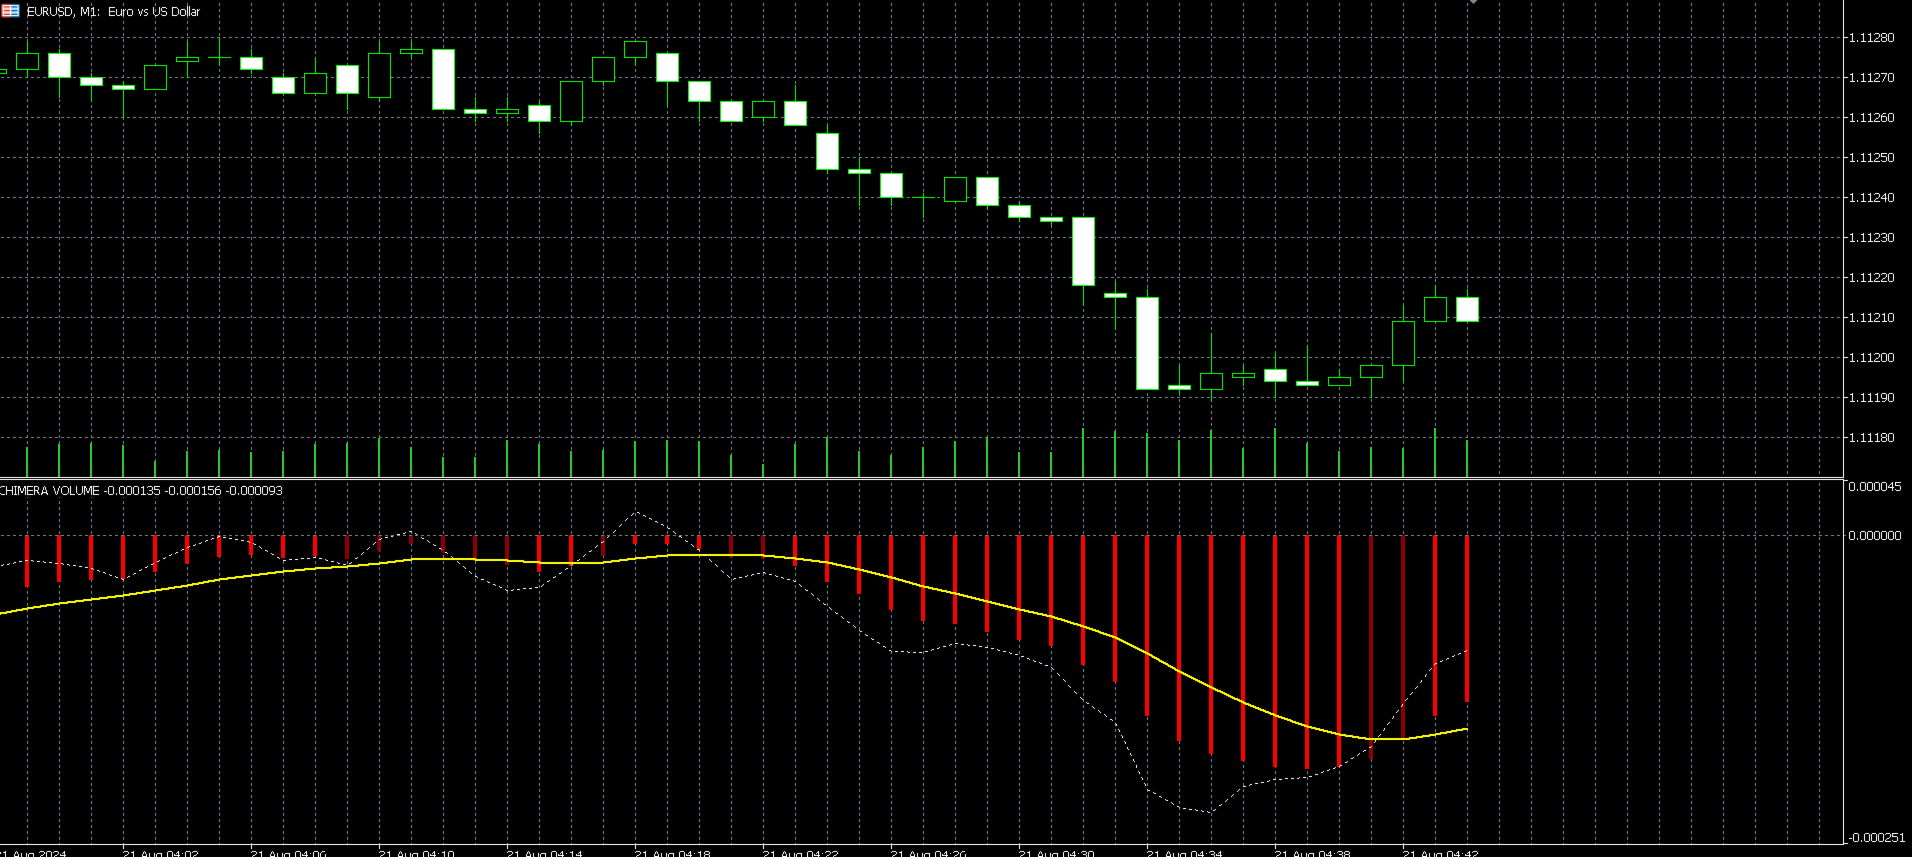
Chimera Volume

以下は Chimera Volume の日本語訳です。

MetaTrader 5用 Chimera Volume

高度な出来高分析と市場活動の可視化

Chimera Volumeは、MetaTrader 5向けに設計されたカスタムインジケーターです。正規化された出来高の動きを分析し、動的な視覚的フレームワークを通じて市場参加者の変化をリアルタイムで表示します。

このインジケーターは、適応型正規化アルゴリズムを用いてティック出来高データを処理し、出来高の強さ、蓄積フェーズ、および異なる市場条件下での活動シフトを構造化して表現します。

生の出来高を表示する標準的なインジケーターとは異なり、Chimera Volumeは追加の計算を適用することで、市場活動の相対的な変化を強調し、チャートの視認性を向上させます。

主な機能

  • ルート・インテント・ヒストグラム (Root Intent Histogram): 正規化された出来高の強さと市場参加度を視覚化する動的ヒストグラムです。適応型カラー・トランジションを採用しており、活動の活発化と参加の減少を明確に区別します。

  • 慣性ライン (Inertia Line): 正規化された出来高計算から導き出される滑らかな分析ラインです。出来高のモメンタムの変化を観察し、拡大・収縮フェーズ間の遷移を監視するために設計されています。

  • シグナルライン (Signal Line): 短期および長期の出来高の挙動を比較するための二次計算レイヤーです。市場状況を評価する際の追加の参照値として利用できます。

  • 適応型出来高処理: 市場のボラティリティや現在の出来高状況に応じて、内部計算を自動的に調整します。これにより、異なるシンボルやタイムフレーム全体で一貫した可視化を維持します。

主な利点

  • リペイントなし: 過去のデータが書き換わることはありません。

  • リアルタイム分析: リアルタイムでの出来高分析を提供。

  • クリーンで軽量: インターフェースはシンプルかつ軽量です。

  • 幅広い対応: Forex、指数、コモディティ、暗号資産に対応。

  • マルチタイムフレーム対応: 複数の時間枠で利用可能。

  • 低リソース消費: システムへの負荷を最小限に抑えます。

使用方法

Chimera Volumeは、既存のトレーディング手法を補完する分析ツールとして活用できます。本インジケーターは売買シグナルを生成するものではなく、金融助言を提供するものでもありません。ユーザーは本インジケーターの情報を自身の市場分析やリスク管理手順と組み合わせて使用してください。

インストール手順

  1. インジケーターをダウンロードします。

  2. MetaTrader 5にインストールします。

  3. 任意のチャートに適用します。

  4. 好みに合わせてパラメーターを調整します。

体験版について

購入前にテストできる無料のデモ版を用意しています。実際の取引で使用する前に、必ずデモ口座でインジケーターの性能を評価してください。

おすすめのプロダクト
インディケータは現在のクオートを作成し、これを過去のものと比較して、これに基づいて価格変動予測を行います。インジケータには、目的の日付にすばやく移動するためのテキスト フィールドがあります。 オプション: シンボル - インジケーターが表示するシンボルの選択; SymbolPeriod - 指標がデータを取る期間の選択; IndicatorColor - インジケータの色; HorisontalShift - 指定されたバー数だけインディケータによって描画されたクオートのシフト; Inverse - true は引用符を逆にします。false - 元のビュー。 ChartVerticalShiftStep - チャートを垂直方向にシフトします (キーボードの上下矢印)。 次は日付を入力できるテキストフィールドの設定で、「Enter」を押すとすぐにジャンプできます。
Was: $249  Now: $99   Market Profile defines a number of day types that can help the trader to determine market behaviour. A key feature is the Value Area, representing the range of price action where 70% of trading took place. Understanding the Value Area can give traders valuable insight into market direction and establish the higher odds trade. It is an excellent addition to any system you may be using. Inspired by Jim Dalton’s book “Mind Over Markets”, this indicator is designed to suit the
プレミアムレベルは、正しい予測の精度が80%を超える独自の指標です。 この指標は、最高のトレーディングスペシャリストによって2か月以上テストされています。 あなたが他のどこにも見つけられない作者の指標! スクリーンショットから、このツールの正確さを自分で確認できます。 1は、1キャンドルの有効期限を持つバイナリーオプションの取引に最適です。 2はすべての通貨ペア、株式、商品、暗号通貨で機能します 手順: 赤い矢印が表示されたらすぐにダウントレードを開き、青い矢印が表示されたら閉じます。青い矢印の後に開くこともできます。 試してテストしてください!推奨設定はデフォルトです! 日足チャートで最高の精度を示します! インディケータは、2600 Pipsの収益性に対して、約10Pipsという非常に小さなマージンを使用します。
The market is unfair if only because 10% of participants manage 90% of funds. An ordinary trader has slim changes to stand against these "vultures". This problem can be solved. You just need to be among these 10%, learn to predict their intentions and move with them. Volume is the only preemptive factor that faultlessly works on any timeframe and symbol. First, the volume appears and is accumulated, and only then the price moves. The price moves from one volume to another. Areas of volume accumu
Noize Absorption Index - is the manual trading system that measures the difference of pressure between bears forces and bulls forces. Green line - is a noize free index that showing curent situation. Zero value of index shows totally choppy/flat market.Values above zero level shows how powerfull bullish wave is and values below zero measures bearish forces.Up arrow appears on bearish market when it's ready to reverse, dn arrow appears on weak bullish market, as a result of reverse expectation.
重要なお知らせ – ライセンスとアクティベーションが必要です ======================================================== アクティベーション手順: ご購入完了後、直ちに当社までご連絡いただき、ライセンスキー、パスワード、またはアクティベーション詳細をお受け取りください。これらがないとソフトウェアは動作しません。スムーズなアクティベーションプロセスを保証し、ご質問にお答えいたします。 --- Volume Delta Profile V2 Enhanced ================================ プロフェッショナルな出来高・デルタ分析ツール -------------------------------------------- 概要 ---- **Volume Delta Profile** は、従来の出来高プロファイル分析と高度なデルタおよびインバランス検出を組み合わせたプロフェッショナルグレードの分析ツールです。この総合的なインジケーターは、トレーダーに市場ダイナミクスの詳細なビュ
インジケーター技術仕様 – Delta Profile for MetaTrader 5 Delta Profile は MetaTrader 5 用に開発されたインジケーターで、指定されたローソク足範囲内の出来高フローを詳細に分析するためのものです。異なる価格レベルにおける正の出来高(上昇に関連)と負の出来高(下降に関連)の不均衡を構造化し、可視化します。その結果、ユーザーは最も多くの取引が集中する価格帯や実際の市場不均衡が形成される領域を明確に把握できます。 以下に、本インジケーターの主要な技術特性と設定パラメータを示します。 基本コンセプト インジケーターは 価格レベル を識別し、それらを正の出来高、負の出来高、および純 Delta(正負の出来高差)に分類します。 各価格レベルは 水平バー としてチャートに表示され、市場の活動ゾーンや不均衡領域を視覚的に確認できます。 ユーザーは 分析対象ローソク足数 、 価格の丸め精度 、 最大表示レベル数 、および 表示スタイル を自由に設定できます。 主要機能 価格レベルのマッピング :設定された精度に基づき価格を丸め、対応するローソク足の
これはほぼ間違いなく、MetaTraderプラットフォームで見つけることができる最も完全な調和価格形成自動認識インジケーターです。 19種類のパターンを検出し、フィボナッチプロジェクションをあなたと同じように真剣に受け止め、潜在的逆転ゾーン(PRZ)を表示し、適切なストップロスとテイクプロフィットレベルを見つけます。 [ インストールガイド | 更新ガイド | トラブルシューティング | よくある質問 | すべての製品 ] 19の異なる調和価格形成を検出します プライマリ、派生および補完フィボナッチ投影(PRZ)をプロットします 過去の価格行動を評価し、過去のすべてのパターンを表示します この指標は、独自の品質とパフォーマンスを分析します 適切なストップロスとテイクプロフィットのレベルを表示します ブレイクアウトを使用して適切な取引を通知します すべてのパターン比をグラフにプロットします 電子メール/音声/視覚アラートを実装します スコット・M・カーニーの本に着想を得て、この指標は最も純粋で急を要するトレーダーのニーズを満たすように設計されています。ただし、トレードを容易にする
Advanced Volume Profile Analysis Tool for MetaTrader 5 The Kecia Volume Profile Order Finder provides traders with volume profile analysis capabilities. This MT5 indicator combines volume profile visualization with statistical calculations to help identify potential trading opportunities and suggests entry, stop loss, and take profit levels based on market structure. Market Profile Visualization Transform your chart with customizable volume profile visualizations: Multiple visualization options
This Volume Delta Profile is an advanced MetaTrader 5 indicator that visualizes   volume delta (order flow imbalance)   using a volume profile-style histogram. It shows the difference between buying and selling pressure at specific price levels, helping traders identify supply and demand zones. This indicator provides a unique perspective on market dynamics by visualizing the imbalance between buying and selling pressure, offering insights beyond traditional volume analysis. Core Concept Positiv
"Impulses and Corrections 5" is created to help traders navigate the market situation. The indicator shows multi-time frame upward and downward "Impulses" of price movements. These impulses are the basis for determining the "Base" , which is composed of zones of corrections of price movements, as well as "Potential" zones for possible scenarios of price movement. Up and down impulses are determined based on a modified formula of Bill Williams' "Fractals" indicator. The last impulse is always "U
Harmonic Pattern Structure Harmonic Pattern Structure is a professional MetaTrader 5 indicator that automatically detects classic harmonic patterns using strict Fibonacci ratio validation and XABCD price structure. Designed for traders who value precision, clean visuals, and structured analysis, the indicator highlights potential reversal zones based on price geometry, supporting consistent and objective decision-making. SUPPORTED HARMONIC PATTERNS Gartley (222) Butterfly Bat Crab Shark Cy
ONNYX INDICATOR バージョン 1.14 MetaTrader 5 用のサプライ・デマンド分析インジケーターです。確定したスイングからゾーンを作成し、ATR で幅を調整し、品質をパーセント表示します。確定足の BUY/SELL シグナルは後から消えない設計です。 主な機能 - ゾーン内に品質パーセントを表示するサプライ・デマンドゾーン。 - 確定足で表示される大きな BUY/SELL 矢印。 - EMA トレンドフィルターとローソク足反発確認。 - トレンド、価格レベル、市場状況パネル。 - 関連する経済指標を最大5件表示。発表前は Forecast/Previous、発表後は Actual を表示。 - 60秒ごとのニュース更新とストラテジーテスター用カレンダーキャッシュ。 - ポップアップ、プッシュ、メール通知。 - iCustom 用バッファ:0=BUY価格、1=SELL価格。 使用方法 チャートに適用し、履歴の読み込みを待ってから、トレンドと有効ゾーンを確認し、確定足シグナルを独自のリスク管理と組み合わせてください。XAUUSD H1 は見やすい構造、M15 はより
VibeFox Volume Profile — MetaTrader 5 向け Volume Profile VibeFox Volume Profile は、MetaTrader 5 向けの完全な Volume Profile ツールセットです。取引された出来高を価格に沿って水平方向に分布させて描き出すため、市場が最も活発だった場所、薄商いだった場所、そしてどの価格水準が磁石や障壁として働きやすいかを一目で確認できます。各プロファイルはチャート上に直接描画され、モダンでマウス操作のパネルから制御されます——掘り下げるメニューも、アタッチするスクリプトもありません。 ローソク足だけからサポートとレジスタンスを推測する代わりに、出来高の実際の足跡を扱います。価格を引き寄せる高出来高ノード、価格が素早く通過しがちな低出来高のすき間、そして大半の取引が行われた公正価値ゾーンです。 必要な形の Volume Profile Volume Profile は単一の固定プロファイルではありません。 複数の独立したプロファイルエンジンを同時に 提供し、それぞれが独自の範囲、配置、スタイルを持つため
Price Magnet — Price Density and Attraction Levels Indicator Price Magnet is a professional analytical tool designed to identify key support and resistance levels based on statistical Price Density. The indicator analyzes a specified historical period and detects price levels where the market spent the most time. These zones act as “magnets,” attracting price action or forming a structural base for potential reversals. Unlike traditional Volume Profile tools, Price Magnet focuses on price-time d
Passband Filter Pro Passband Filter Pro is a trend and cycle oscillator for MetaTrader 5. It is built on the Ehlers Super Passband Filter, a band pass filter that removes long term trend drift and short term noise so that only the dominant market cycle remains. The result is a clean oscillator with a color cloud that shows overbought and oversold conditions, cycle turns, and momentum on forex, gold, indices, stocks and crypto. Most traders enter too early or too late. Simple moving averages la
What Is Trend Master Pro? Trend Master Pro   is a professional-grade trend trading indicator built for MetaTrader 5. It was designed with one goal in mind — to keep you on the right side of the market at all times by combining three powerful technical tools into a single, clean, easy-to-read display directly on your price chart. Instead of cluttering your screen with multiple separate indicators, Trend Master Pro fuses an   EMA Ribbon trend filter , a   ZigZag swing point engine , and a   breako
CyberTradeTHxAI Gold Sniper MT5 Professional Gold Trading Signal Indicator for MetaTrader 5 CyberTradeTHxAI Gold Sniper MT5 is a professional-grade Gold (XAUUSD) trading indicator developed to identify high-probability Buy and Sell opportunities using trend analysis, pullback confirmation, and intelligent market structure detection. Designed for both beginner and advanced traders, the indicator automatically calculates optimal Entry Zones, Stop Loss, and multiple Take Profit levels while provid
GoldPro Max
Taher Ahmed Mohamed Taha Elshafei
GOLDPRO MAX Advanced Multi-Timeframe and Smart Money Market Analysis for MetaTrader 5 GoldPro Max is a professional market analysis indicator for MetaTrader 5 designed to help traders study market direction, price structure, liquidity, market imbalance and potential trading areas from multiple perspectives. The indicator combines Multi-Timeframe Analysis, Smart Money Concepts, Market Structure, Liquidity Analysis, Order Blocks, Fair Value Gaps, Premium and Discount analysis, Smart Analytical Eng
Crash 1000 Scalping Indicator for the Crash 1000 Deriv Synthetic Index. Introduction The Crash 1000 Scalping Indicator is a specialized tool designed for the Crash 1000 index on the Deriv Synthetic market. This indicator is particularly useful for scalping on the M1 timeframe, helping traders to identify precise entry and exit points for buy positions. It is designed to be non-repainting, providing clear signals with audible alerts and push notifications, and is compatible with mobile devices th
The Super Arrow Indicator provides non-repainting buy and sell signals with exceptional accuracy. Key Features No repainting – confirmed signals remain fixed Clear visual arrows: green for buy, red for sell Real-time alerts via pop-up, sound, and optional email Clean chart view with no unnecessary clutter Works on all markets: Forex, gold, oil, indices, crypto Adjustable Parameters TimeFrame Default:   "current time frame" Function:   Sets the time frame for indicator calculation Options:   Can
Master Editionは、ボリュームとマネーフローの視点を通じて市場構造を可視化するために設計されたプロフェッショナルグレードの分析ツールです。標準のボリュームインジケーターとは異なり、このツールはチャート上に日足ボリュームプロファイルを直接表示し、価格発見がどこで行われたか、そして「スマートマネー」がどこに位置しているかを正確に確認できます。 このMaster Editionは、明確さとスピードを考慮して設計されており、ロード時にチャートレイアウトを即座に美化するユニークな自動テーマ同期システムを備えています。 主な機能: 真のマネーフロー計算: 標準のティックボリュームを超えます。「Use Money Flow」を有効にすると、ボリュームは価格によって重み付けされ、特定の価格レベルでの実際の資本コミットメントが明らかになります。 バリューエリア (VA) の可視化: バリューエリア(デフォルトではボリュームの70%)を自動的に計算します。 VA Fill: コントロールゾーンを即座に識別するために、バリューエリアの背景をシェーディングします。 主要レベル: コントロールポイン
NeuralTickによるCleanTrend — 過去を決して書き換えないトレンド指標。履歴上は美しいのに、ライブトレードではシグナルを書き換えてしまう指標にうんざりしていませんか? ノイズと欺瞞にうんざりしているトレーダーがCleanTrendを選ぶ3つの理由: 100%再描画なし。 ラインの色は永久に固定されます。過去のバーが後から変わることは一切ありません — ストラテジーテスターでご確認ください。 デュアルノイズフィルター。 価格が設定したしきい値(MinMove)を超えかつ複数のバーにわたって方向を維持した(ConfirmBars)場合にのみシグナルが出現します。レンジ相場での「ノコギリ刃」とはおさらばです。 状況を逃さないアラートシステム。 ポップアップウィンドウ、サウンド、ジャーナル記録、スマートフォンへのプッシュ通知(MetaTrader 5アプリ)。ターミナルが閉じていても、トレンド変化を即座に把握できます。 CleanTrendはチャートをパネルで埋め尽くしません — シンプルなカラーラインのみ:青(買い) または 赤(売り)。エントリー価


スマート供給需要レクタングルツールインジケーターは、MT5のための究極の相棒です。重要な供給と需要のデータを瞬時に視覚化し、必要な場所—ゾーン上にリアルタイムで表示します。 このツールは、ゾーン分類、ピップ距離、強度、ゾーンサイズなどの豊富で実践的なデータを自動的にゾーン上に重ねて表示します。もう散らかりや推測は不要—明確で動的な洞察があなたの意思決定をサポートします。 トレーダーのために作られ、精密さで動きます。 イントラデイのスキャルピングでも、毎日のチャートの主要なゾーン分析でも、このインジケーターは手動で描いたゾーンを瞬時にインテリジェントなゾーンに変え、ワークフローを中断せずにチャートの情報価値を即座に高めます。 **機能一覧** **自動レベル検出** - チャート上のすべてのゾーンを瞬時に認識。 - 供給または需要として分類—手動タグ付け不要。 **豊富なリアルタイムメトリクス** 表示内容: - ゾーンサイズ - 現在の価格からのライブピップ距離 - ゾーンの強度スコア - ゾーンの年齢(ゾーンが存在した期間) **ライブアップデート** - 価格の動きに合
Was: $299  Now: $99  Supply Demand uses previous price action to identify potential imbalances between buyers and sellers. The key is to identify the better odds zones, not just the untouched ones. Blahtech Supply Demand indicator delivers functionality previously unavailable on any trading platform. This 4-in-1 indicator not only highlights the higher probability zones using a multi-criteria strength engine, but also combines it with multi-timeframe trend analysis, previously confirmed swings a
RBreaker Gold Indicatorsは、金先物の短期日内取引戦略であり、トレンドフォローと日内反転の2つの取引手法を組み合わせたものです。トレンド相場での利益を捉えるだけでなく、相場が反転した際には迅速に利確し、その流れに沿ってポジションを反転させることができます。 この戦略は、アメリカの雑誌『Futures Truth』において、15年連続で最も収益性の高い取引戦略トップ10に選ばれた実績を持ち、非常に長いライフサイクルを誇り、現在も国内外で広く使用・研究されています。 本インディケーターは、2026年の金先物の値動きに対応し、14日間のATR指標に基づいて、ブレイクアウト係数A、観察係数B、リバーサル係数Rをより合理的な値で定義しています。非常に優れたインディケーターであり、安定的な年間収益を実現しています。ぜひおすすめします〜
Visual Tiger Speed Indicator
AL MOOSAWI ABDULLAH JAFFER BAQER
Visual Tiger Speed Indicator: Unleash the Power of Market Velocity For just a one-time payment of $30, gain a lifetime edge in identifying explosive market moves before they happen. Are you tired of lagging indicators that only show you what has already occurred? The Visual Tiger Speed Indicator is a next-generation tool designed to measure the true, unfiltered velocity of price action, giving you a unique advantage in any market condition. It moves beyond simple price analysis to decode the mo
Before installing the HeatMap indicator make sure you are using a broker that gives you access to the Depth of market (DOM) !! This indicator creates a heatmap on your chart allowing you to see the buy or sell limit orders easily and in real time. You have the possibility to change the setting and the colors of the HeatMap in order to adapt to all markets and all charts. Here is an example of a setting you can use with the NASDAQ100 on the AMPGlobal broker :  https://www.youtube.com/watch?v=x0Y
Here   our more valuable tools SMC Trend Trading   ,  Easy SMC Trading  ,  Institutional SMC Architect Volume Analysis Tools  ,  Volume flow Profile  ,  Market volume profile  , FVG with Volume  , Liquidity Heatmap Profile  ,  Volume Spread Analysis The    Liquidity Heatmap   is a sophisticated institutional trading tool designed to reveal where over-leveraged traders are trapped. By calculating estimated liquidation levels based on volume spikes and leverage, this indicator draws a dynamic "h
このプロダクトを購入した人は以下も購入しています
UZFX {SSS} スキャルピング・スマートシグナル v5.0 MT5は、変動の激しい市場において正確かつリアルタイムのシグナルを求めるスキャルパー、デイトレーダー、スイングトレーダー向けに設計された、リペイントのない高性能な取引インジケーターです。(UZFX-LABS)によって開発されたこのインジケーターは、価格行動分析、トレンド確認、スマートフィルタリングを組み合わせることで、すべての通貨ペアおよび時間枠において、高確率の売買シグナル、警告シグナル、トレンド継続の機会を生成します。 トレードの判断に迷うのはもうやめましょう。明確さ、正確さ、そして規律ある市場執行を求めるトレーダーのために設計された、体系的なシグナルシステムに従い始めましょう。 間違いなく、MQL5で入手可能な最高のインジケーターの一つです。絶対に見逃さないでください!!「スマートなトレーダーのためのスマートシグナル」 最新バージョン5.0がリリースされました。価格は予告なく最大499.99ドルまで値上がりする可能性がありますので、チャンスを逃さないようお早めにお求めください!! 購入を決める前に!無料トライアル
Boom & Crash & PainX & GainX Ultimate Spike Detector Trade Spikes With Confidence — Not Guesswork Catching spikes should be one of the most profitable strategies in synthetic markets. But for most traders, it becomes one of the most frustrating. You enter too early… price goes against you. You wait for a spike… it never comes. You finally catch one… but don’t know whether to hold or close. You make profit… then give it all back because there’s no exit plan. This is exactly the problem the Ultim
PrimeScalping is a powerful trading companion designed to generate high-probability entry signals with dynamic TP/SL/DP levels based on volatility. Built-in performance tracking shows win/loss stats, PP1/PP2 hits, and success rates — all updated live. Key Features: Buy/Sell signals with adaptive volatility bands Real-time TP/SL/DP levels based on ATR Built-in MA Filter with optional ATR/StdDev volatility Performance stats panel (Success, Profit/Loss, PP1/PP2) Alerts via popup, sound, push, or e
note: this indicator is for METATRADER4, if you want the version for METATRADER5 this is the link:  https://www.mql5.com/it/market/product/108106 TRENDMAESTRO ver 2.5 TRENDMAESTRO recognizes a new TREND from the start, he never makes mistakes. The certainty of identifying a new TREND is priceless. DESCRIPTION TRENDMAESTRO identifies a new TREND in the bud, this indicator examines the volatility, volumes and momentum to identify the moment in which there is an explosion of one or more of these da
FX-AIEA Smart Supply and Demand Zone Identification Indicator (Supply and Demand Indicators MT5) Version: 2.51 | Compatible Platform: MetaTrader 5   Why do trades need supply and demand zones? Supply and demand zones are the core manifestation of institutional order flow, reflecting real buying and selling power more accurately than traditional support and resistance. However, manual drawing is not only time-consuming but also highly subjective and prone to missing key areas. FX-AIEA Supply-De
SmartScalping is a powerful trading companion designed to generate high-probability entry signals with dynamic TP/SL/DP levels based on volatility. Built-in performance tracking shows win/loss stats, PP1/PP2 hits, and success rates — all updated live. Key Features: Buy/Sell signals with adaptive volatility bands Real-time TP/SL/DP levels based on ATR Built-in MA Filter with optional ATR/StdDev volatility Performance stats panel (Success, Profit/Loss, PP1/PP2) Alerts via popup, sound, push, or e
ScalpPoint is a powerful trading companion designed to generate high-probability entry signals with dynamic TP/SL/DP levels based on volatility. Built-in performance tracking shows win/loss stats, PP1/PP2 hits, and success rates — all updated live. Key Features: Buy/Sell signals with adaptive volatility bands Real-time TP/SL/DP levels based on ATR Built-in MA Filter with optional ATR/StdDev volatility Performance stats panel (Success, Profit/Loss, PP1/PP2) Alerts via popup, sound, push, or emai
MasterTrend Indicator for MT5 A powerful trend-following and signal-evaluation tool MasterTrend   is a custom MT5 indicator that combines Moving Averages and ATR-based risk/reward logic to generate clear buy/sell signals. It visualizes dynamic SL/TP levels, evaluates past trade outcomes, and displays win/loss statistics in a clean on-chart panel. Key features include: Buy/Sell signals based on MA crossovers ATR-based SL/TP1/TP2/TP3 levels with visual lines and labels Signal outcome tracking wit
このインジケーターは、市場で 関心が示されたゾーン をハイライトし、その後に 注文の蓄積ゾーン を表示します。 これは、大規模な**板情報(オーダーブック)**のように機能します。 これは、 巨大な資金 のためのインジケーターです。その性能は卓越しています。 市場にどんな関心が存在していても、 必ず目に見えるようになります 。 (これは 完全に再設計され、自動化されたバージョン です。もはや手動分析は必要ありません。) トランザクションスピード(取引速度) は新しい概念のインジケーターで、市場で大口注文が どこに・いつ 集中しているかを示し、それに基づいたチャンスを提供します。 トレンドの変化を 非常に早い段階 で察知することができます。 FXでは「出来高」と呼ばれているものは誤解されています。実際には、これは 時間あたりの価格変動量 です。したがって、正しい名称は トランザクションスピード です。 考え方・行動・分析の仕方すべてが問われます。 分析パラダイムの転換は非常に重要です。 このインジケーターは、FXにおける出来高の考え方を 根本から再定義 し、論理的な形で正確に活用する、
相場が本当は何をしているのかを見抜く。   3つの市場フェーズ(収縮・拡張・トレンド)を目の前でライブに捉え、トレンド・フェーズの初期段階でより優れたエントリーを取りましょう   。      当て推量はもう終わり。機関投資家やスマートマネーのように相場を読み始めましょう。   Apex Market Structure Pro(MT5版)は、ノイズを取り除き、あらゆるローソク足の下にある真の構造を見せる高精度のスマートマネー分析ツ   ールです。流動性、構造転換、蓄積ゾーン、トレンドバイアスを、ひとつのクリーンでプロフェッショナルなオーバーレイに集約します。遅行   指標に見切りをつけ、明晰さをもってトレードする準備のできた本気のトレーダーのために作られました。   重要:本インジケーターは Heikin Ashi(平均足)ローソク足での動作を前提に設計されています。使用前にチャートを Heikin Ashi   に設定し、その真価を解き放ってください。分析のすべては Heikin Ashi の価格の流れを軸に構築されています。Apex Market Structure Pr
Historical Similarity Matcher Indicator (HI.SI.MA) Try it free today — demo version now available!   https://www.mql5.com/en/market/product/167114 Overview The Historical Similarity Matcher is a technical analysis indicator for MetaTrader 5. It scans historical price data to find segments that show statistical similarity to a user-selected reference period on the chart.
AriX
Temirlan Kdyrkhan
1 (4)
AriX Indicator for MT5 A powerful trend-following and signal-evaluation tool AriX is a custom MT5 indicator that combines Moving Averages and ATR-based risk/reward logic to generate clear buy/sell signals. It visualizes dynamic SL/TP levels, evaluates past trade outcomes, and displays win/loss statistics in a clean on-chart panel. Key features include: Buy/Sell signals based on MA crossovers ATR-based SL/TP1/TP2/TP3 levels with visual lines and labels Signal outcome tracking with real-time stat
Gold Uptrend Insider
Lawrence Chiiambb Mkandawi
5 (1)
Uptrend Insider A clean and powerful trend-following indicator that helps you catch the beginning of uptrends and exit before the market turns into a range or downtrend. How it works:   Green → Uptrend signal (potential buying opportunity) Orange → Ranging / sideways market possibility but maintain the trend positions just keep an eye for possible ranges and reversals. Red → Downtrend or exit signal (time to close long positions) The indicator is designed to be extremely simple and visual. You o
OrderFlow Absorption – MT5用プロフェッショナル・デルタ&アブソープションシグナルインジケーター OrderFlow Absorptionで本物のオーダーフロー分析の力を解き放ちましょう。MetaTrader 5向けの究極のデルタヒストグラム&アブソープションシグナルインジケーターです。あらゆる価格変動の裏側で何が起きているのかを知りたいトレーダーのために設計されており、市場を動かす隠れた買い/売り圧力や吸収イベントを明らかにします。 特徴 デルタヒストグラムの可視化:   買い圧力・売り圧力を色分けされたヒストグラムで即座に表示。 アブソープションシグナル検出:   高度なロジックで強気・弱気の吸収イベントを特定し、反転の兆しを早期に通知。 チャートマーカー:   吸収シグナルをチャート上に直接マークし、視覚的に分かりやすく表示。 ポップアップアラート:   新しい吸収シグナルが出現した際にリアルタイムで通知。 カスタマイズ可能な閾値:   弱いシグナルを除外し、高確率のセットアップに集中。 リソース管理:   大きなチャートでも高速に動作する効率的な計算。
マーケットメーカーのためのツール。 Meravith は次の機能を提供します: すべての時間足を分析し、現在有効なトレンドを表示します。 強気と弱気の出来高が等しくなる流動性ゾーン(出来高均衡)を強調表示します。 異なる時間足のすべての流動性レベルをチャート上に直接表示します。 テキスト形式の市場分析を生成し、参考情報として表示します。 現在のトレンドに基づいて目標値、サポートレベル、ストップロスを計算します。 取引のリスクリワード比を算出します。 口座残高に基づいてポジションサイズを計算し、潜在的な利益を推定します。 また、市場に大きな変化があった場合には警告を表示します。 インジケーターの主要ライン: 強気/弱気の出来高エグゾーストライン ― 目標値として機能します。 市場のトレンドを示すライン。市場が強気か弱気かによって色が変わり、トレンドのサポートとして機能します。主にその色が市場センチメントを示します。 出来高均衡ライン(Eq)。Eq(Volume Equilibrium)ラインはシステムの中核です。これは買い手と売り手の出来高のバランスポイントを表します。市場の流動性を示し
VTrende Pro
Andrii Diachenko
5 (1)
VTrende Pro - MTF indicator for trend trading with a display panel for MT5 *** Videos can be translated into any language using subtitles (video language - Russian) Although the signals of the VTrende Pro indicator can be used as signals of a full-fledged trading system, it is recommended to use them in conjunction with the Bill Williams TS. VTrende Pro is an extended version of the VTrende indicator. Difference between Pro version and VTrende: - Time zones - Signal V - signal 1-2 waves -    S
This indicator automatically detects internal & swing market structure, Fibonacci Retracement and Fibo Levels. Features Full internal & swing market structure labeling in real-time Fibonacci Retracement Fibonacci Levels After purchasing the indicator, the full source code is provided, and via indicator buffers it can be easily integrated into your Expert Advisors (EAs) for automated trading strategies.
Naked Forex Tweezer Pro Indicator Tweezer Pro Indicator is a pattern recognition indicator for Forex, Stocks, Indices, Futures, Commodities and Cryptos. The standard Tweezer is a two bar pattern. Our enhanced version is a multi-bar pattern. We filter the patterns for you so that you only get the     best and most effective patterns   and ignore the noise. The Tweezer pattern is a simple and effective pattern to trade. The strategy that comes with the Tweezer is based on price action. The Twe
MERAVITH SCANNERは、MetaTrader 5用のプロフェッショナルな金融市場インジケーターで、複数の分析ツールを一つの統合システムにまとめています。独自の出来高加重平均価格(VWAP)手法を使用してすべての計算を自動で行い、主観的な解釈を完全に排除します。 このインジケーターは、すべての資産クラス(FX、株式、指数、商品、暗号通貨)およびM1から月足までのすべての時間軸で動作します。基本原理は「価格は出来高に従う」というものです。MERAVITHは機関投資家の出来高が集中するポイントを特定し、その集中から数学的に正確な価格レベルを導き出します。予測や投機は行わず、計算のみを行います。 MERAVITH SCANNERを使用すると、28の主要FX通貨ペアをすべての時間軸でわずか2~3分でスキャンできます。また、任意の市場をスキャンすることも可能です。例えば、約100銘柄の株式を約10分でスキャンできます。 インジケーターは、消耗レベル、均衡線、偏差、統計レベル、およびターゲット予測を算出します。 チャート要素 Origin Point :すべての計算が始まる起点です。イン
Big Player Range
Thalles Nascimento De Carvalho
5 (3)
BigPlayerRange — MT5向け最強インジケーター BigPlayerRange は、MetaTrader 5 で日経ミニやドル先物などの取引において、 最も効果的なインジケーター と評価されています。大口投資家(機関投資家)の行動を可視化し、高精度なテクニカル分析を可能にします。 どのように機能するのか? BigPlayerRangeは、買い圧力ゾーン(緑ライン)と売り圧力ゾーン(赤ライン)を描画し、価格がその範囲を超えるとトレンド方向への動きを示唆します。 緑のライン上で終値: 買いの勢いが強く、上昇トレンドの可能性。 赤のライン下で終値: 売り圧力が優勢で、下落が予想される。 範囲内での価格: レンジ相場でブレイクを待つ段階。 主なメリット: 機関投資家ゾーンの検出: 大口のエントリーポイントを視覚化。 自動ターゲット計算: 利確ポイントを戦略的に設定。 プルバックの可能性分析: リスク管理に役立つ情報提供。 推奨の使い方: Imbalance DOM Pro と併用してゾーンブレイクを確認。 SwingVolum
ZIVA Signal Intelligence
Hassan Abdullah Hassan Al Balushi
ZIVA Signal Intelligence An Adaptive, Modular Market Intelligence System ZIVA Signal Intelligence is not positioned as a conventional trading indicator. It is a fully integrated, proprietary market intelligence system engineered to deliver structured, high-precision interpretation of price behavior within a controlled analytical environment. Developed through an independent architectural approach, ZIVA does not rely on, derive from, or replicate existing indicators. It represents a standalone
OmniSync Projection
Antonio-alin Teculescu
5 (1)
Chronos Fractal Engine is an innovative price projection indicator for MetaTrader 5, designed to transform your technical analysis by intelligently identifying and projecting historical price patterns. Built upon an advanced correlation algorithm and the fractal principles of the market, this powerful tool visualizes potential future price movements, giving you a unique edge in your trading decisions. What is Chronos Fractal Engine? At its core, the Chronos Fractal Engine employs a sophisticat
SMC Institutional Suite v3.7 Professional Smart Money Concept Indicator for MetaTrader 5 What is New in Version 3.7 - Visual Stability Update This release focuses entirely on one goal: making every zone, label, and line on your chart rock-solid stable. There is no more flickering, no more zones disappearing on a new candle, and no more duplicate drawings. Order Block (OB) zones no longer flicker or disappear. Once drawn, they stay permanently on the chart. Equal Highs and Equal Lows (EQH / EQL)
Hidden Trend Channel Project 17 Tool SPECIAL NOVEMBER SALE is now finished. Price goes back to normal.  This is an Automated Tool for Multi Timeframe Trend Channel Analysis Visualization with Intelligent Range Market, Trending Market, Reversal, Breakout Detection.  It draws multiple Trend Channels with multiple sub-trendlines levels inside the channel for perfectly give you the trader, the crystal clear Trend channels where price trend direction is moving. This tool is accurately useful for T
Footprint は、オーダーフロー(Order Flow)と出来高分析のためのインジケーターです。 クラスターレベルでの市場構造の特定、アクティビティの高い主要ゾーンの発見、そして設定ウィンドウを毎回開くことなくチャート上で直接フィルター操作を行うのに役立ちます。 Footprintインジケーターの機能 Bid x Ask、Deltaのクラスターチャート; チャート上のコントロールパネル; フィルター調整用のスライダー; Absorption; Initiative; Stacked Imbalances; Big Trades; dPOC / Dynamic Point of Control; Delta; サイドマーケットプロファイル; 累積デルタ(Cumulative Delta)。 主な利点 高密度のティックフローに対する高速な計算とデータ表示; チャート内管理 — 設定を開くことなく、主要モードとフィルターを直接切り替え可能; 重要な価格レベルとクラスターを強調するためのフィルタリング; シグナルの視覚的ハイライト:吸収、主導権、インバランス、大口取引; 日、週、または現
First time on MetaTrader, introducing IQ Star Lines - an original Vedic Astrology based indicator. "Millionaires don't use astrology, billionaires do" . - J.P. Morgan, Legendary American financier and banker. We don't offer free or bonus indicators in exchange of reviews from you. You won't need any free products with this indicator to make it work. ;) Enjoy! Welcome to  the new and updated  IQ Star Lines , the ultimate fusion of ancient planetary harmonic cycles and modern quantitative trading.
Binary Compound Indicator V3 Binary Compound Indicator V3 is a technical analysis indicator for MetaTrader 5 designed to help traders identify potential market opportunities using multiple confirmation filters and structured risk management concepts. The indicator combines trend analysis, momentum confirmation, and market condition filtering to provide visual trading signals directly on the chart. Main Features Triple-confirmation signal system EMA trend filtering RSI momentum analysis Stochast
==================================================================== SMC Pro v6.1 APEX AI — XAUUSD Gold Empire MetaTrader 5 インジケーター · Smart Money Concepts · 予測インテリジェンス・エンジン ==================================================================== SMC Pro v6.1 APEX AI は、MetaTrader 5 上の XAUUSD(ゴールド)専用に構築された、プロフェッショナルな Smart Money Concepts インジケーターシステムです。 完全な SMC フレームワーク — Order Blocks、Liquidity sweeps(流動性スイープ)、Fair Value Gaps、Break of Structure、Change of Character — に加え、AI を活用した 8 つの新モジュールを組み合わせ、精密なビ
" Blow It Up!" - The Trading Indicator That Questions Your Life Choices Tired of boring indicators? Meet your new market companion that delivers: "YOLO BUY!" arrows when you should probably panic Explosive rectangle confetti (because why not?) 200+ soul-crushing quotes like "Your stop loss is imaginary" and "This is n't trading, it's donating to whales" Random alerts that roast your strategy This Indicator is lik e Therapy - Because daytrading shouldn't fe el like watching paint dry! Highlights
作者のその他のプロダクト
Ouroboros: 適応的因果関係指標 (Adaptive Causality Indicator) Ouroboros は、「根の理論」(Root Theory) と適応的因果関係の概念に基づいて開発された独自のテクニカル分析ツールです。一般的なオシレーターや遅行性の移動平均線とは異なり、Ouroboros は出来高加重価格アクションを統合することで、市場の「推力」ゾーンと構造的な変化を特定します。 基本的な論理 このインジケーターは市場の生物学的な成長をマッピングするものであり、初期の「根」(価格アクション) が「栄養状態」(出来高) と相互作用します。これらの力が整列すると、Ouroboros は市場の拡大・縮小サイクルを明確に視覚化します。 主な特徴 ルートスラストライン (Root Thrust Line): ローソク足のボディと出来高に反応する動的な黄色いラインで、停滞期と比較して市場のエネルギーが強い時期を特定します。 「Sottosopra」雲: 機関投資家の流動性エリアや潜在的なサポート・レジスタンスゾーンを強調し、将来の市場サイクルを予測するために前方へシフトさせ
FREE
フィルタ:
レビューなし
レビューに返信