
Self-testable and self-optimizable indicator Matreshka Part 3
3 . Parameters of the Channel Options indicator :
The indicator draws three channels that can be used as stop levels for closing positions.
Channels are built to each wave, the wave can be Trend or Rollback
3.1 AllowSimpleChannel
If the AllowSimpleChannel parameter is true, the indicator builds a channel / line.
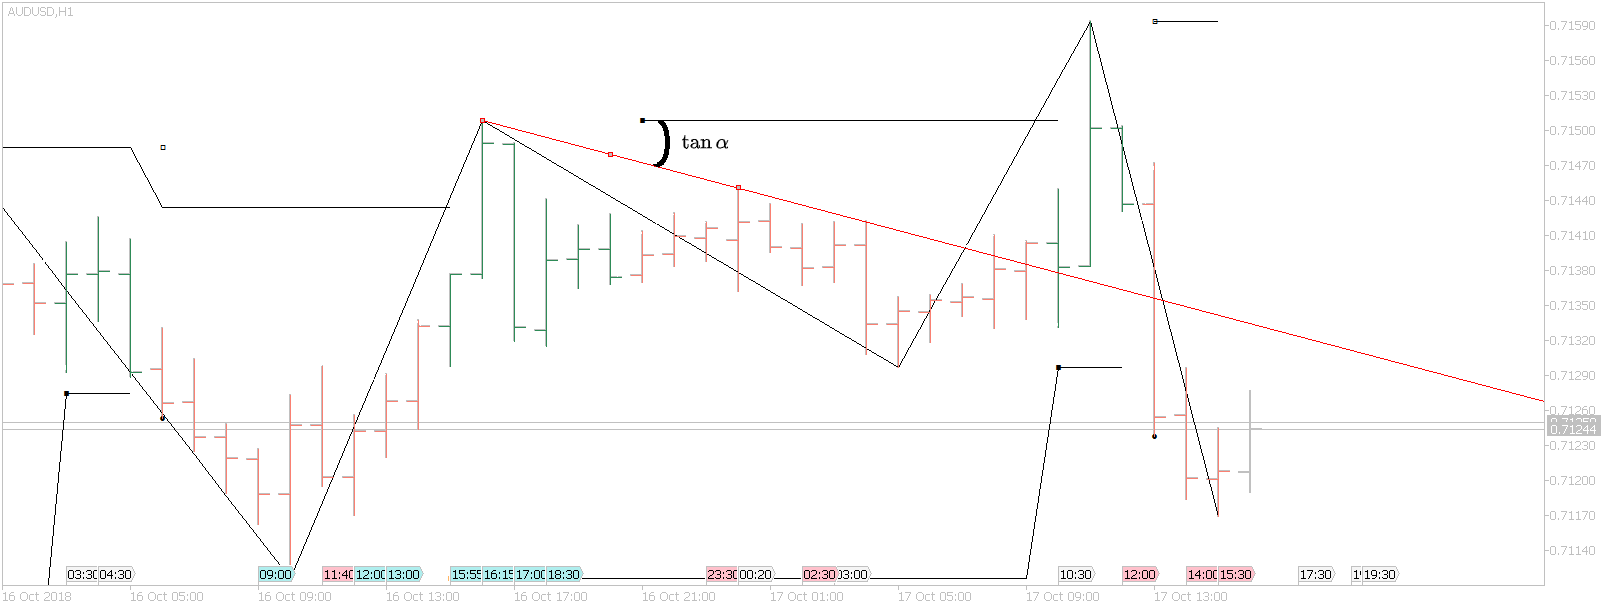
The first point of the channel is usually the beginning of the wave, the second point is chosen so that there is no other bar in the wave that crosses the channel, i.e. a channel is built with an angle whose tangent is possibly the smallest
The channel is drawn in real time, the value of the channel can be traced at any time.

The SimpleChannel channel on the screenshot is the blue line that goes below or above the wave, depending on its direction.
It is important to mark the channel marked with a black circle. In this case, the beginning of the channel is not the first bar of the wave, but the fourth. The channel counting algorithm stipulates that the first point of the channel must be before the end of the previous wave, and the second point after. On the graph, the moment of determining the beginning of the wave up is marked with a vertical red line.
3.2 AllowSqueezeChannel
If the AllowSqueezeChannel parameter is true, the indicator builds a channel / line.
The channel is built on the basis of the FiboChannel graphical tool embedded in the Terminal Metatrader . In this implementation, the channel has only one parameter Level / Level : -2
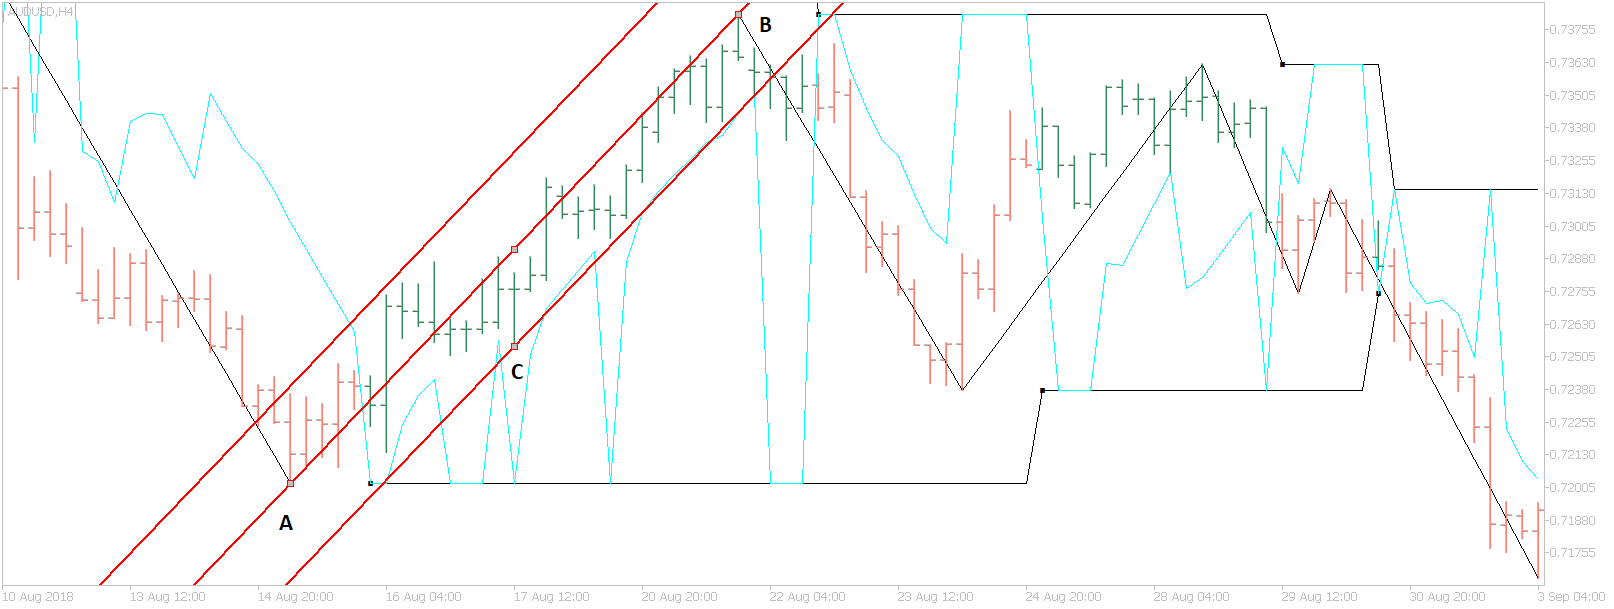
FiboChannel tool is installed on top of the wave .
-Point A. The starting point is always the initial extremum of the wave, in this example the base of the wave up.
-Point B. The extreme point of the channel is opposite to the extremum of the wave, in this example, the end of the wave up. In real time, this will be the wave up current maximum
-Point C . The midpoint must be on any bar in the wave, so that the channel does not penetrate either from below or above any bar of the wave
The channel is drawn in real time, in this example, a blue line.
3.3 AllowWPRChannelPeriod
If the AllowWPRChannelPeriod parameter is > 0, the indicator builds a channel / line.
The channel tracks in real time the extremes of the N last bars. Named WPRChannel, because The principle of calculating the WPR indicator is similar. If the wave is up, the channel tracks the lowest Low cost of the last N bars, if the wave is down, the highest High cost of the last N bars. Number of bars N depends on the parameters Lvl and LvlCoefficient described above . The formula for calculating N = AllowWPRChannelPercent * ( LvlCoefficient * (2 ^ Lvl ))
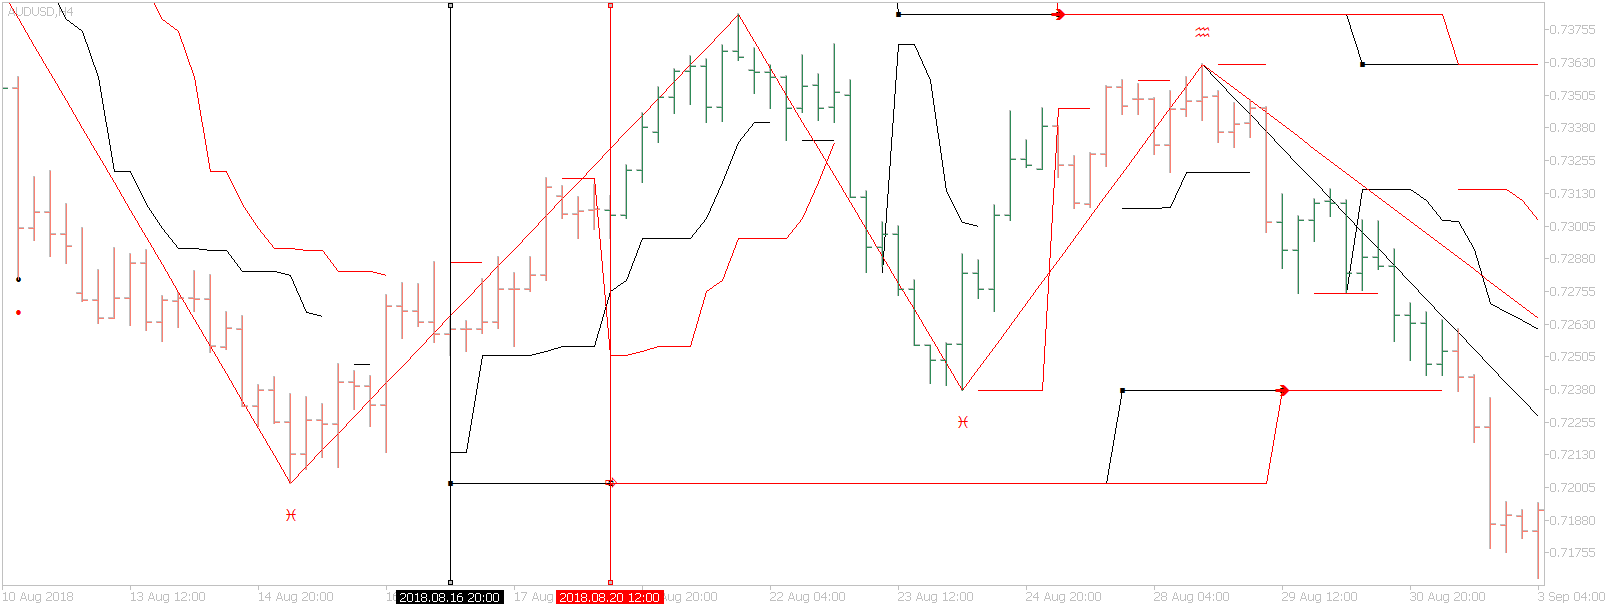
An example of a WPR channel in a wave up Lvl = 0 (black channel) and a wave up Lvl = 1 (red channel). The beginning of the waves, respectively, is the black vertical and red vertical lines.Indicator parameters: Lvl = 1, LvlCoefficient = 2. The channel is equal to the minimum value Low on the last N bars. For the black wave, N = 3 * 2 * (2 ^ 0) = 6 bars. For the red wave, N = 3 * 2 * (2 ^ 1) = 12 bars.
The indicator is published on the market https://www.mql5.com/en/market/product/33478


")

![[XAUUSD]: Weekly Liquidity Activation Points (timings), June 22-26, 2026](https://c.mql5.com/6/1013/splash-preview-771790.png "[XAUUSD]: Weekly Liquidity Activation Points (timings), June 22-26, 2026")