
Self-testable and self-optimizable indicator Matreshka Part 4.1
7. Testing and Optimization
7. 1 Testing
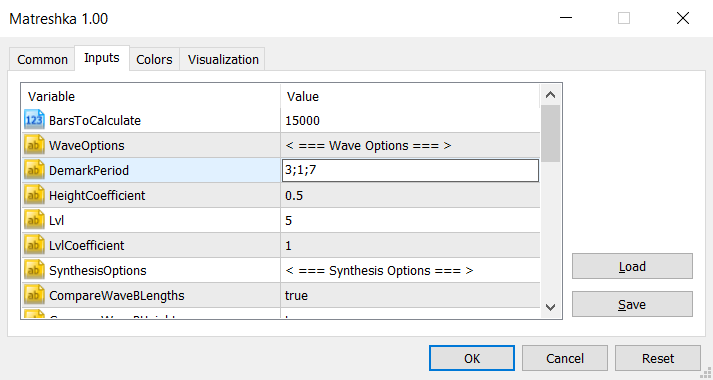
After the indicator is initialized, the result of a trade simulation is displayed in the Experts section of the Metatrader terminal , as well as statistical data, for example:

The indicator displays :
- number of orders
- balance result
- maximum lot
- minimum Margin Level
- drawdown in percentage of balance and in money
- time without profit
- the maximum number of profitable and non-profitable positions in a row
7.2 Optimization
The indicator has a built-in algorithm for optimization and selection of optimal parameters. Instead of the indicator parameter value, enter
1. The first value of the parameter
2. Step of parameter change
3. Last parameter value
4. Insert the symbol ';' between the values
The approach is similar to the optimization of Expert Advisors in the Metatrader platform. For example, if for the parameter DemarkPeriod instead of the value “5” the value “3;1;7” is entered, the indicator will switch to optimization mode and start the optimization of the parameter DemarkPeriod:
DemarkPeriod parameter with the value “3;1;7” - the indicator will start the parameter optimization
The indicator will begin a series of indicator initializations - will open a window with the first value of the parameter - 3.
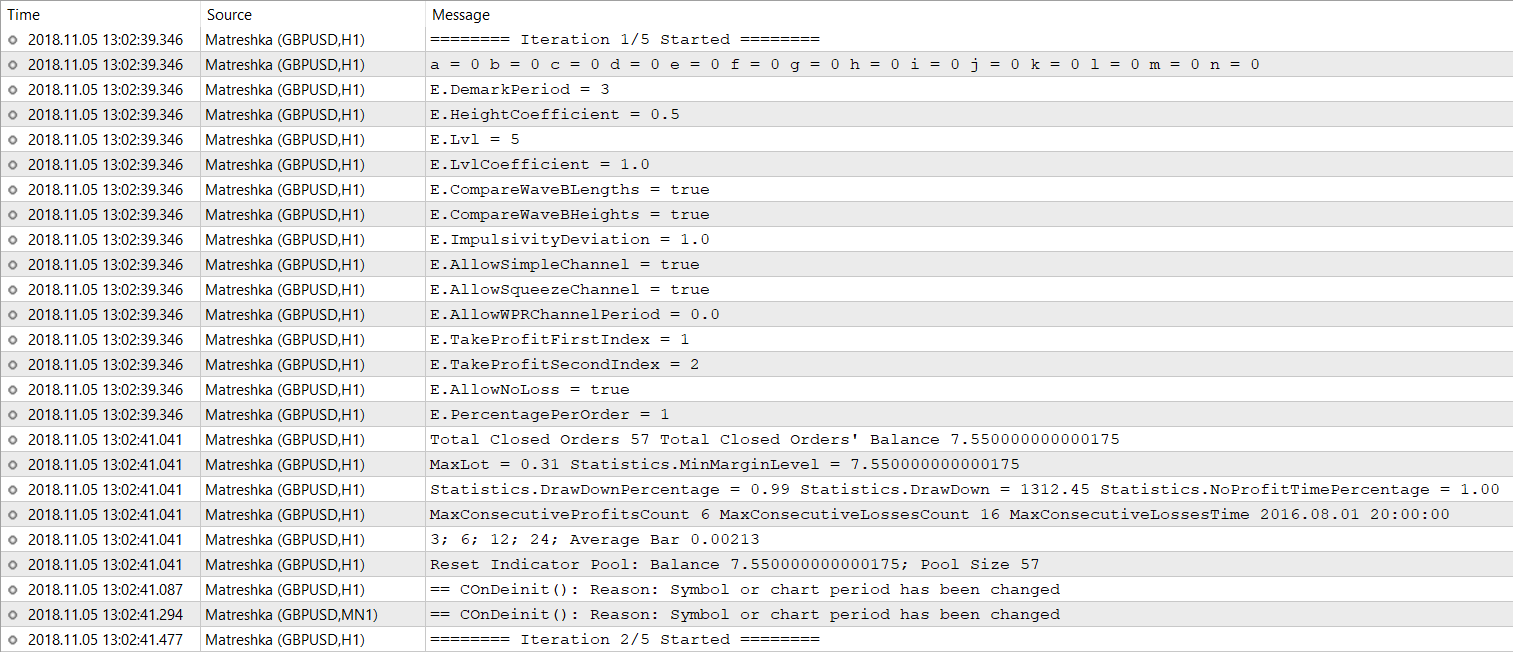
Run the first iteration of five, which will lead to the initialization of the indicator with the parameter DemarkPeriod = 3
When the initialization for parameter 3 is complete and the test result is received, the chart is closed and opened with the next value of DemarkPeriod - 3 + 1 = 4. After recalculating all the options DemarkPeriod - 3, 4, 5, 6, 7 - the indicator selects the one that earned the maximum profit. The indicator initializes with the value DemarkPeriod, which gave the maximum profit on the optimization result, and leaves the chart with the indicator set.
The last recalculation is “Set best parameters and stop optimization”. According to the optimization results, the fourth iteration turned out to be the most profitable, the indicator sets the parameter DemarkPeriod = 6 and reinitializes again.
For the optimizer to work correctly, the following rule must be observed:
(Last parameter value - First parameter value) / Parameter change step = Integer
For example:
3; 2 ; 7 -> (7-3) / 2 = 4/2 = 2
0.4 ; 0.3 ; 1.3 -> (1.3-0.4) /0.3 = 0.9 / 0.3 = 3
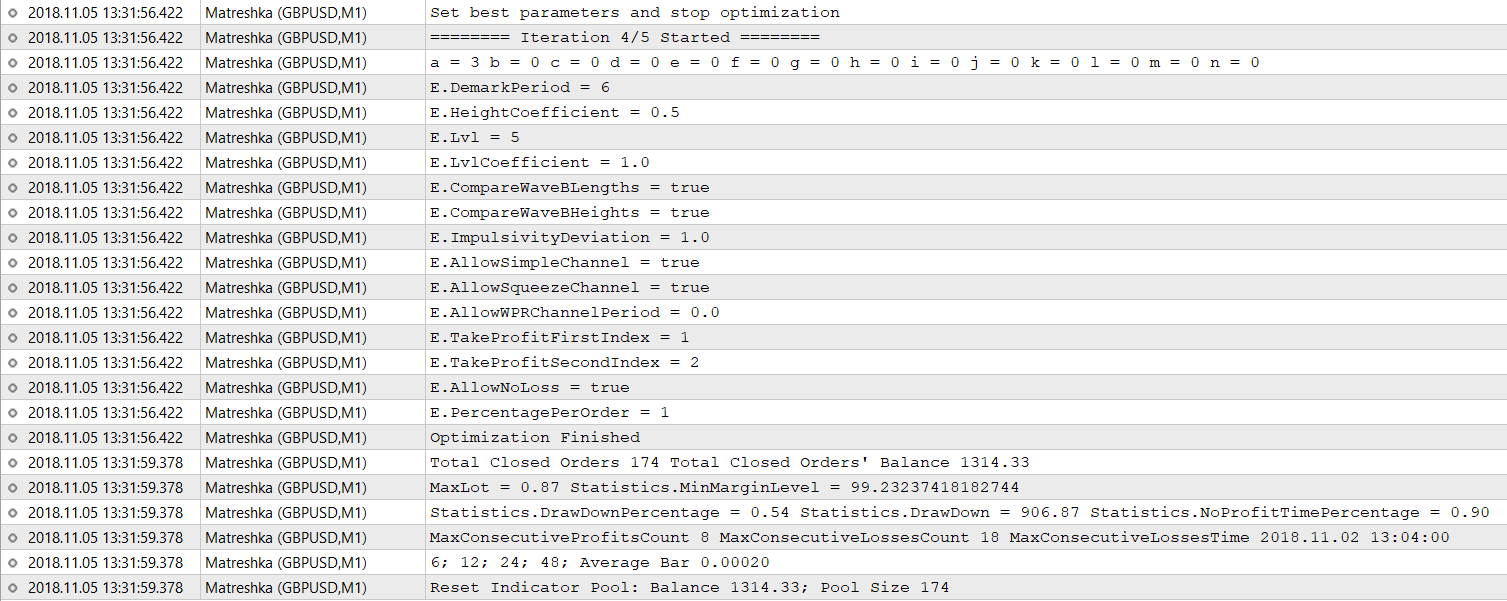
It is important to do a manual check of the Global Variables set by the Terminal before starting the optimization. You can call up the Global Variables list by pressing the F3 key while in the MetarTrader terminal. Since the optimization is controlled by the Global Variables, for the optimizer to work correctly, it is necessary that the starter variables with the name “Matreshka Optimization ..” are deleted before starting the optimization. In most cases, the indicator takes care of deleting the Global Variables, but if you interrupt the optimization until its completion and close the Terminal, the indicator does not always have time to remove the Global Variables.
8. Hotkeys / Indicator Keys
Since the indicator draws many lines, the ability to “hide” some of them at the discretion of the user is added. When a certain key is pressed on the keyboard, the lines disappear, and when you press the same key again, lines are drawn again. Below is a list of keys with which the indicator works:
Q - hides / shows all horizontal lines that show the beginning and start time of the waves.
W - hides / shows all ZigZag waves drawn by the indicator.
E - hides / shows all arrows, denoting the start of Rollback waves.
R - hides / shows all arrows denoting the beginning of the Trend / Trend waves
R - hides / shows all OpenChannel channels
Y - hides / shows all 3PointsChannel channels
1 - 9 - By pressing keys with numbers from 1 to 9, the indicator hides / shows the Fibonacci Expansion nets, and also hides / shows the Fibonacci Retracement and Fibonacci Time Zone nets of the specified level. Nets are built on extremum of the last Trend wave. For example, pressing the number 1 once, if there is a FibonacciExpansion Lvl 1 on the chart, the indicator will add a Fibonacci Retracement Lvl 1 net. If the same key is pressed a second time, the indicator will remove Fibonacci Retracement Lvl 1 and add Fibonacci Time Zone Lvl 1. By pressing the key several times in succession, user-friendly set of nets can be drawn by the indicator on the chart - for example, all three at once - Fibonacci Expansion , Fibonacci Retracement , Fibonacci Time Zone.
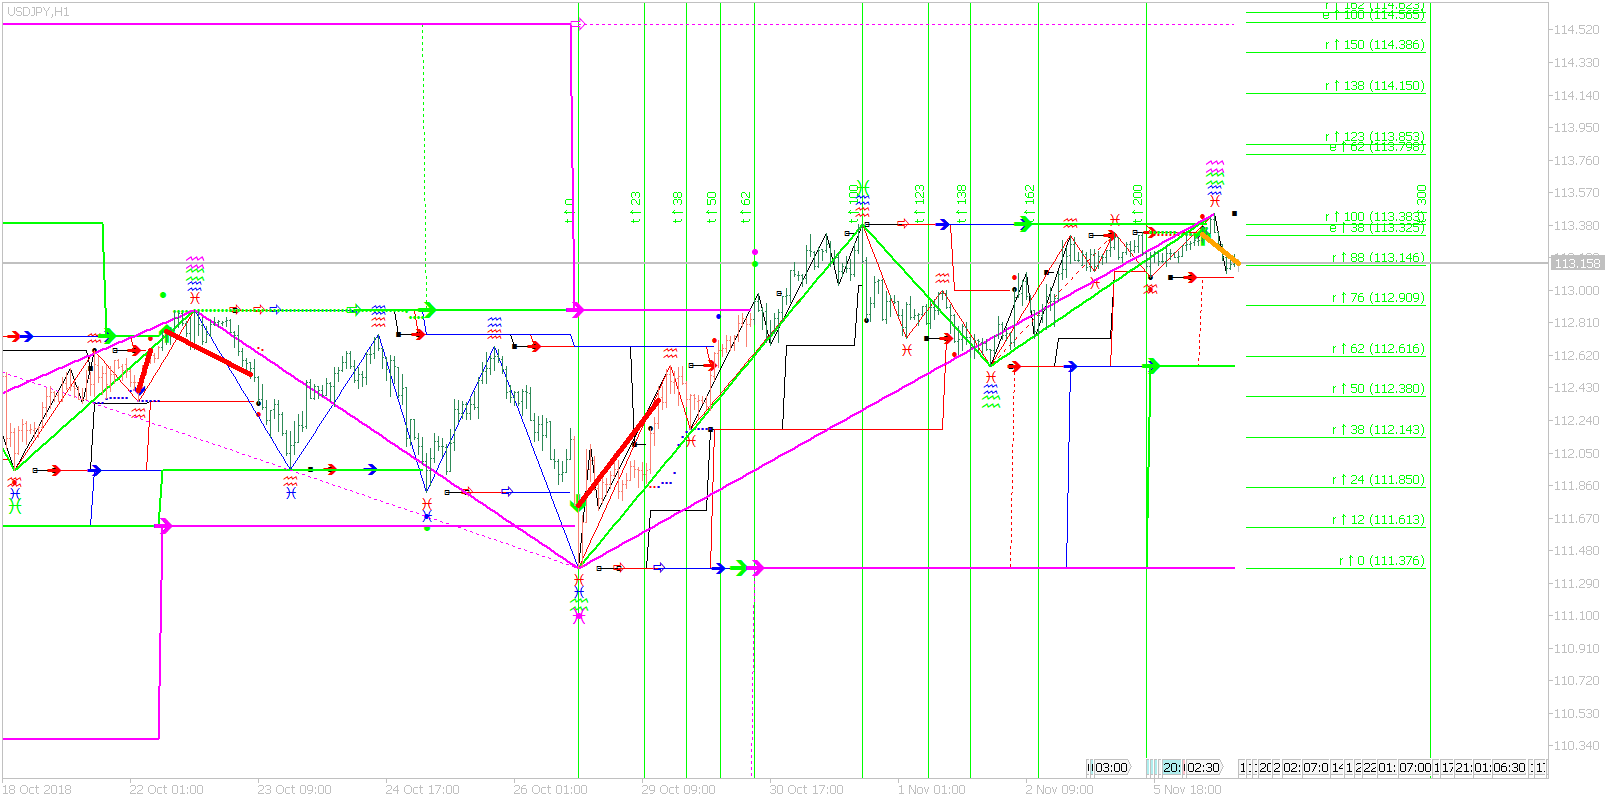
An example of a Trend wave A Lvl 3 (green) up, which is completed. After this comes a Rollback Wave B, and after the Rollback a new Trend Wave C is up. All three Fibonacci Nets are drawn on A Wave - Expansion (e) , Retracement (r), Time Zone (t) .
` - Pressing the key which is to the left of the numpad 1 on the keypad, switches control of numbers 1 - 9. Now, pressing any key 1 - 9 hides / shows 3PointsChannel level Lvl, corresponding to the pressed key. Pressing the button ' returns the switch to the previous mode - Key 1 - 9 hide / show grid Fibonacci.
The indicator is published on the market https://www.mql5.com/en/market/product/33478


")
![[XAUUSD]: Weekly Liquidity Activation Points (timings), June 22-26, 2026](https://c.mql5.com/6/1013/splash-preview-771790.png "[XAUUSD]: Weekly Liquidity Activation Points (timings), June 22-26, 2026")
")