
Self-testable and self-optimizable indicator Matreshka Part 1
Self-testable and self-optimizable indicator Matreshka:
1. Is an interpretation of the Elliott Wave Analysis Theory.
2. Based on the principle of the indicator type ZigZag, and the waves are based on the principle of interpretation of the theory of DeMark.
3. Filters waves in length and height.
4. Draws up to six levels of ZigZag at the same time , tracking waves of different orders.
5. Marks Pulsed and Recoil Waves.
6. Draws arrows to open positions
7. Draws three channels.
8. Notes support and resistance levels.
9. Draws three types of Fibonacci nets.
10. Redraws only the cost on the newest bar, except for the Fibonacci Extension net.
11 . It has the ability to simulate trade in test and operating modes, as well as has the ability to self-test and self-optimization.
12. Contains Money Management
Reference terminology indicator
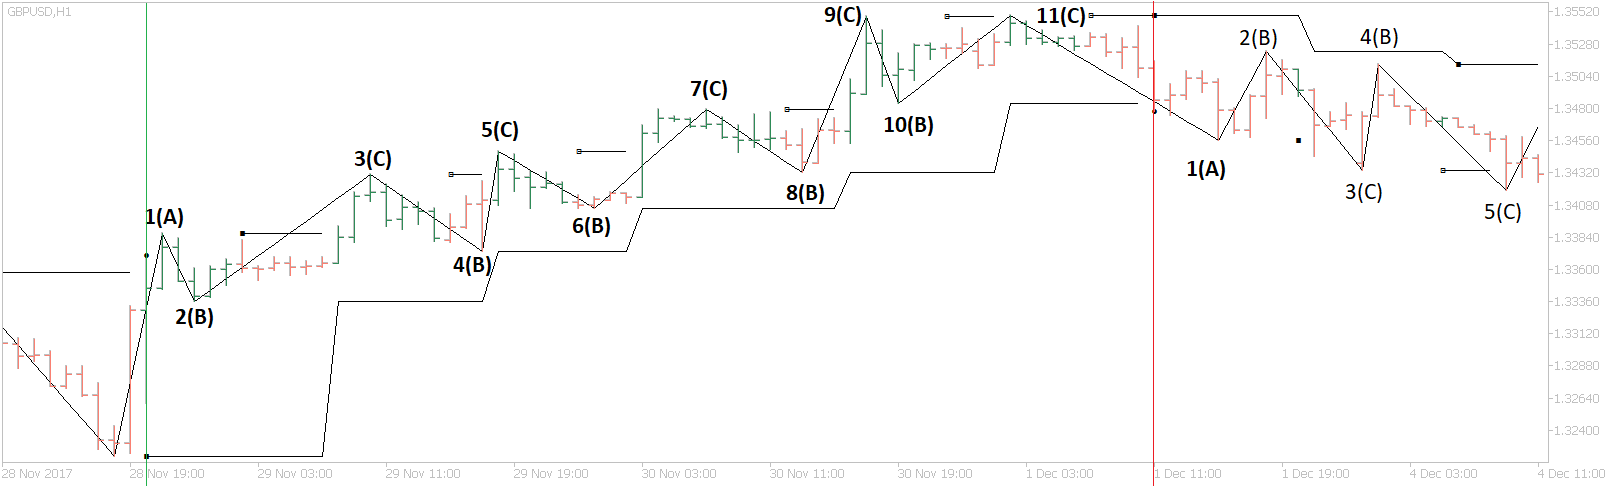
Wave - A model of directional price movement in the Forex market according to the "law of the waves" R. Elliot. On the chart, the waves are marked with black ZigZag lines. Horizontal lines indicate the moment in time when the wave was completed, as well as the price of the end of the wave (Extremum price)
Extremum - maximum or minimum prices in range of time. May be the beginning or end of a wave. Maybe the High price or the Low price of any bar.
Impulse / Impulse waves - those waves that are in the direction of the Trend. Each wave can be the first, third, fifth, etc. by wave count or A wave,C wave, new C wave, new C wave, etc. On the chart screenshot, each wave is marked at its end.
Rollback / Rollback Waves - waves that go against the Trend. There may be second, fourth, sixth, etc. by wave count or B wave, new B wave, new B wave, etc.
Impulse / Rollback wave structure - the wave structure is determined by the indicator parameter ImpulsivityDeviation
Trend - Trend Up begins when another wave of a previous wave breaks through, ends when any wave of a previous wave breaks through. On the chart, the bar on which the indicator determined that Trend Up has started is marked with a green vertical line. Trend itself began with an Extremum two bars before. The bar on which the indicator has determined the end of the Trend, is marked with a vertical red line. End of the Trend Up is a few bars before that - on the Wave 11 Extreme bar (C). End Trend Up indicates the beginning of the Trend Down and vice versa.
Lvl / Level - all waves that are built by the indicator, have a Level. The older the Level (Lvl), the greater the values of the parameters used to build the indicator. For example, when Lvl = 1 a ZigZag will be build with the parameter DemarkPeriod = 5, then at Lvl = 2 the indicator may use DemarkPeriod=10.
Last Lvl / Level - parameter indicates the amount of levels, which will be built.
Channel - there may be a single line plotted on a chart, breaking through which can lead to the opening / closing of a position. The same channel can be two lines, and the current chart price will be between them
Position - an order - buy or sell.
Opening a position - the indicator gives signals for opening a position - i.e. market entry - i.e. It sends a signal to an order to buy or sell.
1. Parameters of the Wave Options indicator :
1.1 DemarkPeriod - DeMark Wave Period
Every wave starts and ends at an extremum - maximum or minimum of the price in a time range. The beginning of a wave can be a bar, whose low price is minimal among the N bars before and after this bar. For example - if the price Low of any bar is the minimum for the next five bars and previous five bars, this bar can be the beginning of a wave with a period equal to Demark 5 . The principle of wave termination is mirrored, i.e. a bar that has a High price, which is maximum for the next five bars and for the five bars before that can be the start or an end of a wave.
Also a start or an end of a wave can be a sharp breakthrough of the beginning of the previous wave .
Horizontal lines indicate the moment in time when the wave was completed, as well as the price of the end of the wave. The point at the beginning of the horizontal line shows that the wave that starts can be a B wave to the one that has ended.
HeightCoefficient 1.2 - indicator can filter the waves not only by time, but also by price. If HeightCoefficient > 0, the indicator calculates:
1. For each bar the value Difference = High - Low.
2. Coefficient = The sum of all Difference values divided by the number of bars.
3. Difference ( average ) = High - Low of the average bar of the chart.
The wave will not be over as long as the price does not decrease or increase by Difference (average) pips from the extremum, or breaks the previous extremum .
The indicator is published on the market https://www.mql5.com/en/market/product/33478


")
")
