FourierExtrapolationMAFree
- インディケータ
- バージョン: 1.0
This is a free version and is forecasting only 5 bars
The FourierExtrapolationMAFree indicator transforms and extrapolates the Moving Average function by the Fast Fourier Transformation method.
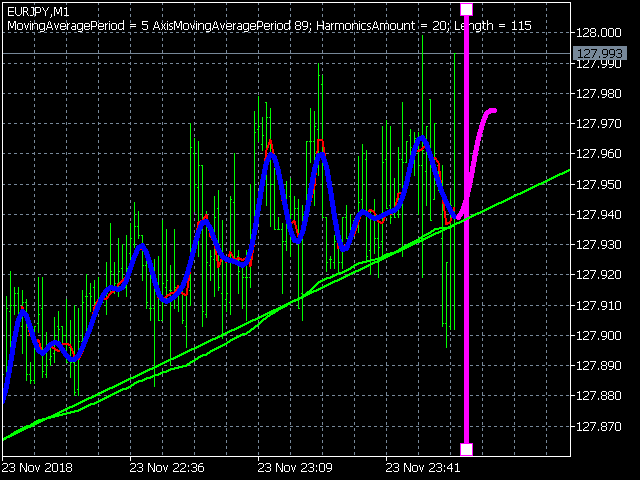
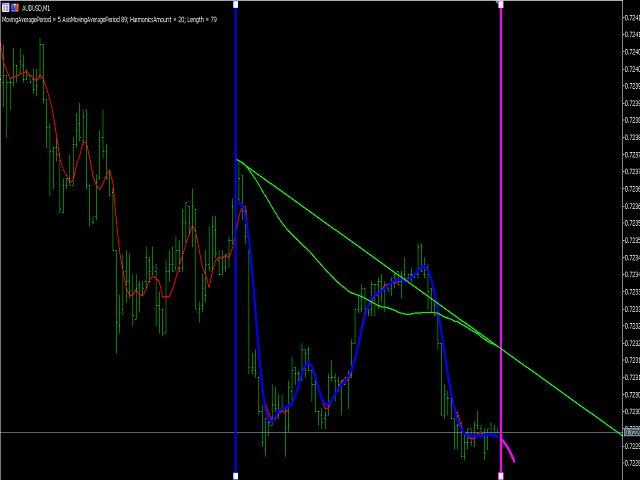
1. The transformation period is set by two vertical lines, by default the first blue line and the second pink.
2. By default, the Moving Average (MA) line is drawn in red.
3. By Fourier Transform, the indicator builds a model of N harmonics, which is as close as possible to the MA values. The model is drawn by default in blue over the MA for the period between the two vertical lines set by the user.
4. For the period after the second vertical line, the indicator draws a line Fourier Extrapolation model - predicts the probable movement of the Moving Average line. The line predicts the default movement of pink.
5. The trend green line, which begins with the left vertical blue line, is the axis along which the harmonics are calculated, transformed and extrapolated. The initial and extreme prices of the Axis are equal to the initial and extreme values of green MA. Green MA is drawn only between the blue and pink vertical line. The goal is to find the slope of the market.
https://charts.mql5.com/19/631/gbpusd-h4-robomarkets-ltd.png
Indicator parameters:
MovingAveragePeriod - Period of Red Moving Average
AxisMovingAveragePeriod - Period of Green Moving Average, Responsible for the Slope of the Axis
InputBar - the bar on which the vertical pink line is drawn, after which the pink predicted line is drawn
Harmonics Amount - the number of harmonics with which the Fourier Transformation model is built.
Length - the distance between two vertical lines, the period for which the Fourier Transform model is built.
AllowComment - if true, the indicator writes the actual parameters of the indicator in the upper left corner of the chart.
Hotkeys:
The user can change the parameters of the indicator after initialization through the keyboard keys. This allows you to configure the indicator without re-initialization. When you press different keys, different parameters change in real time.
Z - when pressed, the left (blue) vertical line moves to the left by 1 bar;
X - when pressed, the left (blue) vertical line moves to the right by 1 bar;
C - when pressed, the right (pink) vertical line moves to the left by 1 bar;
V - when pressed, the right (pink) vertical line moves to the right by 1 bar;
B - when pressed, the left (blue) and right (pink) vertical lines move to the left by 1 bar;
N - when pressed, the left (blue) and right (pink) vertical lines move to the right by 1 bar;
M - when pressed, reduces the number of Harmonics used for the Fourier Transform;
, - when clicked, increases the number of Harmonics used for the Fourier Transform;
. - when pressed, decreases the MA period by 1;
/ - when pressed, increases the MA period by 1;
K - when pressed, moves the beginning of the Trend line. Axis up by 10 pips.
L - when pressed, moves the beginning of the Trend line. Axis down by 10 pips.
; - when pressed, moves the end of the Trend line Axis up by 10 pips.
- when pressed, moves the end of the Trend line Axis down by 10 pips.

bien