
Self-testable and self-optimizable indicator Matreshka Part 3.1
3.4 OpenChannel
The OpenChannel channel is always drawn on the graph. Breaking the channel by the price is marked by an arrow in the direction of breaking through and is a signal to open a position. To draw a channel and a signal to open a position, it is necessary to observe a number of conditions:
1. The channel is drawn only at the Rollback Waves of a Trend of any level. The breaking of the channel in the Rollback Wave gives an early signal about the completion of the current wave and the beginning of a new Trend Wave, respectively, indicating a continuation of the movement along the Trend .
2. The channel is drawn for all levels (Lvl) of the indicator, except for level 0 and the last one specified as an indicator parameter. For example, if an indicator with the parameter Lvl = 5 is installed on a chart, the chart will show the channels of all levels except levels 0 and 5;
3. The channel is drawn only if the Trend of this level goes in the direction of the Wave of the Last Level (Lvl) specified by the Lvl parameter , i.e. waves of the highest level . For example, if an indicator with the parameter Lvl = 5 is installed on a chart, channels in Trends that go towards the current wave Lvl = 5 will be displayed on the chart . If the wave Lvl = 5 goes down, the chart bars are colored in red, if up - green .
4. Filters installed in the Synthesis Options section should allow the opening of a position, respectively, allow the construction of the channel. For example, if the parameters CompareWaveBHeights = true, CompareWaveBLenghts = false and ImpulsivityDeviation = 1 are set, the channel will be built only at those Trend waves that meet the conditions of these two filters, not taking into account the filtering CompareWaveBLenghts ;

Indicator with the parameter Lvl = 3 ; There is a Green Wave Lvl = 3 down, the bars are repainted in red. OpenChannel for Lvl = 2 is depicted with a blue dotted line in blue Recoil waves, when the channel is broken through, a blue arrow is drawn in the direction of the breaking through with the price.
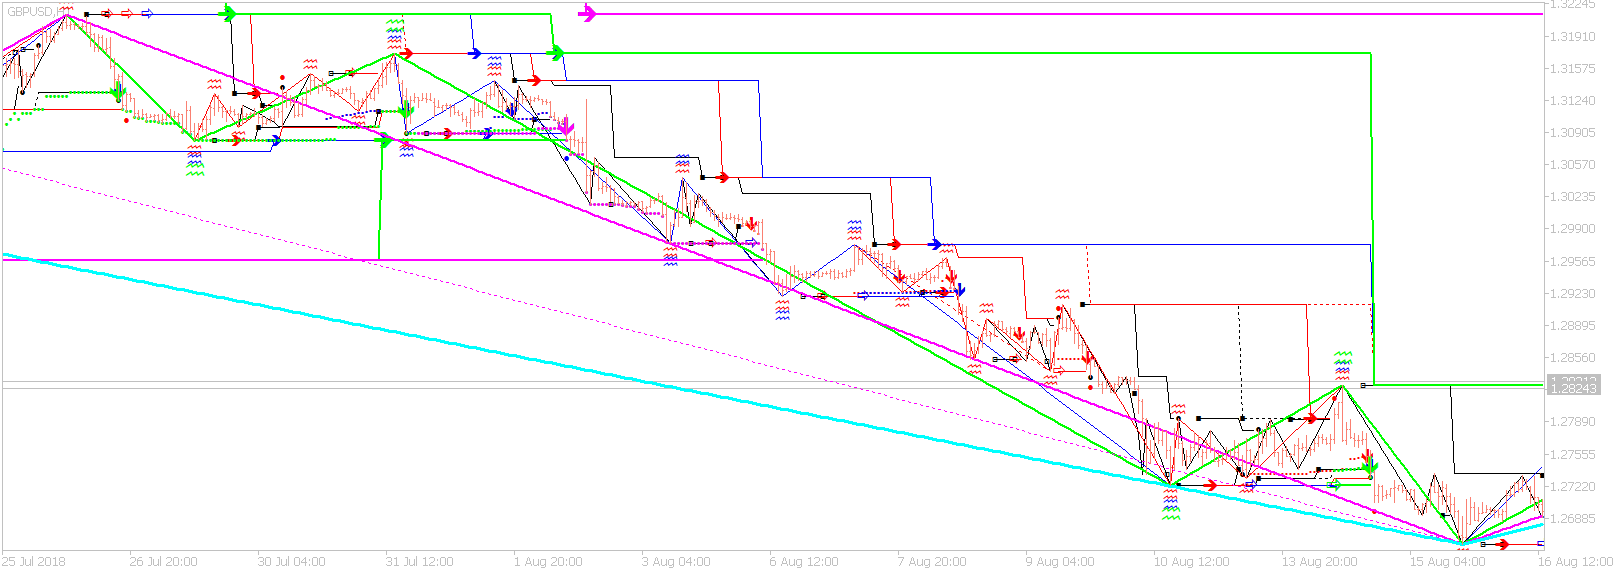
The indicator with the Lvl = 5 parameter. The light blue wave is going down, the bars are colored red. OpenChannel channels are visible, dotted in the colors of the corresponding levels. When channels are broken through, arrows are drawn showing the beginning of movement towards the wave Lvl = 5 (light blue color)
To construct the channel, the channels SimpleChannel and WPRChannel described above are used.
1.SimpleChannel is built in a standard way on a Rollback wave.
2.The period of the WPRChannel channel changes as the wave lengthens and is calculated by the following formula
Period = (Wave Length in Bars) / 3
Where the Wavelength represents the length of the Rollback Wave in bars at the current moment. The length is divided into three, because the goal of the indicator is to establish the end of the third sub - wave in the Rollback Wave.
3. From the values of two channels, the closer to the price channel is taken, i.e. if the Rollback wave goes down, the smaller value of the two channels is taken, if up - the larger value of the two channels.
3.5 3PointsChannel
Channel 3PointsChannel by default is not drawn on the chart. The principle of construction - a channel with lines of maximum and minimum is built on top of any number of bars so that the bars touch the maximum and minimum of the channel no more and no less than three points. The name of the indicator follows from this principle.
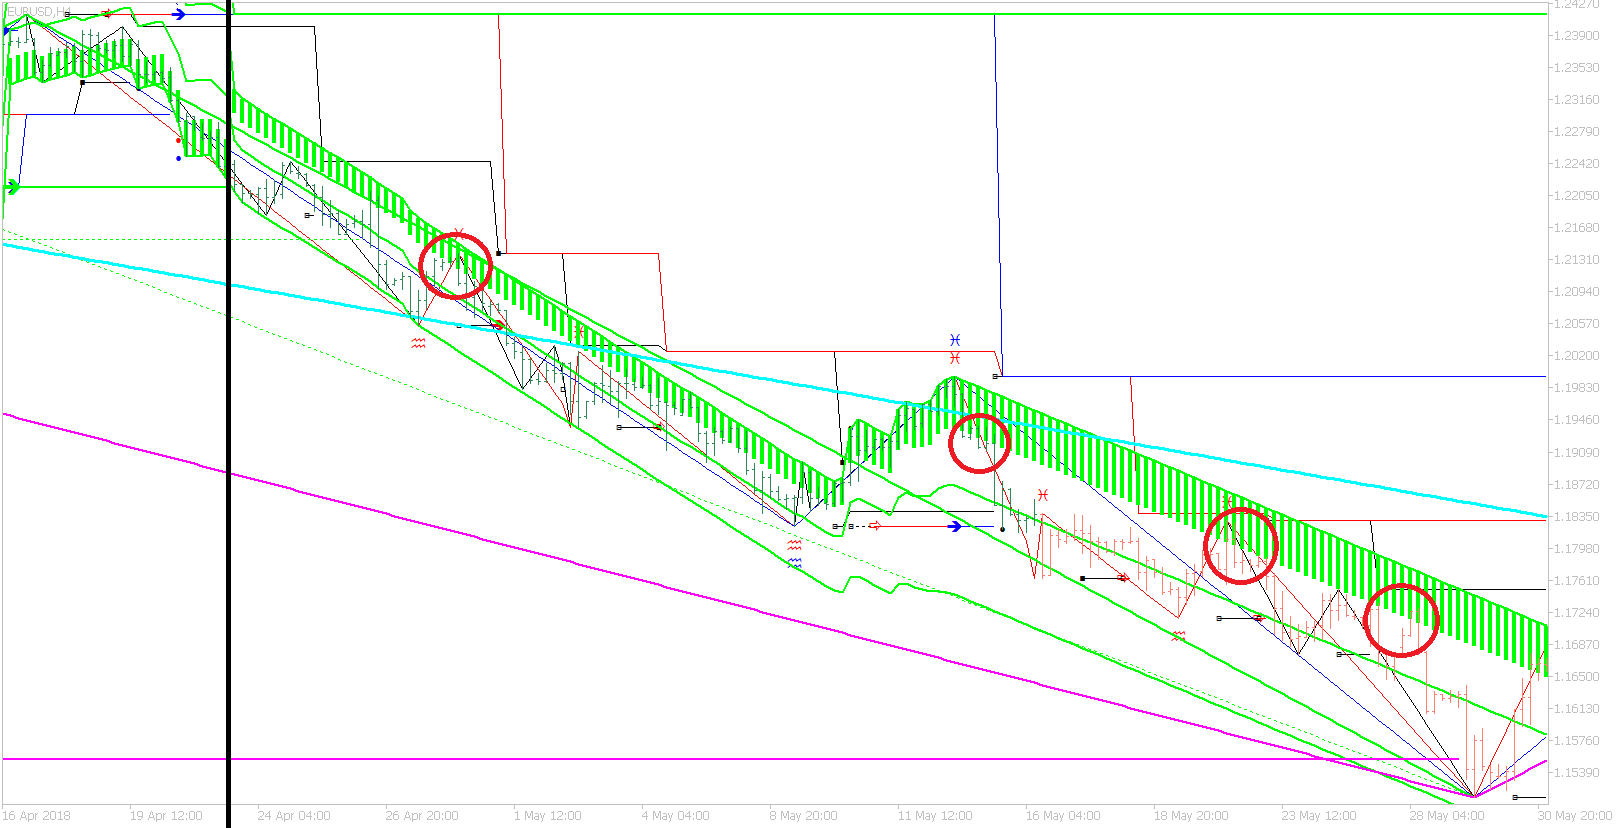
The vertical black line marks the beginning of the wave Lvl = 3 (green). Red circles mark bars entering the zone between 76.4% and 100%, which is marked by thickened green bars. The same bars do not touch the upper edge of the channel (100%), and their Low price is below the level of 76.4%, which may be a signal to sell.
4. Parameters of the Take Profit Options indicator :
4.1 TakeProfitFirstIndex
If the indicator has given a signal to open a position, then it can be closed upon reaching one of the TakeProfit levels. The TakeProfit levels correspond to the levels of the Fibonacci Expansion Net embedded in the MetaTrader 5 Terminal. For each pair of waves, Trend - Rollback , after which the indicator gives a position open signal, a Fibonacci Expansion Net is built with the following parameters:
1. The first net point is the beginning of the trend wave.
2. The second point of the Net is the end of the Trend Wave, it is also the beginning of the Rollback Wave .
3. The third net point is the end of the Rollback wave. Since the signal to open a position often appears before the end of the Rollback, the Third net point may change if the Rollback continues.
4. The indicator redraws only the Third Fibonacci Expansion point.
5. The Fibonacci Expansion grid is built with the following levels / coefficients - 0.382,0.618,1,1.382,1.618,2,2.382,2.618, the price of each level is displayed to them

Fibonacci Expansion Lvl = 2 blue and Lvl = 3 green. For each grid, the first and last points are marked with vertical lines. Fibonacci Expansion levels are drawn after the last / newest bar.
The parameter of the TakeProfitFirstIndex indicator indicates at what level of the Net the TakeProfit level will be set. The higher the value of TakeProfitFirstIndex, the further the Fibonacci Expansion level from the Open price is. Examples:
1.If TakeProfitFirstIndex = 0: When the price grows up, TakeProfit will be set to the first possible level closest to the open price of the position, but not lower than the maximum of the Trend Wave on which the Net is built.
2.If TakeProfitFirstIndex = 1, TakeProfit will be set to the next level of the Grid, etc.
3.If the value of TakeProfitFirstIndex does not correspond to any level/Lvl coefficient, TakeProfit will not be set. The TakeProfitSecondIndex works identically, it refers to the second position that the indicator opens.
4.2 AllowNoLoss
If AllowNoLoss = true, then upon reaching the level set by TakeProfitFirstIndex , the indicator gives a signal to move the StopLoss level of the second position to the opening level of the same position (Breakeven Level). Thus, if the price returns to the opening price of the Position, the Position will be closed with Profit = 0.
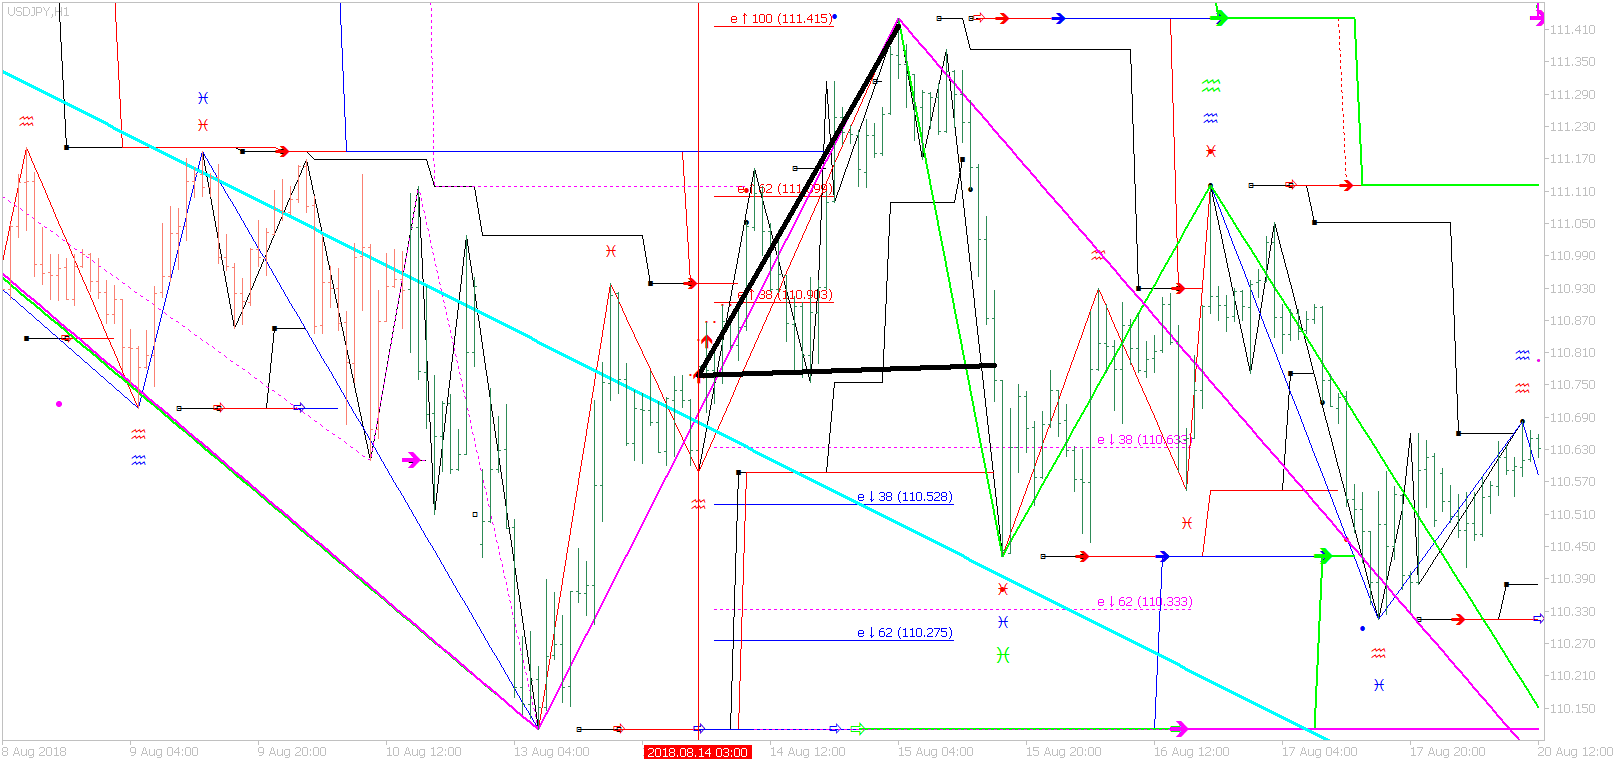
Red vertical line shows the moment of opening two positions. TakeProfitFirstIndex = 1, therefore the TakeProfit level of the first position will be the second goal after the top of the Trend Wave on which the Fibonacci Expansion Net is built. Upon reaching the goal, the first position is closed. Since the StopLoss of the second position is lower than the opening price, it is transferred to the opening level of two positions.
To be continued.
The indicator is published on the market https://www.mql5.com/en/market/product/33478


")

