Orderflow Absorption MT5
- インディケータ
-
Chi Sum Poon
 This is Gary Poon
I will first study of trading on demo account then to real account.
This is my only account on MQL5.com, I will not create another one for now.
If there are any queries or concerns, please refer to the broker details from my signals.
Thank you. - バージョン: 1.3
- アップデート済み: 17 12月 2025
- アクティベーション: 5
OrderFlow Absorption – MT5用プロフェッショナル・デルタ&アブソープションシグナルインジケーター
OrderFlow Absorptionで本物のオーダーフロー分析の力を解き放ちましょう。MetaTrader 5向けの究極のデルタヒストグラム&アブソープションシグナルインジケーターです。あらゆる価格変動の裏側で何が起きているのかを知りたいトレーダーのために設計されており、市場を動かす隠れた買い/売り圧力や吸収イベントを明らかにします。
特徴
- デルタヒストグラムの可視化: 買い圧力・売り圧力を色分けされたヒストグラムで即座に表示。
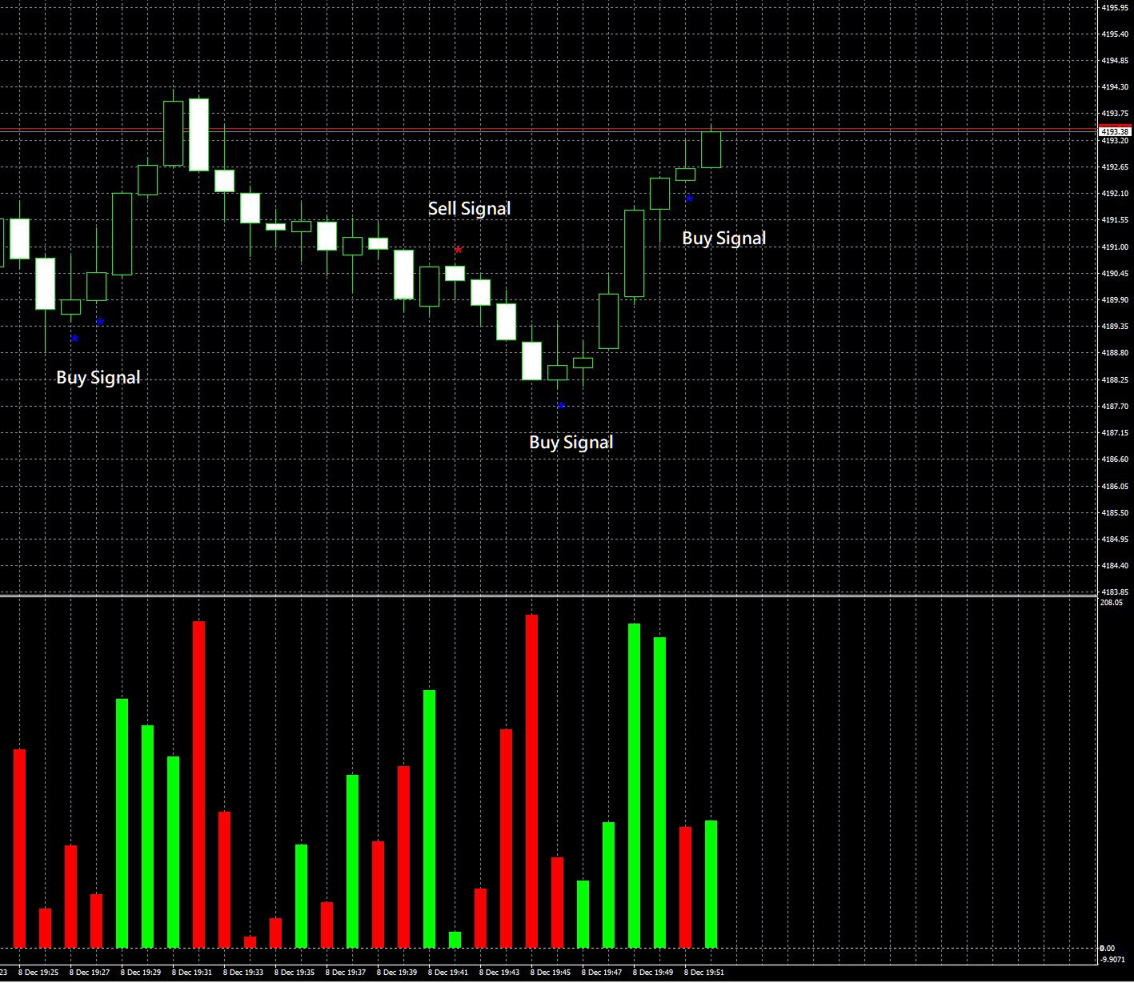
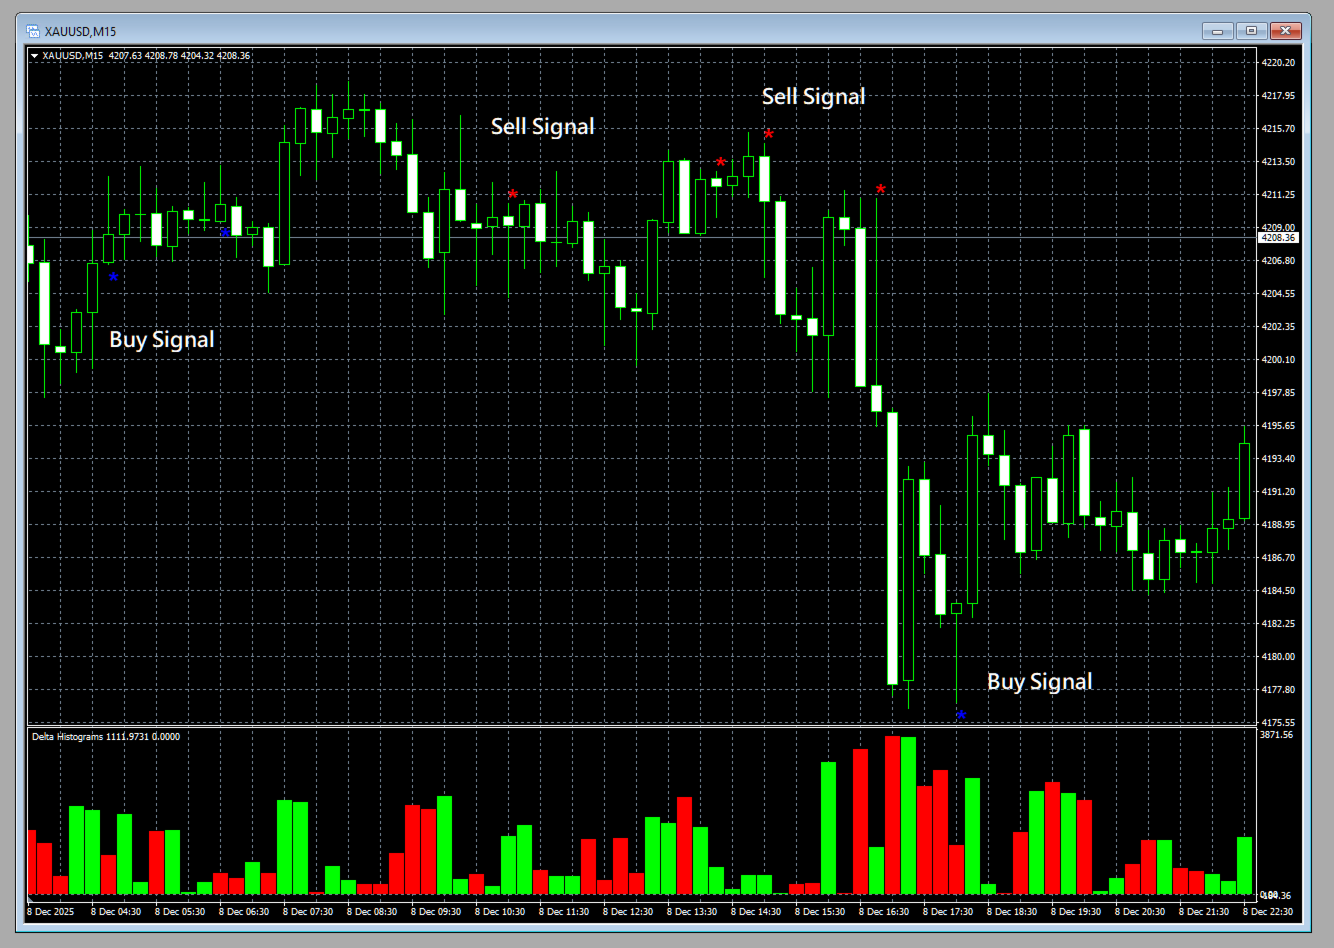
- アブソープションシグナル検出: 高度なロジックで強気・弱気の吸収イベントを特定し、反転の兆しを早期に通知。
- チャートマーカー: 吸収シグナルをチャート上に直接マークし、視覚的に分かりやすく表示。
- ポップアップアラート: 新しい吸収シグナルが出現した際にリアルタイムで通知。
- カスタマイズ可能な閾値: 弱いシグナルを除外し、高確率のセットアップに集中。
- リソース管理: 大きなチャートでも高速に動作する効率的な計算。
- 全ての銘柄に対応: Forex、指数、コモディティなど、どんなシンボル・時間足でも利用可能。
- 簡単な導入: シンプルなパラメータで素早く設定・調整。
OrderFlow Absorptionのロジック
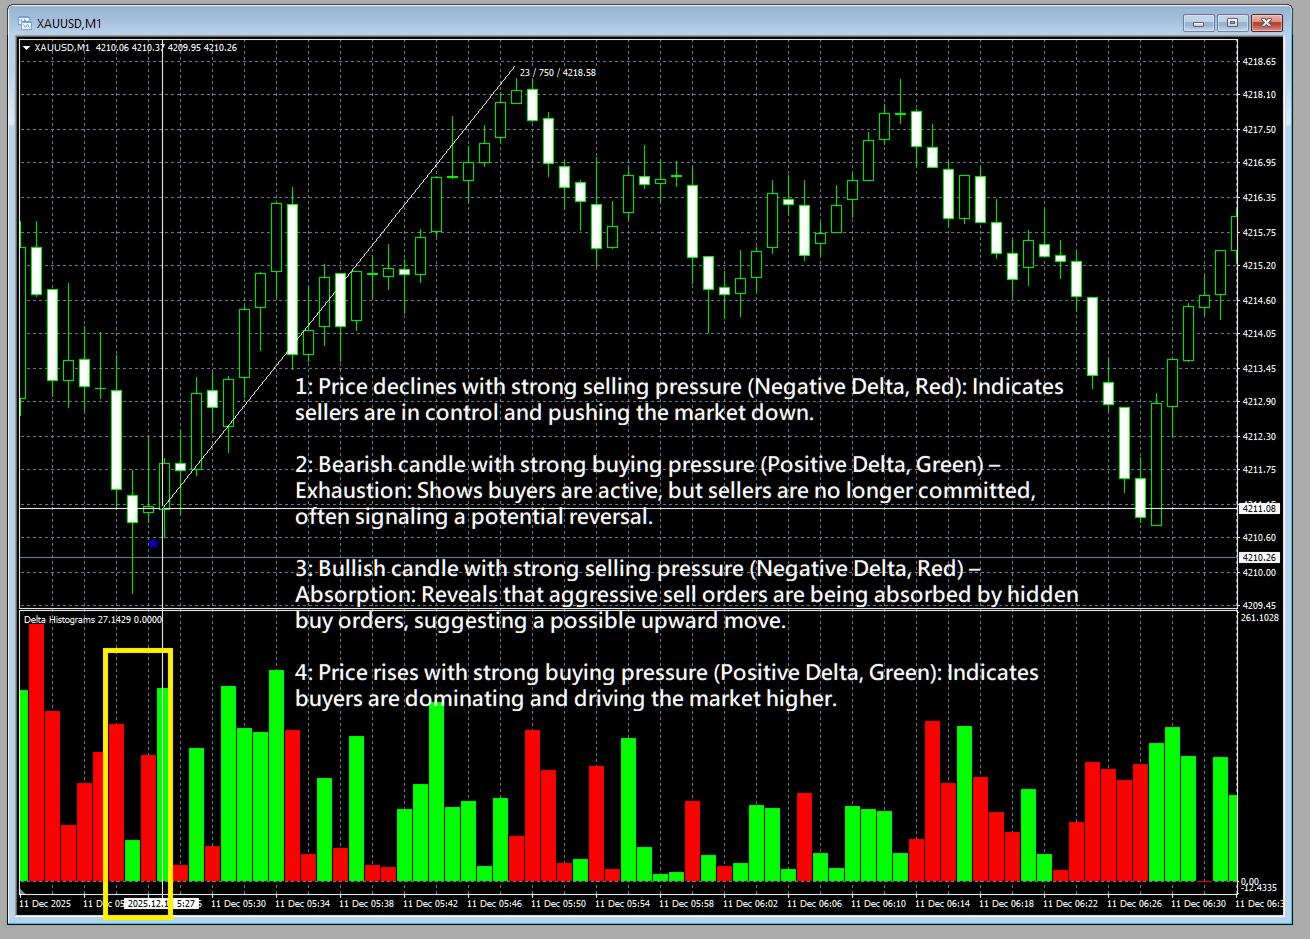
OrderFlow Absorptionは独自アルゴリズムを用いて、ティックデータが完全でないブローカーでも各バーの買い・売り圧力(デルタ)を推定します。出来高、価格アクション、ローソク足構造、ヒゲの長さを分析し、隠れた吸収イベント(大口注文による買い・売りの吸収)を検出。これらはしばしば反転や強い動きのサインとなります。
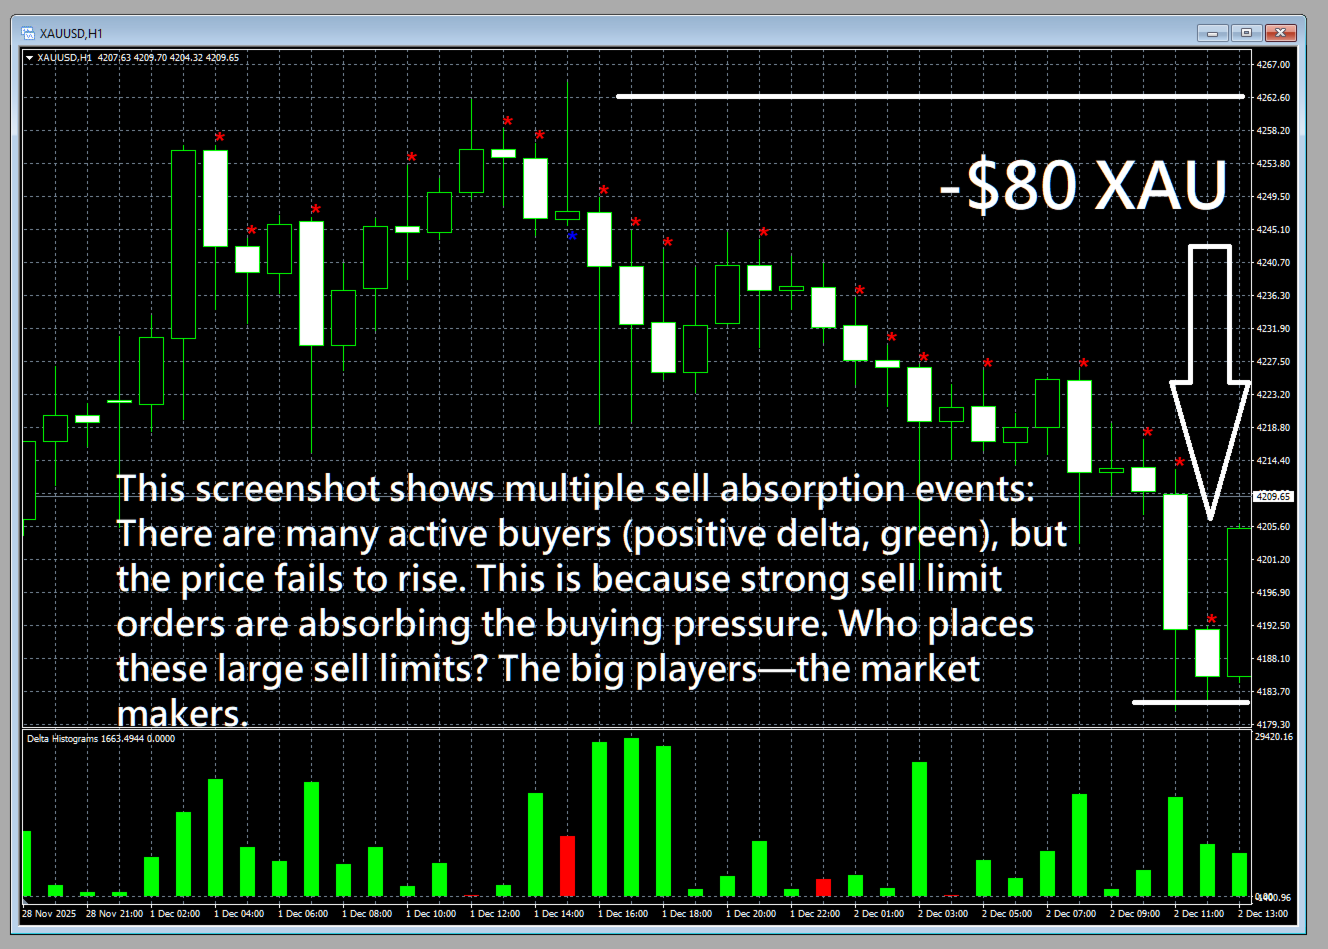
- ベアリッシュアブソープション: 強い買い圧力(正のデルタ)があるのにローソク足が陰線で終わる場合、売り手が買いを吸収したことを示します。
- ブルリッシュアブソープション: 強い売り圧力(負のデルタ)があるのにローソク足が陽線で終わる場合、買い手が売りを吸収したことを示します。
これらのシグナルはチャート上にマークされ、即時アラートも可能なので、重要な市場イベントを見逃しません。
使い方
- インジケーターを追加: OrderFlow Absorptionを任意のチャート・時間足にセット。
- 設定を調整: 好みのデルタ閾値や分析バー数を設定。
- ヒストグラムを観察: 緑は買い圧力、赤は売り圧力を示します。
- 吸収シグナルを探す: チャート上の「*」マークが吸収イベント。ポップアップアラートで即時通知。
- 賢くトレード: 吸収シグナルで反転を察知、エントリー確認、ダマシ回避に活用。
今すぐお試しください – デモ版をダウンロード!
OrderFlow Absorptionのパワーをぜひご自身で体験してください。無料デモをダウンロードして、トレードがどう変わるか実感しましょう。隠れた市場チャンスを見逃さず、今すぐOrderFlow Absorptionをあなたの武器に加えてください!
OrderFlow Absorption – 市場の本当の意図を見抜く。デモをダウンロードして、自信を持ってトレードしましょう!

Simply amazing! It help me with easiest ways to understand the behavior of the movement of big player!