
Self-testable and self-optimizable indicator Matreshka Part 4
5. Parameters of the Object Options indicator :
5.1 ObjectsStartBar
The indicator has the ability to draw all Objects on any bar of the chart. List of MetaTrader Objects used by the indicator:
1. Fibonacci Expansion Nets
2. TrendLines
3. SRLines (Support and Resistance Lines)
If ObjectsStartBar = 0, all objects are drawn on the latest, newest bar of the chart. The value of ObjectsStartBar sets the shift of the initial bar back in time, the indicator will draw objects that were relevant to the point in time designated by the initial bar.
For example, the Fibonacci Expression Net with ObjectsStartBar = 20 will show the Net, which was relevant 20 bars ago. ObjectsStartBar allows you to see how the Net was built and whether Net levels were reached by subsequent bars.
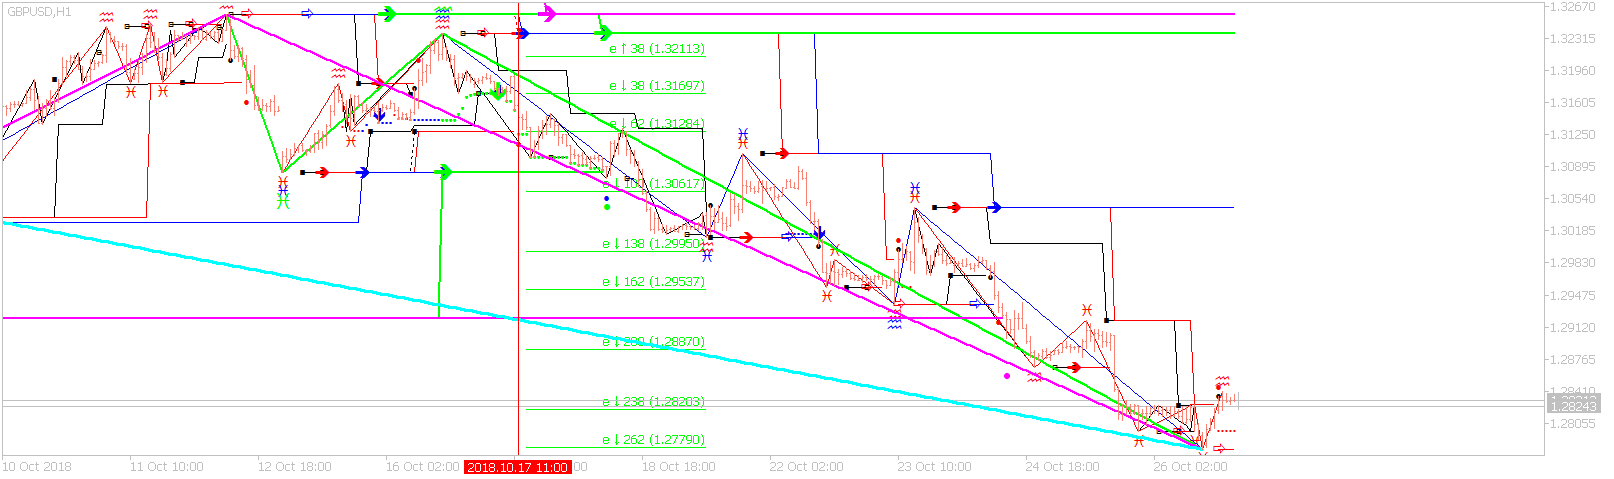
The indicator with the parameter ObjectsStartBar = 180, bar is marked with a vertical red line. The net that was relevant at that time is drawn to the rigth of the vertical red line.
5.2 AllowTrendLines
If the value AllowTrendLines = true indicator draws a line through the Extremums of the ZigZag. The lines connect every two consecutive top extremums of the ZigZag-a and every two consecutive bottom extremums of the ZigZag-a. After building the line, the indicator draws “Ray” to the right, forward in time. The ray is an assumed resistance / support level, the level which the price tends to reach. The indicator draws lines for all levels (Lvl), all lines are drawn after the start of the latest, newest wave of the Last level Lvl.

Indicator with parameter AllowTrendLines = true
5.3 AllowSRLines
If AllowTrendLines = true, the indicator draws horizontal lines. At the completion of any wave of any level, the indicator draws a horizontal line at the price level of the extremum end of the wave - if the wave went up, at the level of the wave maximum, if down - at the level of mimimum. Drawn levels of different levels (Lvl) show different levels of Resistance / Support. The bigger the level of the Resistance / Support line, the more likely it is that the price will tend to this line.
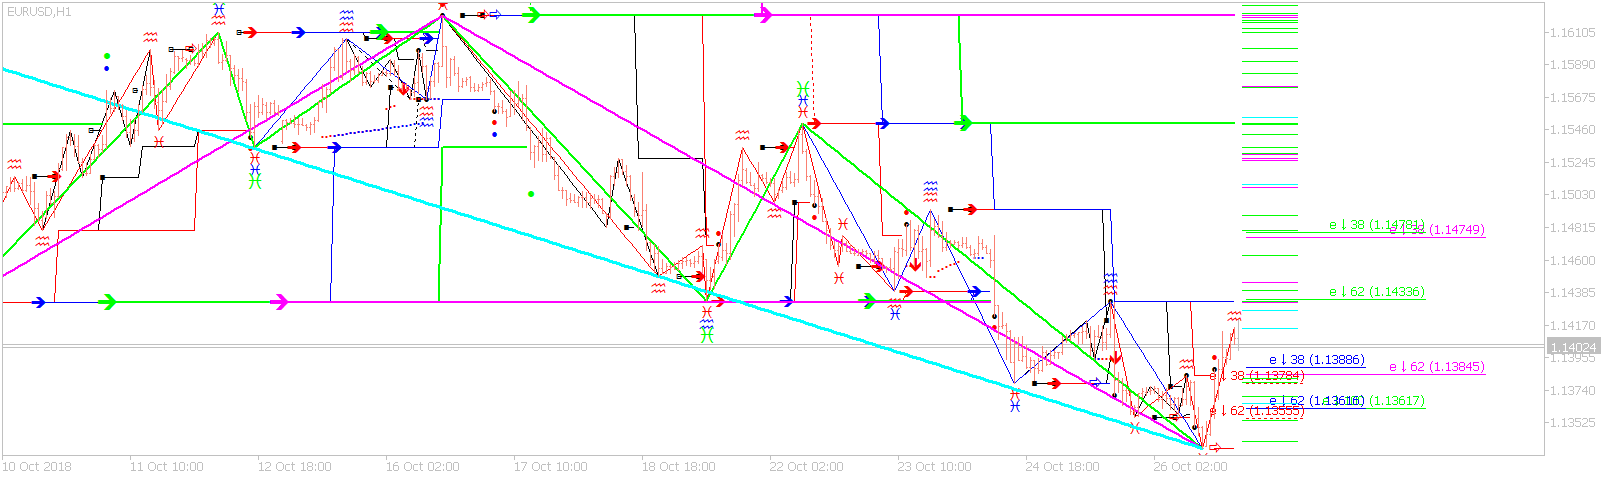
Indicator with parameter AllowSRLines = true. Resistance / Support Levels are marked by short horizontal lines to the right of the last bar, along with Fibonacci Expansion Net.
6. Parameters of the Trading Options indicator :
6.1 AllowTrade
If AllowTrade = true The indicator uses the built-in trading simulator on historical data and new bars. During initialization, the indicator performs all calculations from the oldest to the newest bar. Basic principles of the Trading Options module :
1. When a down or up arrow appears, the indicator simulates opening a position, calculates the position volume and sets TakeProfit and StopLoss.
2. The TakeProfit level is set by the parameters TakeProfitFirstIndex and TakeProfitSecondIndex.
3. The StopLoss level is tracked by the AllowSimpleChannel, AllowSqueezeChannel, and AllowWPRChannel parameters.
4. The indicator draws a line from the moment of opening a position to the moment of closing, just as MetaTrader draws a line for each order from the moment of opening to the moment of closing. If the order brings profit, the line is black, if not - red .
5. The indicator draws orders for historical data, as well as in real time at the latest, the newest bar.

An example of the work of opening a position and the subsequent closing by TakeProfit or StopLoss.
6.2 StartBalance
When StartBalance = 0, the balance of the Account connected to the MetaTrader platform is taken. If StartBalance > 0, the indicator sets this value as the initial balance before the indicator is calculated.
6.3 PercentagePerOrder
The indicator calculates the volume of every opened position - Lot:
1. Indicator takes balance
2. Indicator calculates the positon's lot which is required in order to increase the deposit by PercentagePerOrder percents, as soon as the TakeProfit level is reached .
3. If TakeProfit is reached, for the next position indicator repeats step 2
4. If not, the next position has the Lot required to increase the deposit by x + 1% of the initial deposit amount, where x is the amount of lost closed positions after the last profitable
5. If TakeProfit is reached, step 2 is repeated, if not - step 4
The indicator is published on the market https://www.mql5.com/en/market/product/33478


")