ADR Active
- インディケータ
- バージョン: 4.80
- アップデート済み: 13 2月 2026
- アクティベーション: 20

アダプティブADR
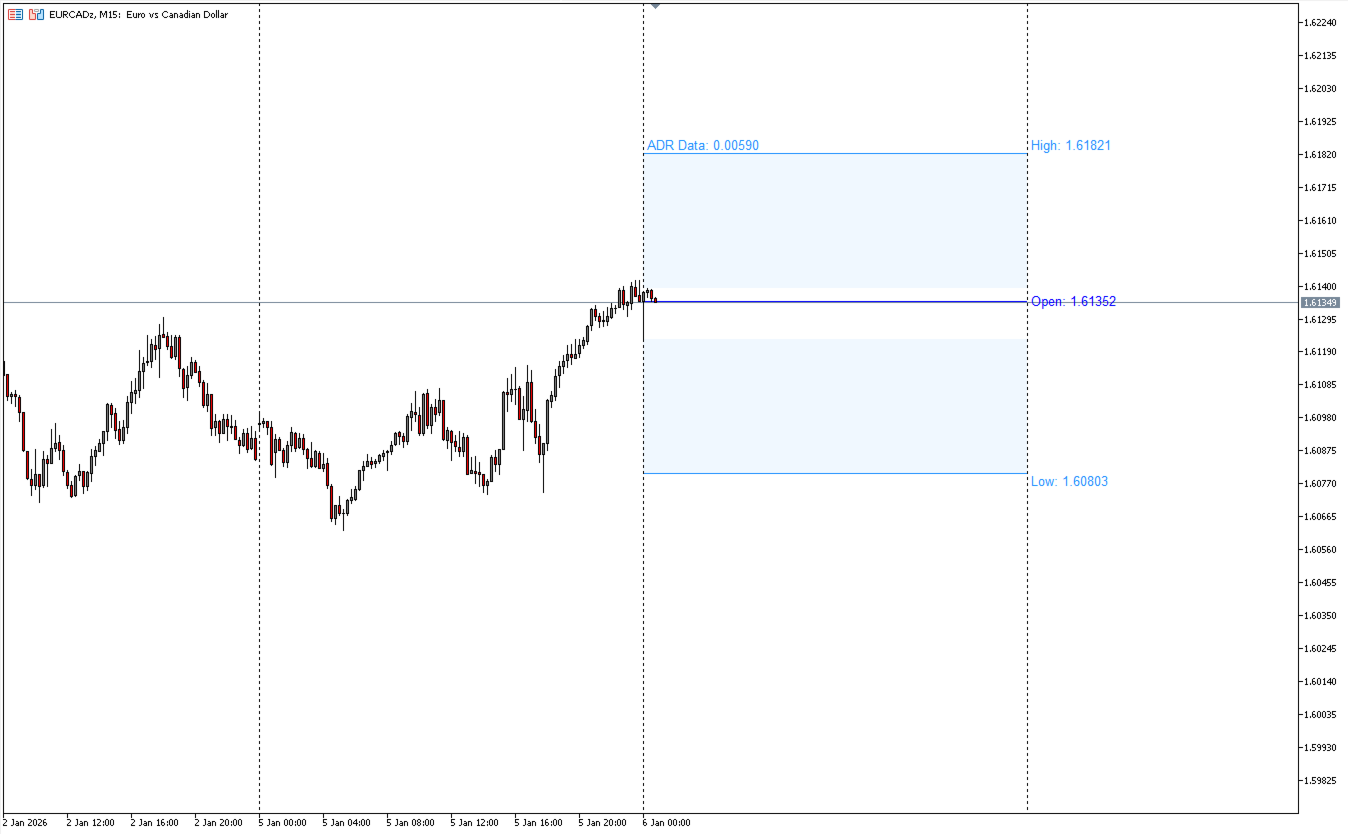
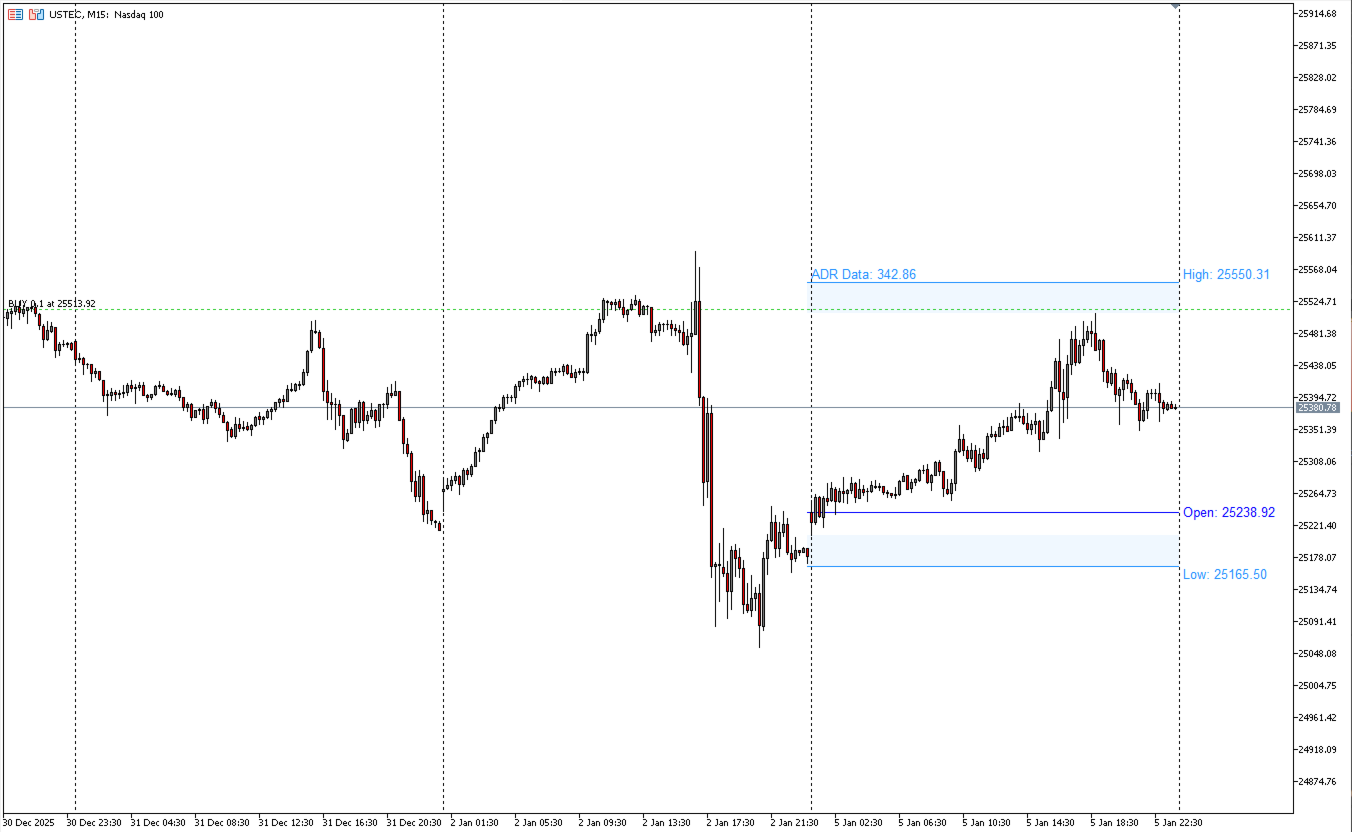
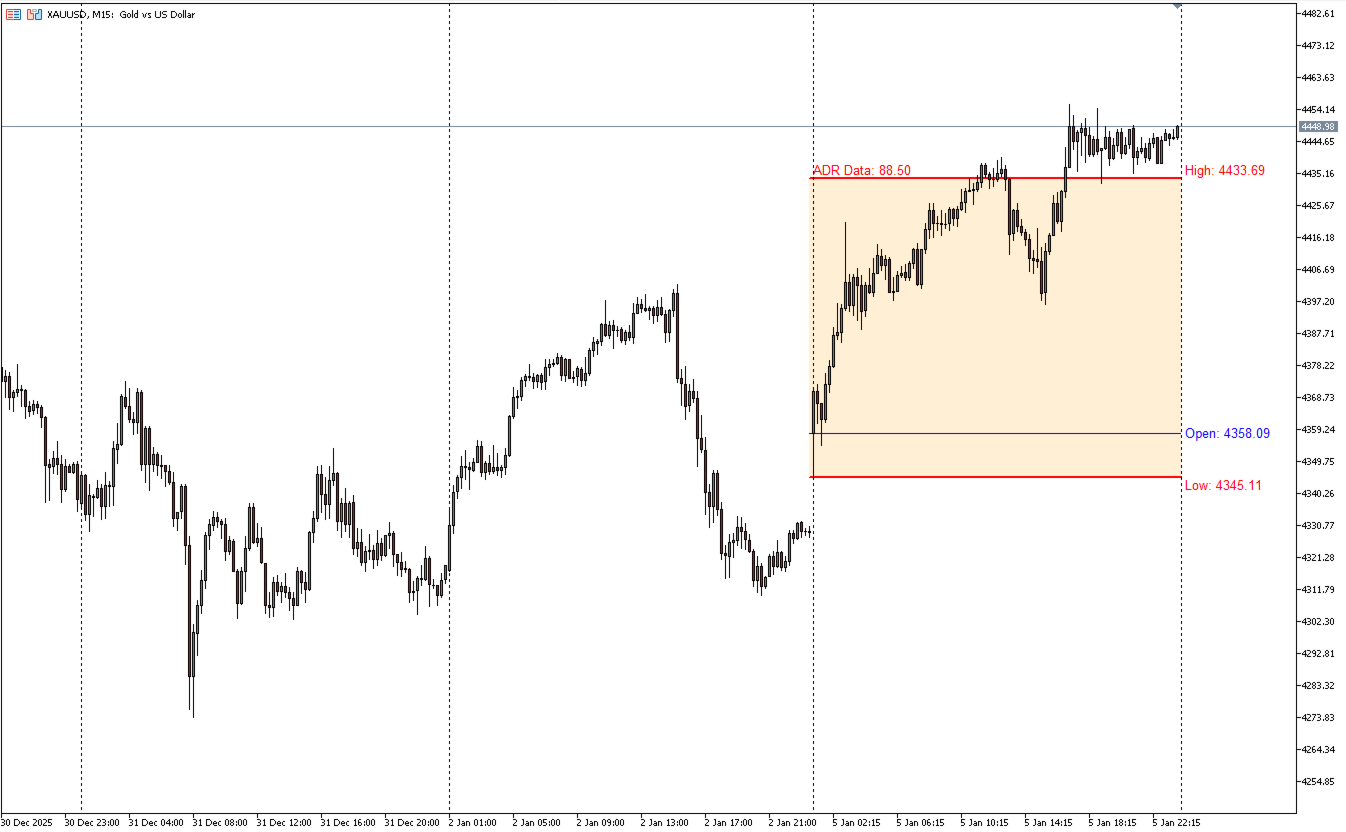
アダプティブADR は、平均日中レンジ(ADR)を計算・表示するためのプロフェッショナル向けインジケーターで、日々の値動きの特徴を把握したいトレーダーに最適です。柔軟な設定により、さまざまな市場環境に対応できます。
計算と手法
-
4種類の平滑化:SMA、EMA、SMMA(Wilder)、LWMA
-
トレードスタイルやボラティリティモデルに合わせて選択可能
-
トレンド相場・レンジ相場どちらにも対応
ダイナミックデイロジック
-
取引開始と同時に自動起動
-
始値を中心に2つの対称レベルを設定
-
ADR到達までレベルが徐々に収束
-
到達後は終日固定され、日内の値動きの限界を明確化
-
異常なボラティリティや過伸びの判断にも役立つ
視覚ガイド
-
始値ラインの表示が可能
-
色、ラインスタイル、透明度、表示設定を自由に調整
-
どのチャートテーマにも自然に馴染むデザイン
メリット
-
明確なイントラデイ構造
-
日々のボラティリティを正確に評価
-
ブレイクアウト、平均回帰、ボラティリティ戦略に最適
-
過剰なエントリーを避け、効率的なトレード判断をサポート