Gold Signal Pro with Auto TP SL

3.8

KURAMA GOLD SIGNAL PRO(MT5版)— 7層フィルター・自動TP/SL・品質スコア・サイン履歴保存搭載 XAUUSD完全トレードシステム


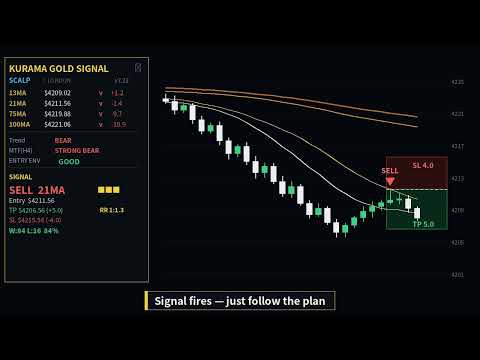
リアルタイムでリペイントしません。サインが出た瞬間、矢印・エントリー・TP・SLはその場で固定され、後から動きません。あなたがトレードするのは、この「リアルタイムで出たサイン」です。さらにv7.20では、実際に通知されたサインを自動保存し、再起動後もそのまま復元します。


━━━━━━━━━━━━━━━━

購入者限定特典

━━━━━━━━━━━━━━━━

買い切りライセンスをご購入いただいた方に、AI Zone Radar($59相当)+完全PDFマニュアルを無料プレゼント。本体価格に$59相当の特典が付いてきます。購入後にMQL5でメッセージをお送りください。

AI Zone Radar: https://www.mql5.com/en/market/product/175834


ゴールドトレーダーのコミュニティで実際に使用され、精度と使いやすさで高く評価されています。


━━━━━━━━━━━━━━━━━━━━

あなたの問題 — そしてその解決策

━━━━━━━━━━━━━━━━━━━━

ゴールドは1日$30〜$50動く。チャンスがあるのは分かっている。でもこういう経験はないか:


- エントリーが早すぎて、$10逆行してから思った方向に動く

- MAタッチのたびに入って、半分は負ける

- TP/SLの基準がないから、持ちすぎるか早すぎる決済をする

- 動かない時間帯にトレードして、なぜ上手くいかないのか悩む


KURAMA GOLD SIGNAL PROは、これらすべてを解決するために作られた。1つのフィルターではなく、7つのフィルターで。


━━━━━━━━━━━━━━━━━━━━

使い方 — 3ステップ

━━━━━━━━━━━━━━━━━━━━

1. チャートに矢印サインが表示される

2. パネルでTP価格、SL価格、品質スコア、リスクリワード比を確認

3. 注文を入れて待つ


推測不要。複雑な分析不要。矢印に従い、数字で管理する。


━━━━━━━━━━━━━━━━━━━━

エントリーだけじゃない — 決済計画も完全表示

━━━━━━━━━━━━━━━━━━━━

ほとんどのインジケーターはエントリーだけ教えて、あとは放置。


このインジケーターはサイン発生時にすべてを表示する:


- 矢印:エントリー方向と価格

- 緑ゾーン:利確目標と正確な価格

- 赤ゾーン:損切りレベルと正確な価格

- パネル:TP、SL、リスクリワード比、品質スコアを数値で表示


表示された数字をそのまま注文に入力するだけ。計算不要。


━━━━━━━━━━━━━━━━━━━━

7つの独立フィルター — 本当のエッジ

━━━━━━━━━━━━━━━━━━━━

サインが表示される前に、相場は7つのフィルターを同時に通過する必要がある:


フィルター1 — ボラティリティ異常検知:ATRスパイクとデッドマーケットでサインをブロック。

フィルター2 — MA構造チェック:SMA 13/21/75/100の配列を検証。

フィルター3 — トレンド方向フィルター:MAの傾きと価格位置の複合判定。

フィルター4 — MA角度フィルター:実際のMA角度を計測。フラットなMA=サインなし。レンジ相場の損失を排除。

フィルター5 — 上位足フィルター(H4):M5/M15エントリー前にH4トレンドを確認。

フィルター6 — RSIフィルター:買われすぎ/売られすぎの極端な位置でのエントリーをブロック。

フィルター7 — 貫通ブロック:本物の押し目とブレイクアウトを区別。


フィルター未通過 = サインなし = トレードしない。市場のXAUUSDインジの多くは1〜2個のフィルター。これは7つ。


━━━━━━━━━━━━━━━━━━━━

3段階フィルターレベル

━━━━━━━━━━━━━━━━━━━━

SAFE [S] — 最大フィルタリング。ファーストタッチフィルターON。サイン最少、精度最高。

STANDARD(デフォルト) — バランスモード。品質と頻度の最適バランス。推奨。

ACTIVE [A] — フィルター緩和。サイン増加。低スプレッド口座専用。品質スコアで手動フィルタリング推奨。


パラメータからワンクリックで切替。TP/SL計算はどのレベルでも同一。


━━━━━━━━━━━━━━━━━━━━

すべてのサインに品質スコア

━━━━━━━━━━━━━━━━━━━━

★★★ — すべての条件完璧。強いセットアップ。TP広め。

★★ — 堅実なセットアップ。標準TP/SL。メインのトレード。

★ — 条件不確実。TP/SL狭め。ロット縮小または見送り推奨。


スコアを通じてリスク管理が自動で行われる。


【v7.20 NEW】さらにパネルには★別の勝敗集計が表示されます。どの品質スコアのサインが今の相場で機能しているか、自分の目で確認できます。


━━━━━━━━━━━━━━━━━━━━

【v7.20 NEW】根拠タグ — なぜこのサインが出たのか

━━━━━━━━━━━━━━━━━━━━

すべてのサインに、発生根拠がタグで表示されます。ブラックボックスではありません。


FT — ファーストタッチ(そのMAへの初回タッチ)

RT — リタッチ(2回目以降)

TREND — トレンド方向と一致

H4 — 上位足(H4)の方向と一致

PO — パーフェクトオーダー成立中

VOL — ボラティリティが健全な範囲


タグが多いほど複数の根拠が重なったサイン。品質スコアとあわせて、自信を持ってエントリー判断ができます。タグはスマホへのプッシュ通知にも表示されるので、チャートを見なくても根拠が分かります。


━━━━━━━━━━━━━━━━━━━━

動的TP/SL — 毎回市場に適応

━━━━━━━━━━━━━━━━━━━━

固定TP/SLは相場が毎日変わるため機能しない。このインジは以下に基づいて毎回新規計算:


- どのMAにタッチしたか

- 品質スコア

- 現在のボラティリティ

- サイン連続回数


今の相場に合ったTP/SLが出る。


━━━━━━━━━━━━━━━━━━━━

4本のMA — 4種類のトレード

━━━━━━━━━━━━━━━━━━━━

13MA — 浅い押し目。クイックスキャル。狭いTP/SL。完璧な並び順のみ。

21MA — 標準的な押し目。最も多いサイン。バランスの取れたTP/SL。

75MA — 深い押し目。広いTP/SL。

100MA — 最も深い押し目。主要サポレジ。広いTP/SL。


パネルがどのMAがトリガーされたか教えてくれる。


━━━━━━━━━━━━━━━━━━━━

完全パネル — 必要な情報がすべて一画面に

━━━━━━━━━━━━━━━━━━━━

- 4本のMA値・傾き・価格からの距離

- フィルターレベル:[S]、[A]、または空欄

- トレンド:Strong Bull / Bull / Range / Bear / Strong Bear

- H4上位足コンテキスト

- ATR(Normal/Spike/Lowステータス付き)

- RSI値

- ENTRY ENV:現在のエントリー環境を総合判定(GOOD/CAUTION/NG)

- 現在のサイン:方向、MAタイプ、品質、根拠タグ、TP、SL、リスクリワード比

- 21MAでのトレーリングSL参照値

- ★別の勝敗カウンター

- スプレッドモニター:緑/黄/赤

- ローソク足カウントダウンタイマー


━━━━━━━━━━━━━━━━━━━━

【v7.20 NEW】サイン履歴の自動保存・復元

━━━━━━━━━━━━━━━━━━━━

これまで多くのサインインジの不満は「再起動するとサインが消える」ことでした。v7.20で解決。


- 発生したすべてのサインを自動でファイルに記録

- MT5の再起動、チャート再読み込み、インジ再適用の後も、矢印・TP/SL・ゾーンを自動復元

- 復元されるのは「実際に通知されたサイン」そのもの

- VPS移転やPC変更の際も、履歴ファイルをコピーすれば引き継ぎ可能


過去のサインが残るから、自分の目で実績を検証できます。隠れた結果はありません。


さらにv7.20では、チャート再読み込み時に同じサインが重複通知される現象も解消。新しいサインだけが通知されます。


━━━━━━━━━━━━━━━━━━━━

スクロールして検証

━━━━━━━━━━━━━━━━━━━━

すべての過去サインがTP/SLゾーンと一緒にチャート上に残る。緑ゾーン到達=TPヒット。赤ゾーン到達=SLヒット。隠れた結果なし。自分で確認できる。


━━━━━━━━━━━━━━━━━━━━

2つのモード

━━━━━━━━━━━━━━━━━━━━

SCALP M5 — 高速。狭いTP/SL。トレンドセッション中のアクティブトレード。

DAY M15 — 大きなターゲット。厳しいフィルター。サイン少ないが高品質。


最強のセットアップ:両方を並べて表示。M15で方向確認。M5でタイミング。


━━━━━━━━━━━━━━━━━━━━

アラート

━━━━━━━━━━━━━━━━━━━━

PCでサウンドアラート。MT5モバイルにプッシュ通知。メールも設定可能。高品質サインには専用サウンド。プッシュ通知には根拠タグも表示。


━━━━━━━━━━━━━━━━━━━━

ゴールド専用。ゴールドだけ。

━━━━━━━━━━━━━━━━━━━━

すべてのフィルター、閾値、TP/SL計算がXAUUSD専用にゼロから設計。セッションパターン、ATRスパイク、指標発表前の動き — すべて考慮済み。


FXインジにゴールド設定を入れたものではない。ゴールド専用インジケーター。


━━━━━━━━━━━━━━━━━━━━

セッション自動検出

━━━━━━━━━━━━━━━━━━━━

シドニー、東京、ロンドン、ニューヨーク — ブローカーのサーバー時間に関係なく自動検出。


━━━━━━━━━━━━━━━━━━━━

スプレッドモニター

━━━━━━━━━━━━━━━━━━━━

緑 = GO。黄 = 注意。赤 = 待機。常にチャート上に表示。


━━━━━━━━━━━━━━━━━━━━

リアルタイムでリペイントしません — そして再計算について正直にお伝えします

━━━━━━━━━━━━━━━━━━━━

【リアルタイムの動作】

確定足に一度表示されたサインは、その足の中で消えたり位置が変わったりしません。矢印・エントリー・TP・SLは表示された瞬間に固定され、後から動きません。あなたが実際にトレードするのは、この「リアルタイムで出たサイン」です。ここにラグもリドローもありません。


【再計算について — 隠さずお伝えします】

インジを再適用・再起動・時間足切替すると、過去バーは内部状態(クールダウン等)をゼロから再計算します。このとき、過去の「参考矢印」の出方がわずかに変わることがあります。これはリペイントではなく、内部状態を持つインジに共通する再計算挙動で、プラットフォームを問わず標準的なものです。重要なのは、これがリアルタイムのトレード結果に一切影響しないことです。あなたはサインが出た瞬間にトレードするのであって、過去バーの再描画でエントリー・TP・SL・損益が変わることはありません。


そしてv7.20では、実際に通知されたサインを自動でファイルに保存し、再起動後も同じ位置に復元します。通知済みのサイン履歴は書き換わりません。


【実際のユーザーの声】

この点について、購入者のVioletteさんはレビューでこう書いています(MQL5レビューより):

「リフレッシュ後に履歴が変わったとしても、それは全く問題ではありません。私は2週間ずっと利益を出し続けているのですから。おすすめします。」

リアルタイムでトレードしている実ユーザーにとって、再計算は実用上の問題にならない — これが現場の評価です。


━━━━━━━━━━━━━━━━━━━━

トレーリングSL

━━━━━━━━━━━━━━━━━━━━

パネルが21MAベースのTrail値を表示。SLを移動して利益を確保。手動執行。


━━━━━━━━━━━━━━━━━━━━

より良い結果のための3つのルール

━━━━━━━━━━━━━━━━━━━━

1. M5とM15の方向が一致する時だけトレード

2. ★★と★★★に集中。★はスキップまたは最小ロット

3. トレンドがRangeの時はスキップ。トレンドなし=エッジなし


━━━━━━━━━━━━━━━━━━━━

このインジケーターの背景 — 12年の経験

━━━━━━━━━━━━━━━━━━━━

売るために作ったのではない。自分に必要だから作った。12年間ゴールドだけをトレード。2回の口座破綻。すべてのフィルター閾値は実際の資金で検証済み。


毎日自分のトレードで使っている。今度はあなたが使う番。


━━━━━━━━━━━━━━━━━━━━

仕様

━━━━━━━━━━━━━━━━━━━━

プラットフォーム:MetaTrader 5

銘柄:XAUUSDのみ

時間足:M5およびM15

推奨スプレッド:$1.0以下


━━━━━━━━━━━━━━━━━━━━

よくある質問

━━━━━━━━━━━━━━━━━━━━

Q: FX通貨ペアに使える? — いいえ。XAUUSDのみ。

Q: M30やH1で使える? — いいえ。M5とM15のみ。スイングをご希望ならGold Signal Swing Pro(M30/H1/H4)をご覧ください。

Q: パラメータの調整は必要? — デフォルトが最適化済み。フィルターレベルのみ変更可能。

Q: サインが出ない? — フィルターが正常に機能している。適切なセットアップを待つ。

Q: リペイントする? — リアルタイムではしません。出たサインのエントリー・TP・SLはその場で固定。再適用や再起動をすると過去バーの参考矢印は再計算されますが、これはトレード結果に影響しません。通知済みサインはv7.20で保存・復元されます。

Q: 再起動するとサインは消える? — いいえ。v7.20から自動保存・復元されます。

Q: マニュアルは? — あり。購入後にメッセージをいただければ、PDFマニュアルとAI Zone Radar特典をお渡しします。


━━━━━━━━━━━━━━━━━━━━

買い切りライセンス購入者特典

━━━━━━━━━━━━━━━━━━━━

買い切りライセンスをご購入いただいた方に以下を無料で提供:


- AI Zone Radar($59相当):5層強度スコアリング搭載の自動サポート&レジスタンス検出インジケーター

- 完全PDFマニュアル:設定方法とトレードルールの完全ガイド


レンタルは対象外です。購入後にMQL5で直接メッセージをお送りください。両方をお渡しします。

AI Zone Radar: https://www.mql5.com/en/market/product/175834


━━━━━━━━━━━━━━━━━━━━

ラインナップ

━━━━━━━━━━━━━━━━━━━━

MT4版もご用意しています:https://www.mql5.com/ja/market/product/170617


M30/H1/H4スイング版もあります — M5/M15では取りきれない大きな波を狙いたい方へ。Gold Signal Swing Pro(M30/H1/H4対応)。1トレードで$20〜$80+の値幅を狙う。

https://www.mql5.com/en/market/product/177643


━━━━━━━━━━━━━━━━━━━━

レビュー

━━━━━━━━━━━━━━━━━━━━

このインジケーターが役に立ったと感じたら、ぜひレビューをお書きください。あなたのフィードバックが他のトレーダーの判断材料になります。


━━━━━━━━━━━━━━━━━━━━

リスク開示

━━━━━━━━━━━━━━━━━━━━

意思決定支援ツールであり、投資助言ではありません。過去の実績は将来の結果を保証しません。XAUUSDはボラティリティが高く、大きな損失が発生する可能性があります。失っても問題ない資金でのみトレードしてください。低スプレッド環境を強く推奨します。
レビュー 5
Yik Hung Lai
1198
Yik Hung Lai 2026.07.04 02:18 
 

i bought Gold Signal Pro with Auto TP SL and Gold Signal Swing Pro XAUUSD with Auto TP SL,very easy to use

Violette
660
Violette 2026.06.10 14:04 
 

I did buy a LOT of indicators of the market and they all went to the trash. This one is different because it's the first one which gives me good profit, i'm very satisfied of this indicator and the seller is very friendly. I for example had losses in my account because of an EA (which did go to the trash also) and within 1 week i did recover all thanks to this indicator, so thank you very much ! I must also say that even if the history repaints after refresh, it's absolutely not a problem as i'm continuesly doing profits since 2 weeks. I recommand.

jcasas311948 Casas
198
jcasas311948 Casas 2026.04.17 11:31 
 

El 18 de Abril del 2.026, alquile por un mes el indicador Gold Signal Pro with Auto TP SL y desde el primer momento, las señales fueron perfectas y el resultado de las primeras dos semanas fue espectacular: -Total de señales en el mercado de Londres y Nueva York = 110 -Total de señales en las que he entrado =57 - Operaciones positivas 55 (96,49%) - Resultados de los 9 días operados= 8.923$ RESULTADOS REALES 20/30- Abril 2.026 Total 9 dias Op. Total Señales Dia /Semana -177 100% Señales en M. Asiatico -67 38% S. en M. Londres + N.Y. -110 62% Señales de Venta -86 48,59% Señales de Compra -57 32,20% Solo mercado de London + NY Señales Buenas -77 70,00% Señales Malas -33 30,00% NO entrado -53 48,18% Entrado L/NY -57 51,82% Beneficio $ 9.313,85 Operaciones positivas -55 96,49% Perdida -$ 390,51 Operaciones Negativas -2 3,51% Resultado total SEMANA -$ 8.923,34 En la segunda semana pude constatar que el indicador tenia una serie de pequeñas incidencias en MT5 y se las manifesté al desarrollador, el cual en la actualización de hoy 7,13, parece que están todas superadas y mejorado el rendimiento en MT5. Por todo ello recomiendo este indicador Gold Signal Pro with Auto TP SL y yo confirmo que cuando venza el mes de alquiler , lo compraré definitivamente. Un saludo..... Atentamente: Jose Casas

Hoy domingo 17 de Mayo de 2026, confirmo que he adquirido la licencia de compra completa, espero recibir AI Zone Radar + manual PD.

Un saludo....... Atentamente: Jose Casas

Recibido.... Gracias.

おすすめのプロダクト
インディケータは現在のクオートを作成し、これを過去のものと比較して、これに基づいて価格変動予測を行います。インジケータには、目的の日付にすばやく移動するためのテキスト フィールドがあります。 オプション: シンボル - インジケーターが表示するシンボルの選択; SymbolPeriod - 指標がデータを取る期間の選択; IndicatorColor - インジケータの色; HorisontalShift - 指定されたバー数だけインディケータによって描画されたクオートのシフト; Inverse - true は引用符を逆にします。false - 元のビュー。 ChartVerticalShiftStep - チャートを垂直方向にシフトします (キーボードの上下矢印)。 次は日付を入力できるテキストフィールドの設定で、「Enter」を押すとすぐにジャンプできます。
Was: $249  Now: $99   Market Profile defines a number of day types that can help the trader to determine market behaviour. A key feature is the Value Area, representing the range of price action where 70% of trading took place. Understanding the Value Area can give traders valuable insight into market direction and establish the higher odds trade. It is an excellent addition to any system you may be using. Inspired by Jim Dalton’s book “Mind Over Markets”, this indicator is designed to suit the
The Horizontal Ray Tool is a lightweight, professional charting utility designed to streamline support and resistance mapping on MetaTrader 5. It brings rapid, one-click horizontal level placement directly to your live chart, eliminating the workspace clutter associated with infinite horizontal lines or manually drawn trendlines. Key Features: Interactive On-Screen Button: Spawns a clean, responsive "DRAW RAY" button docked directly on your chart canvas. A single click drops an independent hor
FREE
VOLUME PROFILE SAF-XII MT5専用プロフェッショナル・マーケットプロファイル分析ツール(グリッドトレードに最適な「ドリーム・インジケーター」) ボリュームプロファイル(価格帯別出来高)とは? ボリュームプロファイルは、従来の「時間軸」の出来高とは異なり、「特定の価格帯」での取引活動を表示するプロ仕様のツールです。選択した期間内の「どこで」取引が行われたかを可視化し、以下のポイントを特定します: バリューエリア (VAH/VAL) :全取引の大部分が行われた価格帯。 ポイント・オブ・コントロール (POC) :最も出来高が集中した単一の価格水準。 リクイディティ・イムバランス :各価格帯における強気(買い)と弱気(売り)の優劣。 サポレジ(支持・抵抗) :実際の取引活動に基づいた自然な価格水準。 3つの動作モード — 「設定したらあとはお任せ」 VP_MANUAL(スイングトレード・重要ライン分析) 垂直ラインをドラッグして分析範囲を手動で設定。 ラインを動かした時のみ再計算されるため軽量。 用途 :指標発表前分析、決算発表、特定の期間分析。 VP_AUTO(スキ
The "MR Volume Profile 5" indicator is a charting tool that displays trading volume at different price levels rather than time intervals. A key concept in volume profile is the point of control (POC)—the price level with the highest volume traded during the session or time range. While tools like VWAP or OBV provide volume trends, the "MR Volume Profile 5" indicator offers granular detail about where the most market activity occurs at specific price levels. This makes it a more precise tool for
Here   our more valuable tools SMC Trend Trading   ,  Easy SMC Trading  ,  Institutional SMC Architect Volume Analysis Tools  ,  Volume flow Profile  ,  Market volume profile  , FVG with Volume  , Liquidity Heatmap Profile  ,  Volume Spread Analysis 2. Key Features Dynamic Filtering : The core feature. As soon as the current price crosses a historical liquidity level, that level disappears. This reduces chart clutter and prevents you from trading off "dead" support/resistance. Liquidity Heatma
Master Editionは、ボリュームとマネーフローの視点を通じて市場構造を可視化するために設計されたプロフェッショナルグレードの分析ツールです。標準のボリュームインジケーターとは異なり、このツールはチャート上に日足ボリュームプロファイルを直接表示し、価格発見がどこで行われたか、そして「スマートマネー」がどこに位置しているかを正確に確認できます。 このMaster Editionは、明確さとスピードを考慮して設計されており、ロード時にチャートレイアウトを即座に美化するユニークな自動テーマ同期システムを備えています。 主な機能: 真のマネーフロー計算: 標準のティックボリュームを超えます。「Use Money Flow」を有効にすると、ボリュームは価格によって重み付けされ、特定の価格レベルでの実際の資本コミットメントが明らかになります。 バリューエリア (VA) の可視化: バリューエリア(デフォルトではボリュームの70%)を自動的に計算します。 VA Fill: コントロールゾーンを即座に識別するために、バリューエリアの背景をシェーディングします。 主要レベル: コントロールポイン

Was: $299  Now: $99  Supply Demand uses previous price action to identify potential imbalances between buyers and sellers. The key is to identify the better odds zones, not just the untouched ones. Blahtech Supply Demand indicator delivers functionality previously unavailable on any trading platform. This 4-in-1 indicator not only highlights the higher probability zones using a multi-criteria strength engine, but also combines it with multi-timeframe trend analysis, previously confirmed swings a
Here   our more valuable tools SMC Trend Trading   ,  Easy SMC Trading  ,  Institutional SMC Architect Volume Analysis Tools  ,  Volume flow Profile  ,  Market volume profile  , FVG with Volume  , Liquidity Heatmap Profile  ,  Volume Spread Analysis Deriv boom and crash index spike killer system you can use it only on m5 timeframe  follow the structure and get signal with alert on phone open trade set sl tp and enjoy easy analysis and trading made simple 
Here   our more valuable tools SMC Trend Trading   ,  Easy SMC Trading  ,  Institutional SMC Architect Volume Analysis Tools  ,  Volume flow Profile  ,  Market volume profile  , FVG with Volume  , Liquidity Heatmap Profile  ,  Volume Spread Analysis The    Liquidity Heatmap   is a sophisticated institutional trading tool designed to reveal where over-leveraged traders are trapped. By calculating estimated liquidation levels based on volume spikes and leverage, this indicator draws a dynamic "h
The market is unfair if only because 10% of participants manage 90% of funds. An ordinary trader has slim changes to stand against these "vultures". This problem can be solved. You just need to be among these 10%, learn to predict their intentions and move with them. Volume is the only preemptive factor that faultlessly works on any timeframe and symbol. First, the volume appears and is accumulated, and only then the price moves. The price moves from one volume to another. Areas of volume accumu
PriceMagnet Volume Profile Stop guessing where the smart money is sitting. See it. PriceMagnet Volume Profile is a precision volume-analysis indicator built for MetaTrader 5 traders who want to trade with institutional context instead of guesswork. Rather than plotting volume as a flat bar under your chart, PriceMagnet reconstructs a full horizontal volume histogram directly on price — showing you exactly which price levels attracted the most trading activity over your selected lookback window,
This Volume Delta Profile is an advanced MetaTrader 5 indicator that visualizes   volume delta (order flow imbalance)   using a volume profile-style histogram. It shows the difference between buying and selling pressure at specific price levels, helping traders identify supply and demand zones. This indicator provides a unique perspective on market dynamics by visualizing the imbalance between buying and selling pressure, offering insights beyond traditional volume analysis. Core Concept Positiv
VR Grid Mt5
Vladimir Pastushak
3.25 (8)
VR グリッド インジケーターは、ユーザー定義の設定を使用してグラフィカル グリッドを作成するように 設計 されています。 標準グリッド とは異なり、VR グリッドは 円形レベル を構築するために使用されます。ユーザーの選択に応じて、ラウンド レベル間のステップは任意に設定できます。さらに、他のインジケーターやユーティリティとは異なり、VR Grid は期間が変更されたり、端末が再起動されたりした場合でも、 グリッドの位置を維持 します。 設定、設定ファイル、デモ版、説明書、問題解決方法は、以下から入手できます。 [ブログ] レビューを読んだり書いたりすることができます。 [リンク] のバージョン [MetaTrader 4] 垂直レベル は実際の時間間隔に基づいており、 欠落している または存在しない期間は無視します。したがって、レベル間のステップは、ユーザーが選択した値に厳密に対応します。 VR グリッド インジケーターを使用すると、トレーダーは任意のレベルで 垂直線と水平線のスタイル 、色、太さを変更できます。これにより、金融商品の ラウンドレベル を制御できます。 ラウンド
FREE
Japanese このインジケーターは、チャートパターンでのトレードを好むトレーダーにとって、高度なチャート分析アシスタントとして機能します。目視での分析負担を軽減し、利益を上げるための精度を高めるように設計されています。 実際の使用においての、このインジケーターの主な利点と特徴は以下の通りです: 1. 自動パターン検出 (Automated Pattern Detection) 時間の節約とバイアスの軽減: 手動でトレンドラインを引く必要はありません。価格のスイングポイント(Pivot High/Low)を検索し、価格構造が条件を満たすと、ライジングウェッジ(上昇楔形)とフォーリングウェッジ(下降楔形)を自動的に描画します。 あらゆる状況を網羅: パターン形成中、ブレイクアウト、さらにはパターン失敗(Failed)まで検出でき、市場の全体像を明確に把握できます。 2. ターゲットとフィボナッチTPの内蔵 (Built-in Targets & Fibonacci TP) ターゲットを自動計算: ブレイクアウトが発生すると、システムはウェッジの開き幅に基づいてメインターゲットの距離を即
VibeFox Volume Profile — MetaTrader 5 向け Volume Profile VibeFox Volume Profile は、MetaTrader 5 向けの完全な Volume Profile ツールセットです。取引された出来高を価格に沿って水平方向に分布させて描き出すため、市場が最も活発だった場所、薄商いだった場所、そしてどの価格水準が磁石や障壁として働きやすいかを一目で確認できます。各プロファイルはチャート上に直接描画され、モダンでマウス操作のパネルから制御されます——掘り下げるメニューも、アタッチするスクリプトもありません。 ローソク足だけからサポートとレジスタンスを推測する代わりに、出来高の実際の足跡を扱います。価格を引き寄せる高出来高ノード、価格が素早く通過しがちな低出来高のすき間、そして大半の取引が行われた公正価値ゾーンです。 必要な形の Volume Profile Volume Profile は単一の固定プロファイルではありません。 複数の独立したプロファイルエンジンを同時に 提供し、それぞれが独自の範囲、配置、スタイルを持つため
Smart DOM Tick Flow は、適応型 SmartDOM、ティックフロー分析、価格変動のスペクトル評価、市場活動レベル、取引シグナルの多段階確認を統合した独自開発のデイトレード向けインジケーターです。 インジケーターの中心となるのは SmartDOM です。価格バランスの移動と価格帯ごとの活動分布を示す動的なマップとして機能します。 価格の方向だけでなく、現在の市場オークションの内部構造も把握できます。参加がどこに集中しているか、動きに対する抵抗がどこで形成されているか、活動の中心がどこへ移動しているか、現在の買い圧力または売り圧力がどれほど安定しているかを確認できます。インジケーターは、価格、ティック、出来高、値動きの速度、レベルへの反応、インパルスの質が相互に確認し合う一つの統合システムとして市場を分析します。 SmartDOM — インテリジェントな市場深度モデル SmartDOM は、ブローカーが提供する限られた注文だけに依存せず、正規化された Bid、Ask、Last のティックデータを適応型の価格レベルに配分します。利用可能な出来高を考慮し、価格変化の性質
Here   our more valuable tools SMC Trend Trading   ,  Easy SMC Trading  ,  Institutional SMC Architect Volume Analysis Tools  ,  Volume flow Profile  ,  Market volume profile  , FVG with Volume  , Liquidity Heatmap Profile  ,  Volume Spread Analysis Transform Your Trading with Intelligent Market Insights! The 2025 Spike Killer Dashboard is a powerful MQL5 indicator that combines cutting-edge signal generation with an intuitive crystal dashboard for real-time market analysis. Designed for tra
インジケーター技術仕様 – Delta Profile for MetaTrader 5 Delta Profile は MetaTrader 5 用に開発されたインジケーターで、指定されたローソク足範囲内の出来高フローを詳細に分析するためのものです。異なる価格レベルにおける正の出来高(上昇に関連)と負の出来高(下降に関連)の不均衡を構造化し、可視化します。その結果、ユーザーは最も多くの取引が集中する価格帯や実際の市場不均衡が形成される領域を明確に把握できます。 以下に、本インジケーターの主要な技術特性と設定パラメータを示します。 基本コンセプト インジケーターは 価格レベル を識別し、それらを正の出来高、負の出来高、および純 Delta(正負の出来高差)に分類します。 各価格レベルは 水平バー としてチャートに表示され、市場の活動ゾーンや不均衡領域を視覚的に確認できます。 ユーザーは 分析対象ローソク足数 、 価格の丸め精度 、 最大表示レベル数 、および 表示スタイル を自由に設定できます。 主要機能 価格レベルのマッピング :設定された精度に基づき価格を丸め、対応するローソク足の
ONNYX INDICATOR バージョン 1.14 MetaTrader 5 用のサプライ・デマンド分析インジケーターです。確定したスイングからゾーンを作成し、ATR で幅を調整し、品質をパーセント表示します。確定足の BUY/SELL シグナルは後から消えない設計です。 主な機能 - ゾーン内に品質パーセントを表示するサプライ・デマンドゾーン。 - 確定足で表示される大きな BUY/SELL 矢印。 - EMA トレンドフィルターとローソク足反発確認。 - トレンド、価格レベル、市場状況パネル。 - 関連する経済指標を最大5件表示。発表前は Forecast/Previous、発表後は Actual を表示。 - 60秒ごとのニュース更新とストラテジーテスター用カレンダーキャッシュ。 - ポップアップ、プッシュ、メール通知。 - iCustom 用バッファ:0=BUY価格、1=SELL価格。 使用方法 チャートに適用し、履歴の読み込みを待ってから、トレンドと有効ゾーンを確認し、確定足シグナルを独自のリスク管理と組み合わせてください。XAUUSD H1 は見やすい構造、M15 はより
LuoMo Volume & Price Structure 8.98 A multi-function chart indicator for   MetaTrader 4 and MetaTrader 5 , designed to display key volume, volatility, sentiment, and price-structure information directly on the main chart. Main Features Volume and price-based Support & Resistance Volume spike and exhaustion signals ATR volatility expansion alerts Volume Profile with HVN and LVN Bullish and bearish sentiment distribution Developing or fixed POC VAH and VAL levels Supply and Demand zones Volume-wei
Here   our more valuable tools SMC Trend Trading   ,  Easy SMC Trading  ,  Institutional SMC Architect Volume Analysis Tools  ,  Volume flow Profile  ,  Market volume profile  , FVG with Volume  , Liquidity Heatmap Profile  ,  Volume Spread Analysis Boom: Take SELL signals only (price spikes up then crashes) Crash: Take BUY signals only (price drops then spikes up) SL goes beyond the line as labeled Interactive Market Watch Panel : A left-side sidebar showing real-time strength indicators (po
Haven Volume Profileは、取引量の分布に基づいて重要な価格レベルを識別するための多機能なボリュームプロファイル分析インジケーターです。市場をより深く理解し、重要なエントリーポイントとエグジットポイントを特定したいプロのトレーダー向けに設計されています。 その他の製品 ->  こちら 主な機能: Point of Control (POC) 計算 - 最大の取引活動が行われるレベルで、最も流動性の高いレベルを特定するのに役立ちます Value Area(高い活動の領域)の定義とカスタマイズ可能な取引量の割合で、取引範囲をより正確に評価できます ティックボリュームと実際の取引量の両方に対応し、さまざまな市場タイプや取引戦略に対応しています 計算期間(日数)の柔軟な設定により、任意の時間枠にツールを適応させることができます ターミナルのライトテーマとダークテーマに自動的に適応し、ユーザーインターフェースの視覚的な体験を向上させます レベルの視覚化が明確で、スタイルや色をカスタマイズでき、グラフ分析と迅速な意思決定を支援します このインジケーターは、重要な価格レベルや統合ゾー
FREE
Before installing the HeatMap indicator make sure you are using a broker that gives you access to the Depth of market (DOM) !! This indicator creates a heatmap on your chart allowing you to see the buy or sell limit orders easily and in real time. You have the possibility to change the setting and the colors of the HeatMap in order to adapt to all markets and all charts. Here is an example of a setting you can use with the NASDAQ100 on the AMPGlobal broker :  https://www.youtube.com/watch?v=x0Y
Market Structure, Liquidity and Price Action Analysis for MetaTrader 5 A chart can contain plenty of information and still leave a trader without a clear decision. A BOS label may appear, liquidity may be nearby, and an order block may remain active, yet the real challenge is understanding how those elements relate to one another. ICT Yoshi Pro organizes that process into a cleaner, more disciplined MetaTrader 5 workflow. What ICT Yoshi Pro Does ICT Yoshi Pro is a manual decision-support indicat
Introducing PivotWave – your ultimate trading companion that redefines precision and market analysis. Designed with traders in mind, PivotWave is more than just an indicator; it’s a powerful tool that captures the pulse of the market, identifying key turning points and trends with pinpoint accuracy. PivotWave leverages advanced algorithms to provide clear visual signals for optimal entry and exit points, making it easier for traders to navigate volatile market conditions. Whether you are a begin
What if you could finally SEE where the market really wants to go? Most traders watch price. Pros watch VOLUME — where the money was actually traded. Volume Profile Fibo Confluence puts that reading right in front of you, in plain language, no jargon. WHAT YOU SEE ON YOUR CHART • The POC, the most-traded price: the market's natural magnet • The value area (VAH / VAL): the "house" where price spends its time • Automatic Fibonacci retracement + the golden pocket • Low-volume nodes
RSI Currency Strength Meter is a powerful and elegant multi-currency indicator that measures the real-time relative strength of the 8 major currencies using RSI logic. By calculating the smoothed performance of each currency across its major pairs and applying the RSI formula, it delivers clean and responsive strength lines that make it easy to spot which currencies are truly strong or weak at any moment. This indicator is particularly useful for visualizing currency correlations and divergence
Gioteen Volatility Index (GVI) - your ultimate solution to overcoming market unpredictability and maximizing trading opportunities. This revolutionary indicator helps you in lowering your losing trades due to choppy market movements. The GVI is designed to measure market volatility, providing you with valuable insights to identify the most favorable trading prospects. Its intuitive interface consists of a dynamic red line representing the volatility index, accompanied by blue line that indicate
Market Profile Heat indicator  — is a classic Market Profile implementation that can show the price density over time, outlining the most important price levels, value area, and control value of a given trading session. This indicator can be attached to timeframes between M1 and D1 and will show the Market Profile for daily, weekly, monthly, or even intraday sessions. Lower timeframes offer higher precision. Higher timeframes are recommended for better visibility. It is also possible to use a fr
このプロダクトを購入した人は以下も購入しています
Neuro Poseidon is a new indicator by Daria Rezueva. It combines precise trading signals with adaptive TP/SL levels - creating best possible trades as a result! Message me and get  Neuro Poseidon Assistant  as a gift to automize your trading process! What makes it stand out? 1. Proven profitability on all assets and timeframes 2. Only confirmed BUY and SELL signals present on the chart 3. Adaptive TP & SL levels generated by the software for each trade 4. Easy to understand - suitable for al
UZFX {SSS} スキャルピング・スマートシグナル v4.0 MT5は、変動の激しい市場において正確かつリアルタイムのシグナルを求めるスキャルパー、デイトレーダー、スイングトレーダー向けに設計された、リペイントのない高性能な取引インジケーターです。(UZFX-LABS)によって開発されたこのインジケーターは、価格行動分析、トレンド確認、スマートフィルタリングを組み合わせることで、すべての通貨ペアおよび時間軸において、高確率の売買シグナル、警告シグナル、トレンド継続の機会を生成します。 トレードの判断に迷うのはもうやめましょう。明確さ、正確さ、そして規律ある市場執行を求めるトレーダーのために設計された、体系的なシグナルシステムに従い始めましょう。 私のおすすめ* 最適な時間足:15分足以上。 {H1} が私のお気に入りです。そして、その成果は驚異的です…!! 主な機能の更新 • 自動売買シグナル検出 • 高度な反転認識ロジック • 市場反転の可能性に先立つ早期警告シグナル • トレンド継続確認シグナル • エントリー、ストップロス、TP1、TP2、TP3レベルを備えた組み込み型
Session High Low Lines Indicator that plots key intraday reference levels directly on the chart: the previous day's high/low and the current day's high/low, updated automatically as the new day forms. An optional previous week high/low can also be displayed. These levels are widely used as reference points for potential support and resistance zones, breakout confirmation, and range context during a trading session. Features Previous day High/Low lines Current day High/Low lines (updates in real
The Oracle Pro
Ottaviano De Cicco
5 (1)
The Oracle Pro:MT5向け合成マルチタイムフレーム・バイアスエンジン ️ サマー・ローンチ・オファー — The Oracle Pro を 199 USD で(早期購入者向け)。価格は普及に応じて上昇します。最終価格 399 USD。 The Oracle Pro は、要求の高いプロのトレーダーのために作られた MetaTrader 5 向けのプレミアム・マルチタイムフレーム バイアスエンジン です。ひとつの問いに規律をもって答えます。すなわち、各タイムフレームの現在の方向バイアスは何か、その強さはどれほどか、そしてタイムフレーム同士はどれだけ一致しているか。すべては確定足のみで計算され、リペイントはありません。 The Oracle Pro はマルチファクター・コンセンサス・システムです。独自のインジケーターと最適化されたアルゴリズムを単一の高度なコンセンサス・ベクトルに統合し、それを単一のインジケーター・インスタンス内で現在足と上位足のスタックにわたって読み取ります。複数のチャートにばらばらのツールを積み重ねる代わりに、です。 これは Oracle コンセンサス手法
Azimuth Pro
Ottaviano De Cicco
5 (7)
Azimuth Pro V2:MT5向けシンセティック・フラクタル構造分析と確認済みエントリー 概要 Azimuth Pro は Merkava Labs によるマルチレベルスイング構造インジケーターです。4つのネストされたスイングレイヤー、スイングアンカーVWAP、ABCパターン検出、3タイムフレーム構造フィルタリング、そして確定バーでの確認済みエントリー — 1つのチャートで、ミクロスイングからマクロサイクルまでを網羅するワークフロー。 これはブラインドシグナル製品ではありません。ロケーション、コンテキスト、タイミングを重視するトレーダーのための構造ファーストワークフローです。 ️ サマーセール — 夏至とThe Oracle Proの発売を記念して、Azimuth Proが30%オフ。現在279 USD(通常399 USD)。期間限定の夏季オファー。 1. V2での変更点 シンセティック・マルチタイムフレームエンジン 上位タイムフレーム分析をMeridian Proと同じ独自のシンセティックアーキテクチャで一から再構築。よりクリーンなHTFコンテキスト、安定したライブ動作、
Quant Direction は、3次元の市場分析ツールです。完全に客観的なアルゴリズムベースの市場分析を提供し、様々なパラメータにわたる正確なパーセンテージ偏差を同時に算出します。高度なAI搭載モデリングツールで開発され、厳密なテストを経て開発されたこのアルゴリズムは、かつてない精度で市場を分析するように設計されています。プラットフォーム上では、あらゆる通貨ペアや金融商品を分析できます。 短期取引、デイトレード、スイングトレードなど、どのような取引スタイルに も、Quant Directionは最適な選択肢です。 オペレーターの本当の利点 Quant Directionの真の利点は、感情、眼精疲労、過剰分析を完全に排除できる点にあります。方向性を探るために何十ものチャートを手作業で精査したり、自分の好みを常に疑ったりする必要がなくなります。このシステムは、8つの時間間隔(5ヶ月から月単位まで)をミリ秒単位で処理します。あらゆる瞬間に市場を支配している主体を正確に明らかにし、常に成功確率が最も高い方向で取引できるようにします。 市場分析の3つの側面 このアルゴリズムは市場を3つの
FX-AIEA Smart Supply and Demand Zone Identification Indicator (Supply and Demand Indicators MT5) Version: 2.51 | Compatible Platform: MetaTrader 5  Why do trades need supply and demand zones? Supply and demand zones are the core manifestation of institutional order flow, reflecting real buying and selling power more accurately than traditional support and resistance. However, manual drawing is not only time-consuming but also highly subjective and prone to missing key areas. FX-AIEA Supp
ZAB Supply Demand MTF automatically detects institutional supply and demand zones across up to 9 timeframes and draws them directly on your chart. Based on Sam Seiden's methodology, this indicator identifies the exact zones where banks and institutions placed their orders. Why This Indicator? Unlike basic support/resistance tools, ZAB Supply Demand MTF classifies every zone by its formation pattern and merges overlapping zones from different timeframes into high-probability confluence areas. Key
Ziva LSE Pro
Hassan Abdullah Hassan Al Balushi
ZIVA LSE Pro: Trade the Flow, Not the Noise ZIVA LSE Pro was developed around a simple belief: professional traders do not need more random signals; they need better context. This workflow reflects the ZIVA approach to filtering market noise and focusing on the liquidity and structural mechanics that influence price behavior. Most indicators treat the market like a static picture. ZIVA LSE Pro is built to read it as a dynamic environment where liquidity, structure, volatility, and execution con
GEM Signal Pro GEM Signal Pro は、MetaTrader 5 向けのトレンドフォロー型インジケーターです。より明確なシグナル、より整理されたトレードセットアップ、そして実用的なリスク管理をチャート上で確認したいトレーダーのために設計されています。 単純な矢印だけを表示するのではなく、GEM Signal Pro はトレード全体の考え方を、より見やすく分かりやすい形で表示します。条件が確認されると、インジケーターはエントリー価格、ストップロス、利確目標をチャート上に表示し、トレードセットアップをより効率的に確認できるようにします。 動作の仕組み このインジケーターは、まず内部ロジックに基づいて有効なシードシグナルを検出します。 確認条件が満たされると、GEM Signal Pro はチャート上に完全なセットアップを表示します。これにより、トレーダーはトレード構造をより明確に把握し、手作業による分析を減らすことができます。 チャート上のトレードレベル 確認済みシグナルに対して、GEM Signal Pro は以下を表示できます。 エントリー価格 ストップロス テ
PrimeScalping is a powerful trading companion designed to generate high-probability entry signals with dynamic TP/SL/DP levels based on volatility. Built-in performance tracking shows win/loss stats, PP1/PP2 hits, and success rates — all updated live. Key Features: Buy/Sell signals with adaptive volatility bands Real-time TP/SL/DP levels based on ATR Built-in MA Filter with optional ATR/StdDev volatility Performance stats panel (Success, Profit/Loss, PP1/PP2) Alerts via popup, sound, push, or e
RelicusRoad Pro: 定量的市場オペレーティングシステム 【期間限定】無制限アクセス 70% OFF - 2,000人超のトレーダーと共に なぜ多くのトレーダーは「完璧な」インジケーターを使っても失敗するのでしょうか? それは、文脈を無視して 単一の概念 だけでトレードしているからです。文脈のないシグナルは単なるギャンブルです。勝ち続けるには、 根拠の重なり(コンフルエンス) が必要です。 RelicusRoad Proは単なる矢印インジケーターではありません。完全な 定量的市場エコシステム です。独自のボラティリティモデリングを用いて、価格が推移する「適正価値の道(Fair Value Road)」をマッピングし、ノイズと真の構造的ブレイクを判別します。 推測はやめましょう。機関投資家レベルの「ロード・ロジック」でトレードを。 コアエンジン:「Road」アルゴリズム システムの中心となる Road Algo は、市場環境にリアルタイムで適応するダイナミックなボラティリティチャネルです。 安全ライン(平衡点) と、価格が数学的に反転しやすい 拡張レベル を投影します。 Si
Introducing the South African Sniper Indicator Created by a dedicated team of South African traders with years of profitable experience in the financial markets, the South African Sniper Indicator is designed to give traders a sharp edge — combining simplicity, precision, and power in one tool. This is a plug-and-play indicator for MT5, built to deliver accurate BUY and SELL (Sniper Entry) signals — complete with target levels and automated trailing stops. Whether you trade forex, indice
note: this indicator is for METATRADER4, if you want the version for METATRADER5 this is the link:  https://www.mql5.com/it/market/product/108106 TRENDMAESTRO ver 2.5 TRENDMAESTRO recognizes a new TREND from the start, he never makes mistakes. The certainty of identifying a new TREND is priceless. DESCRIPTION TRENDMAESTRO identifies a new TREND in the bud, this indicator examines the volatility, volumes and momentum to identify the moment in which there is an explosion of one or more of these da
多くの矢印インジケーターは、シグナルだけを表示して、その後の判断をすべてトレーダーに任せてしまいます。KT Alpha Hunter Arrows は、完整なトレードプランをチャート上に提示します。 各シグナル矢印が表示されるたびに、エントリーライン、ストップロス、4つのテイクプロフィット水準、そして現在の銘柄と時間足が今トレードに値するかどうかを示すリアルタイムのエッジ判定が、すでに描画された状態で表示されます。付属の Trade Manager EA は、あなたが手動でエントリーした後の実行管理を担当し、相場が荒れて判断がぶれやすい場面でも規律あるトレードを保ちやすくします。リペイントなし。確定足シグナルのみ。Forex、ゴールド、指数、その他あなたが取引するあらゆる銘柄に対応します。 主な機能 リペイントしない買い矢印と売り矢印を、足の確定後にのみ表示。 各シグナルに、エントリーライン、構造的ストップロス、4つのテイクプロフィット水準を表示。 Edge Dashboard が、現在のチャートで買いセットアップと売りセットアップを別々に評価。 判定システム:No Edge、Mar
BTCUSD PRO Signal Solution for MT5 BTCUSD PRO is a decision-support indicator for MetaTrader 5, designed for traders who analyze BTCUSD or BTCUSD# with a structured signal workflow. The product is not an automated trading system. It does not open, close, or manage trades automatically. It provides analytical buy and sell signal information and displays a visual trade plan on the chart so the user can make their own trading decisions. Main purpose BTCUSD PRO is designed for traders who prefe
SmartScalping is a powerful trading companion designed to generate high-probability entry signals with dynamic TP/SL/DP levels based on volatility. Built-in performance tracking shows win/loss stats, PP1/PP2 hits, and success rates — all updated live. Key Features: Buy/Sell signals with adaptive volatility bands Real-time TP/SL/DP levels based on ATR Built-in MA Filter with optional ATR/StdDev volatility Performance stats panel (Success, Profit/Loss, PP1/PP2) Alerts via popup, sound, push, or e
ScalpPoint is a powerful trading companion designed to generate high-probability entry signals with dynamic TP/SL/DP levels based on volatility. Built-in performance tracking shows win/loss stats, PP1/PP2 hits, and success rates — all updated live. Key Features: Buy/Sell signals with adaptive volatility bands Real-time TP/SL/DP levels based on ATR Built-in MA Filter with optional ATR/StdDev volatility Performance stats panel (Success, Profit/Loss, PP1/PP2) Alerts via popup, sound, push, or emai
MasterTrend Indicator for MT5 A powerful trend-following and signal-evaluation tool MasterTrend   is a custom MT5 indicator that combines Moving Averages and ATR-based risk/reward logic to generate clear buy/sell signals. It visualizes dynamic SL/TP levels, evaluates past trade outcomes, and displays win/loss statistics in a clean on-chart panel. Key features include: Buy/Sell signals based on MA crossovers ATR-based SL/TP1/TP2/TP3 levels with visual lines and labels Signal outcome tracking wit
このインジケーターは、市場で 関心が示されたゾーン をハイライトし、その後に 注文の蓄積ゾーン を表示します。 これは、大規模な**板情報(オーダーブック)**のように機能します。 これは、 巨大な資金 のためのインジケーターです。その性能は卓越しています。 市場にどんな関心が存在していても、 必ず目に見えるようになります 。 (これは 完全に再設計され、自動化されたバージョン です。もはや手動分析は必要ありません。) トランザクションスピード(取引速度) は新しい概念のインジケーターで、市場で大口注文が どこに・いつ 集中しているかを示し、それに基づいたチャンスを提供します。 トレンドの変化を 非常に早い段階 で察知することができます。 FXでは「出来高」と呼ばれているものは誤解されています。実際には、これは 時間あたりの価格変動量 です。したがって、正しい名称は トランザクションスピード です。 考え方・行動・分析の仕方すべてが問われます。 分析パラダイムの転換は非常に重要です。 このインジケーターは、FXにおける出来高の考え方を 根本から再定義 し、論理的な形で正確に活用する、
AriX
Temirlan Kdyrkhan
1 (4)
AriX Indicator for MT5 A powerful trend-following and signal-evaluation tool AriX is a custom MT5 indicator that combines Moving Averages and ATR-based risk/reward logic to generate clear buy/sell signals. It visualizes dynamic SL/TP levels, evaluates past trade outcomes, and displays win/loss statistics in a clean on-chart panel. Key features include: Buy/Sell signals based on MA crossovers ATR-based SL/TP1/TP2/TP3 levels with visual lines and labels Signal outcome tracking with real-time stat
Liquidation Levels Pro: Smart Liquidity & Trend Dashboard Liquidation Levels Pro è un indicatore avanzato progettato per i trader che vogliono operare dove si muovono i "Big Boys". Identifica i livelli di prezzo in cui è accumulata la maggiore liquidità (ordini di stop e liquidazioni forzate), permettendoti di anticipare rimbalzi violenti o rotture di momentum. A differenza dei classici indicatori di volume, questo strumento calcola il valore monetario stimato (USD) della liquidità presente su l
MetaTrader 5 向けスマート多層ブレイクアウト&プルバック検出器 「スマート・シンプル・ファスト!」 高確率のブレイクアウトエントリーを見逃すことにうんざりしていませんか? 複数のチャートを何時間もスキャンし、ブレイクアウトをトレンド方向と通貨のモメンタムに合わせようとして、それでも動きを逃してしまうことはありませんか? Break Pullback は、1つのインジケーターでそのすべてを解決します。 Break Pullback とは何ですか? Break Pullback は、マーケットストラクチャー、ブレイクアウト、トレンド継続のセットアップを取引するトレーダー向けに特別に設計されたプロフェッショナルグレードの MetaTrader 5 インジケーターです。 リアルタイムで複数の通貨ペアにわたるブレイクとプルバックの形成を自動的に検出し、3層の確認を通じてすべてのシグナルをフィルタリングします: ストラクチャラルブレイクアウト検出 — チャート上の主要なブレイクレベルを特定 HTF 日足バイアス — エントリーを支配的な日足トレンド方向に合わせる 通貨強弱指数 —
相場が本当は何をしているのかを見抜く。   3つの市場フェーズ(収縮・拡張・トレンド)を目の前でライブに捉え、トレンド・フェーズの初期段階でより優れたエントリーを取りましょう   。      当て推量はもう終わり。機関投資家やスマートマネーのように相場を読み始めましょう。   Apex Market Structure Pro(MT5版)は、ノイズを取り除き、あらゆるローソク足の下にある真の構造を見せる高精度のスマートマネー分析ツ   ールです。流動性、構造転換、蓄積ゾーン、トレンドバイアスを、ひとつのクリーンでプロフェッショナルなオーバーレイに集約します。遅行   指標に見切りをつけ、明晰さをもってトレードする準備のできた本気のトレーダーのために作られました。   重要:本インジケーターは Heikin Ashi(平均足)ローソク足での動作を前提に設計されています。使用前にチャートを Heikin Ashi   に設定し、その真価を解き放ってください。分析のすべては Heikin Ashi の価格の流れを軸に構築されています。Apex Market Structure Pr
OrderFlow Absorption – MT5用プロフェッショナル・デルタ&アブソープションシグナルインジケーター OrderFlow Absorptionで本物のオーダーフロー分析の力を解き放ちましょう。MetaTrader 5向けの究極のデルタヒストグラム&アブソープションシグナルインジケーターです。あらゆる価格変動の裏側で何が起きているのかを知りたいトレーダーのために設計されており、市場を動かす隠れた買い/売り圧力や吸収イベントを明らかにします。 特徴 デルタヒストグラムの可視化:   買い圧力・売り圧力を色分けされたヒストグラムで即座に表示。 アブソープションシグナル検出:   高度なロジックで強気・弱気の吸収イベントを特定し、反転の兆しを早期に通知。 チャートマーカー:   吸収シグナルをチャート上に直接マークし、視覚的に分かりやすく表示。 ポップアップアラート:   新しい吸収シグナルが出現した際にリアルタイムで通知。 カスタマイズ可能な閾値:   弱いシグナルを除外し、高確率のセットアップに集中。 リソース管理:   大きなチャートでも高速に動作する効率的な計算。
Presenting one-of-a-kind Gann Indicator for XAUUSD IQ Gold Gann Levels is a non-repainting, precision tool designed exclusively for XAUUSD intraday trading. It uses W.D. Gann’s square root method to plot real-time support and resistance levels, helping traders spot high-probability entries with confidence and clarity. William Delbert Gann (W.D. Gann) was an exceptional market analyst whose trading technique was based on a complex blend of mathematics, geometry, astrology, and ancient calculation
マーケットメーカーのためのツール。 Meravith は次の機能を提供します: すべての時間足を分析し、現在有効なトレンドを表示します。 強気と弱気の出来高が等しくなる流動性ゾーン(出来高均衡)を強調表示します。 異なる時間足のすべての流動性レベルをチャート上に直接表示します。 テキスト形式の市場分析を生成し、参考情報として表示します。 現在のトレンドに基づいて目標値、サポートレベル、ストップロスを計算します。 取引のリスクリワード比を算出します。 口座残高に基づいてポジションサイズを計算し、潜在的な利益を推定します。 また、市場に大きな変化があった場合には警告を表示します。 インジケーターの主要ライン: 強気/弱気の出来高エグゾーストライン ― 目標値として機能します。 市場のトレンドを示すライン。市場が強気か弱気かによって色が変わり、トレンドのサポートとして機能します。主にその色が市場センチメントを示します。 出来高均衡ライン(Eq)。Eq(Volume Equilibrium)ラインはシステムの中核です。これは買い手と売り手の出来高のバランスポイントを表します。市場の流動性を示し
トレーダーの皆さん、こんにちは! 多くの個人トレーダーは、動作の遅いウェブスクリプトに頼っています。真の収益性を実現するには、体系化されたフレームワークが必要です。 Astro AIインジケーターは、一般的なチャートオーバーレイではありません。これは、ターミナル上で直接動作する2つのエージェントを含む、コンパイル済みのニューラルネットワークです。 システムの具体的な技術は以下のとおりです。 1. エージェント1:アナリスト(グラフィカルニューラルネットワーク - GNN) 市場は孤立した価格バーではなく、相互に連結されたデータネットワークです。 機能:エージェント1は、グラフィカルニューラルネットワークを使用して、これらの複雑で非線形な関係をマッピングします。 利点:一般的なインジケーターは過去の移動平均しか考慮しませんが、当社のGNNは市場の深い構造的関係をリアルタイムで処理し、個人トレーダーの取引量が大きな影響を与える前に、隠れた相関関係を明らかにします。 2. エージェント2:エグゼキューター(近接戦略最適化 - PPO) パターン認識は、戦いの半分に過ぎません
OmniSync Projection
Antonio-alin Teculescu
5 (1)
Chronos Fractal Engine is an innovative price projection indicator for MetaTrader 5, designed to transform your technical analysis by intelligently identifying and projecting historical price patterns. Built upon an advanced correlation algorithm and the fractal principles of the market, this powerful tool visualizes potential future price movements, giving you a unique edge in your trading decisions. What is Chronos Fractal Engine? At its core, the Chronos Fractal Engine employs a sophisticat
作者のその他のプロダクト
KURAMA GOLD SIGNAL PRO(MT4版)— 7層フィルター・自動TP/SL・品質スコア・サイン履歴保存搭載 XAUUSD完全トレードシステム リアルタイムでリペイントしません。サインが出た瞬間、矢印・エントリー・TP・SLはその場で固定され、後から動きません。あなたがトレードするのは、この「リアルタイムで出たサイン」です。さらにv7.20では、実際に通知されたサインを自動保存し、再起動後もそのまま復元します。 購入者限定特典 買い切りライセンスをご購入いただいた方に、AI Zone Radar($59相当)+完全PDFマニュアルを無料プレゼント。本体価格に$59相当の特典が付いてきます。購入後にMQL5でメッセージをお送りください。 AI Zone Radar: https://www.mql5.com/en/market/product/175834 ゴールドトレーダーのコミュニティで実際に使用され、精度と使いやすさで高く評価されています。 あな
Gold Signal Swing Pro XAUUSD with Auto TP SL (MT4) — 7層フィルター + RR保証システム搭載 XAUUSDスイング完全トレードシステム リペイントなし。リドローなし。ラグなし。すべてのサインは確定後に変わりません。 購入者限定特典:買い切りライセンスをご購入いただいた方に、AI Zone Radar($59相当)+PDFマニュアルを無料プレゼント。購入後にMQL5でメッセージをお送りください。 AI Zone Radar: https://www.mql5.com/en/market/product/175834 MT5版もあります:  https://www.mql5.com/ja/market/product/177643?source=Site +Profile+Seller ゴールドトレーダーのコミュニティで実際に使用され、精度と使いやすさで高評価。 こんな方におすすめ 仕事や家事で忙しく、M5/M15に張り付けない方 厳選されたサインだけで運用したい方 寝てる間や外出中もポジションを持っておきたい方 1サインで大きく取りた
Gold Signal Swing Pro XAUUSD with Auto TP SL — 7層フィルター + RR保証システム搭載 XAUUSDスイング完全トレードシステム リペイントなし。リドローなし。ラグなし。すべてのサインは確定後に変わりません。 購入者限定特典:買い切りライセンスをご購入いただいた方に、AI Zone Radar($59相当)+PDFマニュアルを無料プレゼント。購入後にMQL5でメッセージをお送りください。 AI Zone Radar: https://www.mql5.com/en/market/product/175834 MT4版もあります: https://www.mql5.com/ja/market/product/177778?source=Site +Market+Product+Page ゴールドトレーダーのコミュニティで実際に使用され、精度と使いやすさで高評価。 こんな方におすすめ 仕事や家事で忙しく、M5/M15に張り付けない方 厳選されたサインだけで運用したい方 寝てる間や外出中もポジションを持っておきたい方 1サインで大きく取りたい方
AI Zone Radar — 5層スコアリング搭載 インテリジェント サポート&レジスタンス検出 手動でラインを引くのはもうやめよう。AI Zone Radarは本当に重要なサポート・レジスタンスゾーンを自動検出し、独自の5層アルゴリズムを使って各ゾーンを1から5までスコアリングする。 「価格はどこで反転するのか?」— AI Zone Radarは推測ではなく数字で答える。 何が違うのか ほとんどのサポート・レジスタンスインジは、すべてのスイング高値と安値にラインを引く。何十本ものラインが出るが、どれが重要かを判断する方法がない。AI Zone RadarはATR適応検出と5層スコアリングシステムを使い、今まさに相場が尊重しているゾーンだけを表示する。 5層スコアリングシステム 第1層 — 実体/ヒゲ分析:ローソク足の実体での価格反応は1.5倍スコア。ヒゲだけのタッチは0.5倍スコア。実体での反応は本物のコミットメントを示す。 第2層 — 指数的時間減衰:最近のタッチほど高スコア。30日以上前のゾーンはほぼゼロまで減衰。フレッシュで関連性のあるゾーンだけが残る
そのEA、なぜ負けたか説明できますか。 多くのEAは、結果しか教えてくれません。勝った、負けた、残高が増えた、減った。なぜ入ったのか、いま入らないのはなぜか、どのサインが自分の口座で効いているのか——最後まで分からないまま、動かし続けることになります。 KURAMA GOLD SWING AUTOは、その逆から設計しました。 【このEAが他と違う、たったひとつのこと】 どのサインがあなたの口座で効いているかを記録し、それを教えます。 すべてのサインを A / B / に自動格付けし、さらに狙う値動きの深さで 速攻 / 短期 / 中期 / 長期 に分類します。3×4=12マス。EAはこの12マスごとに、勝率・件数・損益を記録し続けます。集計元はあなたの実際の口座履歴です。 パネルのボタンひとつで、12マス全部がログに出力されます。どのマスが口座を支えていて、どのマスが足を引っ張っているかが分かります。そのうえで、マス単位でロットを調整できます。効いていないマスは薄く、効いているマスはそのまま。 EA自身も12マスを監視しています。件数が貯まったのに勝率が低く損益もマイナスのマスを見つ
フィルタ:
Yik Hung Lai
1198
Yik Hung Lai 2026.07.04 02:18 
 

i bought Gold Signal Pro with Auto TP SL and Gold Signal Swing Pro XAUUSD with Auto TP SL,very easy to use

Genki Andou
747
開発者からの返信 Genki Andou 2026.07.05 08:54
Thank you so much for the review, and for choosing both the scalping and swing versions! I'm really glad you find them easy to use — that's exactly what I aim for. If you ever have questions as you trade, feel free to reach out anytime. Happy trading!
Violette
660
Violette 2026.06.10 14:04 
 

I did buy a LOT of indicators of the market and they all went to the trash. This one is different because it's the first one which gives me good profit, i'm very satisfied of this indicator and the seller is very friendly. I for example had losses in my account because of an EA (which did go to the trash also) and within 1 week i did recover all thanks to this indicator, so thank you very much ! I must also say that even if the history repaints after refresh, it's absolutely not a problem as i'm continuesly doing profits since 2 weeks. I recommand.

Genki Andou
747
開発者からの返信 Genki Andou 2026.06.10 22:53
Thank you so much for this wonderful review, Violette! I'm truly happy to hear you recovered your losses within a week and have been consistently profitable for two weeks now. That's exactly the kind of result I built this tool for. And I really appreciate you pointing out that the recalculation on refresh is not a problem in real trading — as an active, profitable user, your perspective means a lot. Keep up the disciplined trading, and feel free to reach out anytime if you have questions. Wishing you continued success!
404 strategy not found
568
404 strategy not found 2026.06.02 13:57 
 

I want to open with the concerns, as these are the most material considerations for any prospective buyer.

The most significant issue is that the indicator panel does not display in backtests. This is a meaningful limitation, because it prevents buyers from assessing the true hit-rate prior to purchase. When the indicator is first applied to the chart, a number of past losing trades are removed and excluded from the count, which inflates the displayed performance. Only a forward test conducted after purchase reveals the actual results. In my case, the win-rate settled closer to 55–60%, materially below the 80%+ the panel initially suggests. This is a poor practice and, at minimum, creates a misleading impression of performance.

A second concern is that the variable settings in the input tab are non-functional. Adjusting them produces no change in the signals. The developer has explained that the logic is entirely internal, which raises the question of why the input tab presents these parameters as adjustable when they are, in fact, fixed. There is also an inconsistency whereby removing and reapplying the indicator causes some entries to disappear; if left running without reloading, the signals remain stable. Collectively, these issues call into question how mature and transparent the strategy actually is, and prospective users should be prepared to apply additional indicators to filter the signals.

To be clear, I do not consider this a scam, and I have no direct evidence of bad faith on the part of the author. That said, the combination of inflated backtest figures, non-functional inputs, and a performance panel that flatters early results does give the product the appearance of one, and buyers should evaluate it on that basis rather than on the initial numbers.

On the positive side, the strategy does have merit. The chart displays TP and SL levels, which makes execution straightforward. The developer was responsive and provided support promptly when required. As with any strategy, results depend on discipline, practice, and adherence to the manual. I will update this review if the situation changes.

Genki Andou
747
開発者からの返信 Genki Andou 2026.06.02 21:30
Thank you for the fair and thoughtful review, Gerard. You've understood the indicator perfectly: signals never disappear during live trading — only on a full reload (remove/re-add, timeframe switch, restart). I'd like to explain why this is a deliberate design choice rather than a bug. The indicator fires signals in real-time, the moment price touches an MA during bar formation — not waiting for the candle to close. This is what lets you enter early, before price runs toward TP. The tradeoff is that real-time signals cannot perfectly match a recalculation, which only sees completed bar data after the fact. To make historical signals 100% fixed, I would have to delay every signal until the candle closes — meaning entries come 5 minutes late on M5, often after price has already moved. I made this choice deliberately: I wanted to build an indicator that actually helps users win in live trading, not one that simply looks perfect in hindsight. Real-time entries are what make money. As you said — let it run, and no signals disappear. Thank you for trading with discipline and for the kind words about support. Wishing you continued success!
khkh14
273
khkh14 2026.06.02 03:06 
 

**Repaints despite being advertised as "No Repaint."** Purchased based on the explicit claim: "No repaint. No redraw. Every signal stays fixed once confirmed." After testing, I found that historical arrows changed after a simple chart reload (changing timeframe and changing back). The seller later confirmed that historical signals can change after recalculation. This directly contradicts the product description. A signal that changes after recalculation is not "fixed once confirmed." The actual behavior was not clearly disclosed and was a key factor in my purchase decision. Had the true behavior been disclosed before purchase, I would not have bought this indicator.

*** BELOW IS THE REPLY to AUTHOR'S COMMENT***

Your explanation confirms that historical signals are recalculated and can change after a reload.

That is precisely the problem.

In my testing, the recalculated chart appeared to contain fewer losing signals and a higher-quality signal history than what was originally displayed. This creates the impression of a much better-performing indicator than what traders actually experienced in real time.

If historical signals are modified after the fact, then any win rate, signal history, or performance statistics derived from those signals become unreliable because they are based on hindsight-adjusted results.

Calling this "recalculation" instead of "repainting" does not change the underlying fact that historical signals are not fixed and can change after the event.

A signal that can disappear or change after it has been plotted is not "fixed once confirmed."

Genki Andou
747
開発者からの返信 Genki Andou 2026.06.02 03:49
Thank you for your feedback. To be clear for anyone reading this: the indicator does NOT repaint during live trading. Once a signal appears on the current bar, it stays fixed. This is verified by all active users, including one who achieved a 96.49% win rate over 57 trades in 9 days of live trading. What the reviewer describes is recalculation behavior that occurs when the indicator is reloaded from scratch (chart refresh, timeframe switch, MT restart). This resets internal cooldown counters and can produce slightly different signals on historical bars. This is standard behavior for any indicator that uses internal state tracking, across any platform. This has zero impact on live trading. You trade the signal when it appears in real-time. No entry, TP, SL, or result is affected. I have updated the product description to make this distinction even clearer. The "no repaint" claim applies to real-time signals, which is the industry-standard definition used across MQL5 Market.
jcasas311948 Casas
198
jcasas311948 Casas 2026.04.17 11:31 
 

El 18 de Abril del 2.026, alquile por un mes el indicador Gold Signal Pro with Auto TP SL y desde el primer momento, las señales fueron perfectas y el resultado de las primeras dos semanas fue espectacular: -Total de señales en el mercado de Londres y Nueva York = 110 -Total de señales en las que he entrado =57 - Operaciones positivas 55 (96,49%) - Resultados de los 9 días operados= 8.923$ RESULTADOS REALES 20/30- Abril 2.026 Total 9 dias Op. Total Señales Dia /Semana -177 100% Señales en M. Asiatico -67 38% S. en M. Londres + N.Y. -110 62% Señales de Venta -86 48,59% Señales de Compra -57 32,20% Solo mercado de London + NY Señales Buenas -77 70,00% Señales Malas -33 30,00% NO entrado -53 48,18% Entrado L/NY -57 51,82% Beneficio $ 9.313,85 Operaciones positivas -55 96,49% Perdida -$ 390,51 Operaciones Negativas -2 3,51% Resultado total SEMANA -$ 8.923,34 En la segunda semana pude constatar que el indicador tenia una serie de pequeñas incidencias en MT5 y se las manifesté al desarrollador, el cual en la actualización de hoy 7,13, parece que están todas superadas y mejorado el rendimiento en MT5. Por todo ello recomiendo este indicador Gold Signal Pro with Auto TP SL y yo confirmo que cuando venza el mes de alquiler , lo compraré definitivamente. Un saludo..... Atentamente: Jose Casas

Hoy domingo 17 de Mayo de 2026, confirmo que he adquirido la licencia de compra completa, espero recibir AI Zone Radar + manual PD.

Un saludo....... Atentamente: Jose Casas

Recibido.... Gracias.

Genki Andou
747
開発者からの返信 Genki Andou 2026.06.14 06:56
¡Hola Jose! Muchísimas gracias por adquirir la licencia completa y por esta reseña tan detallada y generosa. Significa mucho para mí. Tus resultados son extraordinarios, y sobre todo admiro tu disciplina: operar solo en Londres y Nueva York, filtrar las señales débiles y entrar con criterio. Ese es exactamente el uso que hace que el indicador brille. También te agradezco mucho tu feedback sobre MT5 — gracias a tus observaciones pude lanzar la actualización 7.13 con el rendimiento mejorado. Me ayudaste a mejorar el producto para todos. Me alegra que ya hayas recibido AI Zone Radar y el manual. Si tienes cualquier duda sobre cómo combinarlo con el indicador, no dudes en escribirme. ¡Gracias por tu confianza, Jose! Un fuerte saludo.
レビューに返信















