Objects synchronization for mt4

4.25

The indicator synchronizes eight types of markings on several charts of one trading instrument.
This indicator is convenient to use in conjunction with "Multichart Dashboard" or other similar assistant that allows you to work with several charts at the same time.
"Multichart Dashboard" can be found under the link on my youtube channel.


Settings:

enable vertical line synchronization
enable horizontal line synchronization
enable Trend Line synchronization
enabling Fibonacci Retracement synchronization
enable Equidistant Channel sync
enable Rectangle  sync

enable   Text sync
enable   Arrow  sync
enable display of the SynchButton
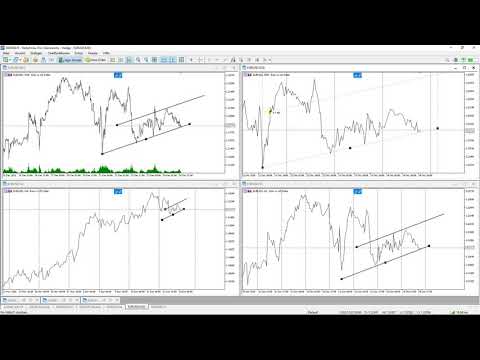

Video Objects synchronization for mt4
レビュー 22
plast008
14
plast008 2023.03.13 19:33 
 

оч полезный !

PipsMT5
24
PipsMT5 2023.02.20 02:06 
 

Excelente

varon
531
varon 2023.01.11 17:48 
 

Thank you very much for this amazing tool!!! The BEST!!!

おすすめのプロダクト
Overview The script displays information about the trade account: Account - account number and type (Real or Demo); Name - name of the account owner; Company - name of a company that provide the access to trading; Server - trade server name; Connection State - connection state; Trade Allowed - shows whether trading is allowed on the account at the moment; Balance - account balance; Equity - account equity; Credit - amount of credit; Profit - profit size; Free Margin - free margin on the account;
FREE
The MA in Color_PRT Indicator offers valuable insights into market trends by displaying moving averages in different colors based on their direction. Green indicates an uptrend, red for a downtrend, and yellow for a consolidation phase. Traders can use this indicator to easily identify potential entry and exit points in their forex trades. When the lines change color, it can signal a change in market direction, giving traders an opportunity to adjust their strategy accordingly. Additionally, th
FREE
Shadow System Candles - トレンド可視化システム コンセプト 「暗闇での乱射はやめろ。相場にナイトビジョンを装備せよ」 Shadow System Candlesは、FXトレードプロジェクト「Shadow Operation」の視覚コアシステムです。 AIロジック(ADXと移動平均の統合判断)に基づき、ノイズを排除し、相場の「真のトレンド方向」をローソク足の色で可視化します。 ※本ツールは矢印シグナルは出ません。トレンドの「発生」と「消滅」を視覚的に認識するための訓練用、および裁量トレードのフィルターとして機能します。 機能: ・AIロジックによる色分け トレンドの強弱を5段階で表示します。 ・濃い青 (Deep Blue) 強力な上昇トレンド(加速フェーズ) ・薄い青 (Light Blue) 上昇トレンド ・グレー (Gray) レンジ / 膠着状態(待機推奨) ・薄い赤 (Light Red) 下降トレンド ・濃い赤 (Deep Red) 強力な下降トレンド(加速フェーズ) 規律の強制 グレーの期間は「手出し無用」。無駄な往復ビンタを防ぎます。完全
FREE
MQLTA Candle Timer
MQL4 Trading Automation
5 (1)
MQLTA Candle Timer is an indicator that can show you the details about a symbol/pair and alert you before the close of a candle. Used in swing trading and not only, it can help your strategies knowing and be ready before the close of a candle. How does it work Simply add the indicator to the chart and set the notifications options. You can load a minimalistic interface or a full interface. The alert will be sent once per candle. Parameters All the parameters, that you can see in the picture, a
FREE
ControlPoints Indicator Purpose: Identifies Control Points (CP) — local extremums (fractals) on the chart. Upper CPs are local highs, lower CPs are local lows. Displayed on the chart as diamond markers. No-Repaint: The indicator does not repaint. A CP at bar i is only confirmed when all bars in the window [i − BarsBefore, i + BarsAfter] are closed. The forming (current) bar is never evaluated. Once confirmed, the value is never recalculated. Detection Logic Upper CP: high[i] is strictly greater
FREE
このツールは、2つの大きなメリットを提供します。MT5の経済指標の使いやすさを向上させ、データをMT4とシームレスに共有できるようにします。例えば、10年以上前の経済指標データを効果的に利用して、トレーニングやバックテストを行うことができます。また、MT4の PracticeSimulator と互換性があり、歴史的データを用いたトレード練習からMT4でのリアルトレードまで幅広く活用できる価値のあるツールです。 重要な注意事項 このツールはMT5から経済指標データを取得する必要があるため、MT4版単体では動作しません。MT5版も必ずインストールしてください。 => MT5版 MT5経済指標の向上 歴史データへのアクセス : 10年以上前のイベントを含む経済指標データを分析することで、詳細なバックテストや履歴レビューが可能です。 カスタマイズ可能な表示 : 経済指標はチャート上に目立たないように表示され、データを背景に溶け込ませるオプションも選択可能です。 自動時間調整 : 時間帯やサマータイムを自動的に調整し、過去のイベントを正確に表示します。 MT4の互換性とメリット シームレスな
FREE
This indicator uses a different approach from the previous version to get it's trendlines. This method is derived from Orchard Forex, and the process of making the indicator is demonstrated in there video   https://www.youtube.com/watch?v=mEaiurw56wY&t=1425s . The basic idea behind this indicator is it draws a   tangent line   on the highest levels and lowest levels of the bars used for calculation, while ensuring that the lines don't intersect with the bars in review (alittle confusing? I know
FREE
Relative Volume MT4
Alberto Gauer Borrego
4 (1)
Relative Volume or RVOL is an indicator that averages the volume of X amount of days, making it easy to compare sessions volumes. The histogram only has 3 colors: Green - Above average volume Yellow - Average volume Red - Below average volume The default setting is 20 days, which corresponds more or less to a month of trading. With the data obtained from this indicator you can better gauge the commitment behind a move. For example, you will be better equipped to judge if a breakout of a r
FREE
Jerk Indicator
Safwan Rushdi Khalil Arekat
5 (1)
In physics, "Jerk" is the third time-derivative of position, with acceleration being the second derivative and velocity the first derivative. In technical analysis, the first derivative of price is the price momentum, with the second derivative,acceleration, being seldom used and the third derivative virtually unknown. The magnitude frequency response of a digital differentiator is a positive-slope straight line passing through zero frequency. Therefore, every instance of a digital signal differ
FREE
Donchian通道(唐奇安通道指标)是用于交易突破的最古老、最简单的技术指标之一。 一般来说,唐奇安通道的宽度越宽,市场波动就越大,而唐奇安通道越窄,市场波动性也就越小 。此外,价格走势可以穿过布林带,但你看不到唐奇安通道的这种特征,因为其波段正在测量特定时期的最高价和最低价。 交易实用必备工具指标 波浪自动计算指标,通道趋势交易 完美的趋势-波浪自动计算通道计算 , MT4版本 完美的趋势-波浪自动计算通道计算 , MT5版本 本地跟单复制交易 Easy And Fast Copy , MT4版本 Easy And Fast Copy , MT5版本 本地跟单复制交易 模拟试用 Easy And Fast Copy , MT4 模拟账号运行 Easy And Fast Copy , MT5 模拟账号运行 唐奇安通道指标计算: 唐奇安上阻力线 - 由过去N天的当日最高价的最大值形成。 唐奇安下支撑线 - 由过去N天的当日最低价的最小值形成。 中心线 - (上线 + 下线)/ 2   唐奇安通道信号   唐奇安通道常用作突破指标。它提供了两种主要类型的突破信号,一个是上阻力线或下支撑线
FREE
Target Profit All
Mr Nukool Chanchingchit
5 (1)
What is a tool ? Used for monitoring profit summary in your portfolio, by setting profit target. The tool will automatically close all open orders. When the profits meet the target set. How to use Place the tool on any currency pair, any timeframe and set profit target. Easy... Currency Pair : Any Timeframe : Any Input Parameter Summary profit for auto close all orders ($) Meaning : Input your profit target here. Visit my products Target Profit Magic Target Profit All The Profit Tracker Currenc
FREE
EMA Separation plots 2 exponential moving averages, and a fill between them. The fill is colored differently according to an uptrend (short period EMA above long period EMA), or a downtrend (short period EMA below long period EMA). This is a small tool to help visualize the difference between long and short period averages. We hope you enjoy! EMA Separation can also be paired with our free EMA Separation Coefficient Parameters Short period (Default=10): # bars used to calculate short period EMA
FREE
TequilaEA 取引戦略ドキュメント 1. 基本情報 名前 : TequilaEA バージョン : 1.0 対応商品 : XAUUSD(金 / 米ドル) 対応時間足 : M1(1 分足チャート) 開発元 : Tulip Financial Technology 2. コア取引ロジック 本 EA は技術指標の組み合わせと価格パターン認識に基づいて取引決定を行い、以下のコアロジックを持つ: トレンド判断 MACD 指標(パラメータ 12,26,9)を使用して全体的なトレンド方向を判断: MACD 主線>0 の場合、強気トレンドと判定 MACD 主線<0 の場合、弱気トレンドと判定 エントリー条件 ロングエントリー : MACD 主線>0(強気トレンドに一致) 価格が 15 連続の M1 期間に MA1(10 期)、MA2(20 期)、MA3(30 期)の移動平均線上に終値を付ける ショートエントリー : MACD 主線<0(弱気トレンドに一致) 価格が 20 連続の M1 期間に MA1(10 期)、MA2(20 期)、MA3(30 期)の移動平均線下に終値を付ける 注文管理ルール 最
FREE
Super trend is one of the best trend indicators in metatrader 4 (MT4). Triple SuperTrend indicator is an indicator that consist of three super trend indicator that can be aranged. This indicator is built by mql4 language and doesn't provided by MT4 platform. Highly recommended using EMA SuperTrend Strategy Indicator if you want to get better result in here: https://www.mql5.com/en/market/product/91664 This indicator is easy to use, power full and has many benefits, there are: Using three indic
FREE
It is a custom non-repaint indicator to identify trade opportunities in swing action as prices move within an upper and lower band. Inspired by the Keltner Channel, the most popular channel Indicator introduced by Chester Keltner. It is different with a Bollinger Bands. It represents volatility using the high and low prices, while Bollinger's studies rely on the standard deviation. The algorithm for this indicator is also available in the EntryMaximator EA. Including the option to use it or not.
FREE
Wa Candle Timer Percentage
Wachinou Lionnel Pyrrhus Sovi Guidi
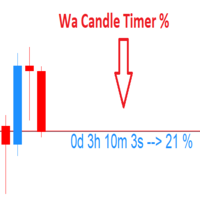
Wa Candle Timer Percentage MT4 is an indicator which shows the user how much time is remaining until the next candle will form. The percentage of the evolution of the current candle is also displayed. The user can set the percentage that the candle timer will change the color. These are the settings: 1- The percentage that the candle timer will change the color. 2- Color of Candle Timer when it's BELOW the percentage set by the user. 3- Color of Candle Timer when it's ABOVE the percentage set b
FREE
Blahtech Moving Average indicator is a multitimeframe version of the standard Moving Average indicator. It is also enhanced with customisable alerts, period breaks and other configuration options. The 50 day and 200 day moving averages are widely followed by investors and traders, with breaks above and below the MA lines considered to be signals of interest. Links [  Install  |  Update  |   Training   |   All Products  ] Feature Highlights Up to three timeframes Configurable calculation variabl
FREE
MACD Scanner With Alerts
Niravkumar Maganbhai Patel
4 (2)
MACD Dashboard Panel   This indicator helps you to scan symbols which are in the Market Watch window and filter out a trend according to MACD. Moving Average Convergence Divergence (MACD) is a trend-following momentum indicator that shows the relationship between two moving averages of a security’s price. The MACD is calculated by subtracting the 26-period Exponential Moving Average (EMA) from the 12-period EMA. The result of that calculation is the MACD line. A nine-day EMA of the MACD called
FREE
On Screen Display that shows highest highs and lowest lows on chart. Very helpful with manually trading.  DEFAULT SETTINGS (INPUTS) Highest high candle -10 meaning it goes back 10 candles on the timeframe you are on, to get the highest high point of that candle.  Lowest low candle - 10 meaning it goes back 10 candles on the timeframe you are on, to get the lowest low point of that candle. Colors- you can change the colors of the lines. IT THEN TRACES THE LINE SO IT MAKES IT EASIER TO SEE WHATS
FREE
IntraScalpermt4 Indicator   is an advanced, dynamic level-providing strategy/ Signals built in proven price action principles. At the start of every trading session, it automatically calculates the decisive   Levels —a key point that DECIDER guides high-probability trade opportunities. Indicators Including:- 1.  Day Trading Levels. 2.  IntraTrend Line for Scalping using M1 TF. 3.  Dynamic IntraScalper providing supply or demand zone on chart. 4.  EA Setting/Documentation in Indicator=> About T
FREE
このエキスパートアドバイザーは取引を行いませんが、マーケットウォッチ内のシンボル全体をスキャンし、異なる時間枠で各株を 1 つずつスキャンし、最後に、どの時間枠のどのシンボルが強力な巻き込みローソク足を持っているかを示します。 さらに、MA 期間と RSI の上限と下限を定義でき、どのタイムフレームのどのシンボルが調整済み移動平均を超えるか、また、どのタイムフレームのどのシンボルが調整移動平均の上限または下限を超えるかが表示されます。 RSI。 Kono ekisupātoadobaizā wa torihiki o okonaimasenga, mākettou~otchi-nai no shinboru zentai o sukyan shi, kotonaru jikan-waku de kaku kabu o 1-tsu zutsu sukyan shi, saigo ni, dono toki-waku no dono shinboru ga kyōryokuna makikomi rōsoku ashi o motte iru ka o shimeshimasu. S
FREE
Position Manager Pro v1.0 (MT4) Dual Magic Number Independent Group Manager with Live P&L Dashboard Overview Position Manager Pro is a powerful trade management Expert Advisor for MetaTrader 4 that operates as an overlay manager — it does not open positions itself, but instead manages and monitors positions opened by other EAs or manually by the trader. The core concept is two fully independent groups , each identified by a unique Magic Number . Each group has its own Take Profit, Stop Loss, and
FREE
FastTMALine_mth_PRT is non-redrawn channel indicator and can be used to identify trend and support and resistance levels. Indicator settings allow you to assign a specific coefficient to each price channel, which makes it possible to narrow or expand each channel separately. The   FastTMALine_mth_PRT   indicator is a multicurrency instrument, so the choice of a timeframe depends solely on the trader’s preference.   FastTMALine_mth_PRT   indicator   can be used on any time frame, so you can eas
FREE
AD Trend line
Pavel Shutovskiy
5 (1)
AD Trend line draws trend lines on the basis of A/D indicator (Accumulation/Distribution). When A/D indicator breaks a trend line, the probability of the trend reversal is very high. This is a multitimeframe indicator which can display values from higher timeframes. Parameters Time-frame — Select a timeframe; zero is the current timeframe of the chart; Trend Line — Display lines on the chart; Apply to — Apply lines to close the candle's highest/lowest value; Width line — Width of the line; Style
FREE
Supertrend Pure MT5 - High-Precision Trend Follower レビューとコメントのスコアを与えれば、プログラムを作業するのに大きな力になります。ありがとうございます。 [製品説明/Description] Supertrend Pureは、トレーディングの本質に焦点を当てた最もクリーンで強力なトレンド指標です。複雑な設定を排除し、数学的に最適化されたATR(Average True Range)計算により、市場の騒音を排除し、実際のトレンドだけを捉えます。 Key Features: Pure Algorithm: リペインティングが全くない信頼できる信号を提供します。 スマートビジュアライゼーション:上昇傾向はアクア、下降傾向はトマトカラーで即座に視覚的に読み取ることができます。 Multi-Purpose:スキャルピングからデイトレーディング、スイングトレーディングまで、すべてのタイムフレームで動作します。 Lightweight: コードを最適化して複数のチャートに表示しても端末速度の低下はありません。 [設定方法/Paramet
FREE
For those who like trend the Force will be a very useful indicator. This is because it is based on the famouse ADX, which measure the strenght of a trend, but without its 3 confusing lines. Force has its very simple interpretation: if the histogram is above zero level the trend is up, otherwise it is down. You can use it to find divergences too, which is very profitable. If you have any doubt or suggestion, please, contact me. Enjoy! MT5 version:  https://www.mql5.com/en/market/product/41928 T
FREE
Overview The Period Breakout Indicator is a versatile tool designed for traders seeking to identify breakout opportunities based on customizable time periods. This indicator automatically determines the highest and lowest prices within a user-defined period, allowing you to tailor it precisely to your trading strategy. Key Features Customizable Time Periods: Define the start and end times based on your preferred trading hours or any specific period. The indicator will then calculate the highest
FREE
The Hong Kong Stock Exchange Session's Hours This indicator facilitates observing the currency pair's quotations during subsequent parts of the stock exchange session live. Before the session starts, a rectangle is drawn on the chart but not filled in with color. It means the extent of the session duration. Before the first bar enters the rectangle of the session, a sound signal or pop-up window will notify us that the session will just start. When the price graph crosses the edge of the sessi
FREE
Introducing   Arrogante EA , an Expert Advisor designed for the MetaTrader 4 (MT4) platform. This EA utilizes a trend-following strategy combined with specific reentry signals derived from a blend of technical indicators. It also features a configurable Martingale system for position management and recovery. Arrogante EA is suitable for traders looking for Forex trading automation and who are comfortable with strategies involving Martingale as a recovery method. Key Features: Entry Strategy: Use
FREE
このロボットは、トレンドフォローのロジックを搭載しています。 具体的には、パラボリックインジケーターを使い、価格が、通常の推移よりも大きく動いたときに、トレンドを検出しています。 どのくらい価格が変動したら、エントリーするかは、任意のPIPSを入力できます。 万が一、トレンドが逆になってしまった場合は、保有しているオーダーはすべてクローズします。 同時に保有できるオーダー数は任意に変更できます。 またtake profit は、複数オーダーを保有している場合は、トータルのPipsがターゲットに達した場合、すべてのオーダーがクローズします。 特に難しい設定はありません。 また、日々の利益のターゲットを任意に入力できます。 例えば、少額の資産でスタートした場合、日々の利益を例えば、$5くらに設定しておけば、EAはそれ以上のオーダーを出しません。安定稼働します。 通貨は、特に指定はありませんが、タイムフレームはH1もしくはH4がとても安定しています。
FREE
このプロダクトを購入した人は以下も購入しています
Genesis Matrix Pro is a professional multi-timeframe trend detection indicator designed to help traders identify high-quality market alignment with clarity and structure. It combines 12 different technical indicators into one visual alignment matrix, allowing traders to quickly see when market conditions are bullish, bearish, or neutral. A signal is generated only when the selected strategies are aligned, helping reduce noise and improve decision-making. PLEASE CONTACT ME AFTER PURCHASE TO GET
Gann Made Easy は、ミスター・ギャンの理論を使用した取引の最良の原則に基づいた、プロフェッショナルで使いやすい外国為替取引システムです。 W・D・ガン。このインジケーターは、ストップロスとテイクプロフィットレベルを含む正確な買いと売りのシグナルを提供します。 PUSH通知を利用して外出先でも取引可能です。 ご購入後、取引方法の説明と優れた追加インジケーターを無料で入手するには、私にご連絡ください! おそらく、ギャンの取引手法についてはすでに何度も聞いたことがあるでしょう。通常、ギャンの理論は初心者のトレーダーだけでなく、すでにある程度の取引経験がある人にとっても非常に複雑なものです。なぜなら、ギャンの取引手法は理論的にはそれほど簡単に適用できるものではないからです。私はその知識を磨き、最良の原則を私の外国為替インジケーターに組み込むために数年を費やしました。 このインジケーターは非常に簡単に適用できます。必要なのは、それをチャートに添付し、簡単な取引推奨事項に従うだけです。このインジケーターは常に市場分析の仕事を行い、取引の機会を探します。適切なエントリーポイントを検出す
Scalper Inside PRO Scalper Inside PRO は、MetaTrader 4 向けの短期トレンドおよびスキャルピング用インジケーターです。独自アルゴリズムを用いて、市場の方向性と主要なターゲットレベルを素早く検出します。エントリー、イグジット、複数の利確ターゲットを自動計算し、詳細なパフォーマンス統計を表示することで、さまざまな銘柄やストラテジーがどのように機能してきたかを確認できます。これにより、現在のマーケットコンディションに最も適した取引銘柄を選択するのに役立ちます。さらに、Scalper Inside PRO には、お使いの矢印インジケーターを簡単に接続でき、その統計と過去のパフォーマンスを素早く評価できます。 本インジケーターは、あらゆる銘柄と時間足で動作し(短期トレードには M5 を推奨)、複数の内蔵ストラテジーを備えています。そのため、単体のスキャルピングツールとしても、トレーディングシステム内の強力な分析コンポーネントとしても活用できます。 主な機能 独自アルゴリズム(Next‑Generation Trend Detection Algor
Neuro Poseidon is a new indicator by Daria Rezueva. It combines precise trading signals with adaptive TP/SL levels - creating best possible trades as a result! Message me and get  Neuro Poseidon Assistant  as a gift to automize your trading process! What makes it stand out? 1. Proven profitability on all assets and timeframes 2. Only confirmed BUY and SELL signals present on the chart 3. Adaptive TP & SL levels generated by the software for each trade 4. Easy to understand - suitable for all
M1 SNIPER は使いやすいトレーディングインジケーターシステムです。M1時間足向けに設計された矢印インジケーターです。M1時間足でのスキャルピングのためのスタンドアロンシステムとして、また既存のトレーディングシステムの一部としても使用できます。このトレーディングシステムはM1時間足での取引に特化して設計されていますが、他の時間足でも使用できます。元々、この手法はXAUUSDとBTCUSDの取引用に設計しましたが、他の市場においても役立つと考えています。 インジケーターのシグナルは、トレンドの方向と逆方向に取引できます。インジケーターのシグナルを利用して両方向に取引するのに役立つ特別な取引テクニックをご紹介します。この手法は、特別な動的なサポートとレジスタンスの価格帯を利用することに基づいています。 ご購入後、M1 SNIPER矢印インジケーターをすぐにダウンロードできます。さらに、M1 SNIPERツールのすべてのユーザーに、以下のスクリーンショットに表示されているApollo Dynamic SRインジケーターを無料で提供しています。この2つのインジケーターを組み合わせることで
Dynamic Forex28 Navigator - 次世代の Forex 取引ツール。 現在 49% オフ。 Dynamic Forex28 Navigator は、長年人気のインジケーターを進化させたもので、3 つの機能を 1 つにまとめています。 Advanced Currency Strength28 インジケーター (レビュー 695 件)  + Advanced Currency IMPULSE with ALERT (レビュー 520 件) + CS28 コンボ シグナル (ボーナス)。 インジケーターの詳細 https://www.mql5.com/en/blogs/post/758844 次世代の Strength インジケーターが提供するもの  オリジナルで気に入っていたすべての機能が、新機能と精度の向上によって強化されました。 主な機能: 独自の通貨強度計算式。 すべての時間枠でスムーズかつ正確な強度ライン。 トレンドの特定と正確なエントリーに最適です。 ダイナミックマーケットフィボナッチレベル (マーケットフィボナッチ)。 このインジケーターに固有
まず第一に、この取引ツールはノンリペイント、ノンリドロー、ノンラグの指標であり、プロの取引に理想的ですことを強調する価値があります。 オンラインコース、ユーザーマニュアル、デモ。 スマートプライスアクションコンセプトインジケーターは、新米から経験豊富なトレーダーまで、非常 に強力なツールです。Inner Circle Trader AnalysisやSmart Money Concepts Trading Strategiesなど、20以上の有用な指標を1つに組み合わせています。このインジケーターはスマートマネーコンセプトに焦点を当て、大手機関の取引方法を提供し、彼らの動きを予測するのに役立ちます。 特に、流動性分析に優れており、機関がどのように取引しているかを理解しやすくしています。市場のトレンドを予測し、価格の動きを慎重に分析するのに優れています。機関の戦略とトレードを合わせることで、市場の動向についてより正確な予測ができます。このインジケーターは多目的であり、市場構造を分析し、重要な注文ブロックを特定し、さまざまなパターンを認識するのに優れています。 このインジケーターは
このインジケーターは、反転ポイントと価格戻りゾーンを正確に表示します。     主要プレーヤー 。新たなトレンドが形成される場所を把握し、最大限の精度で意思決定を行い、すべての取引をコントロールします。 TREND LINES PRO インジケーターと組み合わせることで、その潜在能力を最大限に発揮します。 VERSION MT5 インジケーターが示す内容: 新しいトレンドの始まりに活性化する反転構造と反転レベル。 リスクと報酬の比率を最小限に抑えた利益 確定 と 損失停止の レベルの表示     RR 1:2   。 インテリジェントな削減ロジックによるストップロス。 指定されたインジケーターから 2 つのトレンド タイプの反転パターンを表示します。 指標: トレンドを追う   TREND LINES PRO   (世界的なトレンドの変化) TREND PRO   (クイックトレンド変更) シンプルで効果的   スキャナー   リアルタイムトレンド(新機能)。 マルチタイムフレームのインストゥルメント フィルタリング。 画面   利益     LOGIC AI信号の後。 当日プラス方
PRO Renko Systemは、特別にRENKOチャートを取引するために設計された高精度の取引システムです。 これは、様々な取引商品に適用することができる普遍的なシステムです。 システムは効果的に正確な逆転信号へのアクセスを与えるいわゆる市場の騒音を中和する。 表示器は非常に使いやすく、信号の生成に責任がある1つの変数だけがあります。 あなたは簡単にお好みの任意の取引ツールとレンコバーのサイズにツールを適応させることができます。 私はいつもあなたが私のソフトウェアで収益性の高い取引を支援するために余分なサポートを提供する準備ができています! 私はあなたに幸せで収益性の高い取引をしたいです! ご購入後にご連絡ください! 私はあなたに私のレンコチャートジェネレータを送信します。 私はまた、私の個人的な推奨事項やシステムの他のモジュールを無料で共有します!
優れたテクニカルインジケーター「Grabber」をご紹介します。これは、すぐに使える「オールインワン」トレーディング戦略として機能します。 ひとつのコードに、市場のテクニカル分析ツール、取引シグナル(矢印)、アラート機能、プッシュ通知が強力に統合されています。 このインジケーターを購入された方には、以下の特典を無料で提供します: Grabberユーティリティ:オープンポジションを自動で管理するツール ステップバイステップのビデオマニュアル:インジケーターのインストール、設定、取引方法を解説 カスタムセットファイル:インジケーターをすばやく自動設定し、最大限の成果を出すための設定ファイル 他の戦略はもう忘れてください!Grabberだけが、あなたを新たなトレードの高みへと導いてくれるのです。 Grabber戦略の主な特徴: 推奨タイムフレーム:M5〜H4 対応通貨ペア・資産:どれでも使用可能ですが、私が実際に検証した以下を推奨します(GBPUSD、GBPCAD、GBPCHF、AUDCAD、AUDUSD、AUDSGD、AUDCHF、NZDUSD、NZDCAD、EURCAD、EURUSD、E
トレンドキャッチャーインジケーター トレンドキャッチャーインジケーターは、開発者独自の適応型トレンド分析指標を組み合わせることで、市場価格の動きを分析します。短期的なノイズを除去し、根底にあるモメンタムの強さ、ボラティリティの拡大、価格構造の挙動に焦点を当てることで、真の市場方向性を特定します。また、移動平均線、RSI、ボラティリティフィルターなどの平滑化およびトレンドフィルタリング機能を備えたカスタマイズ指標も使用します。 実際の運用状況のモニタリングやその他の製品については、こちらをご覧ください: https://www.mql5.com/en/users/mechanic/seller ご注意ください。私はTelegramでEAや設定を販売していません。詐欺です。すべての設定はブログで無料で公開しています。 重要!ご購入後すぐにご連絡ください。手順とボーナスをお送りします!
これはMT4のインジケーターで、再描画なしで取引に参入するための正確なシグナルを提供します。 外国為替、暗号通貨、金属、株式、インデックスなど、あらゆる金融資産に適用できます。かなり正確な見積もりを提供し、取引を開始して終了するのに最適な時期を教えてくれます。1つのシグナルを処理しただけでインジケーターの元が取れた例の 動画 (6:22)をご覧ください。Entry PointsPro インジケーターの助けを借りたほとんどのトレーダーの最初の1週間の結果が改善しています。 Telegramグループ に登録してください。Entry Points Proインジケーターのメリットは次の通りです。 再描画のないエントリーシグナル 再描画されるインジケーターでは一度表示されたシグナルが削除されて大きな金銭的損失につながることがありますが、これと異なり、表示されて確認されたシグナルは消えることがありません。 エラーなしの取引開始 インジケーターアルゴリズムによって取引を開始する(資産を売買する)理想的な瞬間を見つけることができます。それを使用するすべてのトレーダーの成功率が向上します。 あら
Advanced Supply Demand
Bernhard Schweigert
4.91 (300)
現在40%オフ 初心者にもエキスパートトレーダーにも最適なソリューション このインジケーターは独自の機能と新しい公式を多数内蔵しており、ユニークで高品質かつ手頃な取引ツールです。このアップデートでは、2つの時間枠ゾーンを表示できるようになります。より長いTFだけでなく、チャートTFとより長いTF(ネストゾーンを表示)の両方を表示できます。すべてのSupply Demandトレーダーの皆さんのお気に召すはずです。:) 重要情報の公開 Advanced Supply Demandの可能性を最大化するには、 https://www.mql5.com/ja/blogs/post/720245 にアクセスしてください。   エントリーまたはターゲットの正確なトリガーポイントを正確に特定できれば取引がどのように改善されるか想像してみてください。新しい基盤となるアルゴリズムに基づいて構築されているため、買い手と売り手の間の潜在的な不均衡をさらに簡単に特定できます。これは、最も強い需要と供給のゾーンと、過去のパフォーマンス(古いゾーンを表示)がグラフィカルに表現されるためです。これらの機能は、最適な
Introduction to Fractal Pattern Scanner Fractal Indicator refers to the technical indicator that makes use of the fractal geometry found in the financial market. Fractal Pattern Scanner is the advanced Fractal Indicator that brings the latest trading technology after the extensive research and development work in the fractal geometry in the financial market. The most important feature in Fractal Pattern Scanner is the ability to measure the turning point probability as well as the trend probabi
Market Structure Patterns   is an indicator based on   smart money concepts   that displays   SMC/ICT   elements that can take your trading decisions to the next level. Take advantage of the   alerts ,   push notifications   and   email messages   to keep informed from when an element is formed on the chart, the price crosses a level and/or enters in a box/zone. Developers can access the values of the elements of the indicator using the   global variables  what allows the automation of trading d
通貨強さウィザードは、取引を成功させるためのオールインワン ソリューションを提供する非常に強力な指標です。このインジケーターは、複数の時間枠のすべての通貨のデータを使用して、このまたはその外国為替ペアのパワーを計算します。このデータは、使いやすい通貨インデックスと通貨パワーラインの形式で表され、特定の通貨のパワーを確認するために使用できます。 必要なのは、取引したいチャートにインジケーターを接続することだけです。インジケーターは、取引する通貨の実際の強さを示します。このインジケーターは、トレンドに合わせて取引するときに有利に利用できる売買高の圧力の極値も示します。このインジケーターには、フィボナッチに基づく可能なターゲットも表示されます。 このインジケーターは、PUSH 通知を含むあらゆるタイプのアラートを提供します。 購入後ご連絡下さい。私の取引のヒントをあなたと共有し、素晴らしいボーナスインジケーターを無料で提供します! 幸せで有益な取引をお祈りします。
Auto Optimized Parabolic RSI: 高度な3Dモメンタムエンジン ほとんどのリテール向けインジケーターは、市場のボラティリティが変化した瞬間に破綻する静的な入力値に依存しているため、失敗に終わります。Auto Optimized Parabolic RSIは、自らの数学的優位性を継続的に再計算することで「インジケーターの陳腐化」問題を解決し、機関投資家レベルの定量的適応力をMT5ターミナルに直接もたらします。 最大の強み: カスタムインメモリ3D最適化   標準的な自動最適化ツールは、インジケーターの呼び出しで端末に過負荷をかけるため、頻繁にMT5プラットフォームをフリーズさせます。本ツールは、このボトルネックを完全に回避しています。RAMベースのカスタムネイティブ計算機を内蔵した内部エンジンは、チャートを読み込んだりタイムフレームを変更したりするたびに、超高速の3Dグリッド探索を実行します。RSI期間(頻度)、SARステップ(加速度)、SAR最大値(制限速度)を同時にスイープし、プラットフォームを遅延させることなく、数万通りものパラメーターの組み合わせを絶対的
CRT Candle Range Theory HTF MT4.   Ultimate CRT Indicator: Advanced ICT Concepts and Malaysian SnR Trading System Discounted   Price   $50  !!     Secure your lifetime access   now   before it switches to   subscription-only ! Master the Market Maker's Footprints with the Most Advanced Candle Range Theory Indicator Unlock the true power of   Smart Money Concepts (SMC)   and trade precisely like the institutions with the   Ultimate CRT Indicator . Built exclusively for serious traders, this indic
FX Power: 通貨の強弱を分析して、より賢い取引を実現 概要 FX Power は主要通貨と金の実際の強弱をあらゆる市場状況で理解するための必須ツールです。強い通貨を買い、弱い通貨を売ることで、 FX Power は取引の意思決定を簡素化し、高い確率の取引機会を見出します。トレンドを追従する場合でも、極端なデルタ値を使用して反転を予測する場合でも、このツールはあなたの取引スタイルに完全に適応します。ただ取引するだけではなく、 FX Power で賢く取引をしましょう。 1. なぜ FX Power がトレーダーにとって非常に有益なのか 通貨と金のリアルタイム強弱分析 • FX Power は主要通貨と金の相対的な強弱を計算し、マーケットダイナミクスに関する明確な洞察を提供します。 • どの資産がリードしているか、または後れを取っているかを監視して、取引するペアを賢く選びましょう。 マルチタイムフレームの包括的なビュー • 短期、中期、長期のタイムフレームで通貨と金の強弱を追跡し、マーケットトレンドに基づいて取引戦略を調整できます。 • スキャルピングからスイングトレード
NAM Order Blocks
NAM TECH GROUP, CORP.
3.67 (3)
MT4マルチタイムフレームオーダーブロック検出インジケーター。 特徴 -チャートコントロールパネルで完全にカスタマイズ可能で、完全な相互作用を提供します。 -必要な場所でコントロールパネルを表示および非表示にします。 -複数の時間枠でOBを検出します。 -表示するOBの数量を選択します。 -さまざまなOBユーザーインターフェイス。 -OBのさまざまなフィルター。 -OB近接アラート。 -ADRの高線と低線。 -通知サービス(画面アラート|プッシュ通知)。 概要 注文ブロックは、金融機関や銀行からの注文収集を示す市場行動です。著名な金融機関と中央銀行が外国為替市場を牽引しています。したがって、トレーダーは市場で何をしているのかを知る必要があります。市場が注文ブロックを構築するとき、それは投資決定のほとんどが行われる範囲のように動きます。 注文の構築が完了すると、市場は上向きと下向きの両方に向かって急激に動きます。注文ブロック取引戦略の重要な用語は、機関投資家が行っていることを含むことです。それらは主要な価格ドライバーであるため、機関投資家の取引を含むあらゆる戦
購入後、このインジケーターに基づいたボーナスEAを受け取るためにご連絡ください。 Self Optimizing Double MA Strategyは、パラメータ推測の必要性を排除するために設計されたプロフェッショナルグレードの取引ツールです。組み込みの自動最適化エンジンを搭載し、バックグラウンドで何千ものパラメータの組み合わせをシミュレートすることで、変化する市場状況に継続的に適応し、統計的な優位性を維持します。 静的で時代遅れの設定に依存するのではなく、インジケーターは自身のロジックを動的に更新し、現在の時間枠と取引商品にとって最も収益性の高い構成を見つけ出します。 主な機能 組み込みの自動最適化: 選択した更新頻度に基づいて、システムはFast MA、Slow MA、およびRSIの期間を定期的に再計算し、設定が常に現在の市場のリズムと一致するようにします。 MAダイバージェンスフィルター: 移動平均線が明確に乖離している(広がっている)場合にのみシグナルを検証する、トレンド強度のコア指標です。これにより、移動平均線が収束している相場や平坦なレンジ相場での誤ったエントリーを防ぎ
デイトレーダーマスターは、デイトレーダーのための完全なトレーディングシステムです。システムは2つのインジケーターで構成されています。 1つの指標は売買する矢印信号です。それはあなたが得る矢印インジケーターです。 2つ目のインジケーターを無料で提供します。 2番目のインジケーターは、これらの矢印と組み合わせて使用​​するために特別に設計されたトレンドインジケーターです。 インジケーターは繰り返さず、遅れないでください! このシステムの使用は非常に簡単です。 2色の線で表示されている現在のトレンドの方向に矢印信号をたどる必要があります。青は買いの傾向です。赤い色は売りの傾向です。青い矢印は買いシグナルです。赤い矢印は売りの合図です。トレンドラインの色と一致するように、矢印の色と信号の方向が必要です。 矢印インジケーターは、主に時間間隔M5とM15での日中取引のために作成されました。ただし、技術的には、システムは他の時間間隔で使用できます。 インジケータには、PUSHメッセージ機能を備えたポップアップアラートが装備されています。 購入後、必ず私に書いてください!私はあなたにシステムとの取引の
Candle Power Pro
Thushara Dissanayake
4.5 (8)
その   キャンドルパワープロ   は、解読するために設計された洗練された取引ツールです。     実ボリューム圧力、ティックデータの不均衡、機関投資家の注文フローのダイナミクス   測定することにより   強気相場と弱気相場の戦い   リアルタイムでこの指標は生の   ボリュームデータを実用的な洞察に 変換し、トレーダーが   スマートマネーの動き、流動性ハンティング、そして隠れた市場心理   各価格ローソク足の裏にあるものを分析することで   買い手/売り手の取引量の割合、乖離パターン、取引量に基づく確認など 、     価格行動とボリューム分析は 、トレーダーにとって非常に貴重です。       ICT、SMC、および機関投資家向け取引手法 。 従来のボリュームインジケーターとは異なり、     キャンドルパワープロ   焦点を当てる   ティックデータの粒度は 、各ローソク足の動きが基礎となる   強気/弱気の強さ   または潜在的な   マーケットメーカーの罠、反転、またはブレイクアウトの継続を 予測します。     セッションベースの戦略(ロンドン/ニューヨークのキルゾー
Cycle Sniper
Elmira Memish
4.39 (36)
Please contact us after your purchase and we will send you the complimentary indicators to complete the system Cycle Sniper is not a holy grail but when you use it in a system which is explained in the videos, you will feel the difference. If you are not willing to focus on the charts designed with Cycle Sniper and other free tools we provide, we recommend not buying this indicator. We recommend watching the videos about the indiactor and system before purchasing. Videos, settings  and descri
Route Lines Prices -は、価格の方向性を予測するために設計されたインジケーターです。シンプルなインターフェースには、価格変動と将来の方向性を計算するための複数のアルゴリズムが搭載されています。これらのアルゴリズムには、使用する時間枠に基づいたボラティリティ計算と価格平滑化が含まれています。 このインジケーターには、「 Calculating price values 」値を変更するためのパラメーターが1つだけあります。デフォルト値の1は、バランスの取れた自動計算を提供し、インジケーターを手動で設定することなく使用できます。 値を2から500まで手動で変更することで、インジケーターを独自のトレーディングシステムに合わせてカスタマイズできます。 このインジケーターは、M1からH4の時間枠での使用を推奨します。あらゆる取引銘柄で使用できます。 シグナル矢印はローソク足の終値で生成され、過去の履歴には再描画されません。 メインチャートには、重複した矢印が表示されます。 複数のアラートタイプが利用可能です。内蔵のライン軌跡カウンターは、終値に基づいて動作します。これ
ゴールドラッシュ・トレンド・アロー・シグナル ゴールドラッシュ・トレンド・アロー・シグナル 指標は、XAU/USDにおける高速・短期スキャルパー向けに最適化された、正確でリアルタイムのトレンド分析を提供します。 1分足専用に設計されたこのツールは、明確なエントリーポイントを示す方向矢印を表示し、スキャルパーが変動の激しい市場状況でも自信を持って取引できるよう支援します。 この指標は、PRIMARY(主要)とSECONDARY(補助)のアラート矢印で構成されています。PRIMARYシグナルは、トレンドの方向転換を示す白と黒の方向矢印であり、SECONDARYシグナルは、PRIMARY矢印が示す方向を確認し、潜在的なエントリーポイントを示す青と赤の矢印です。 注意:トレンド方向の変化後にPRIMARYアラート矢印が1つだけ表示される場合、複数のSECONDARY青/赤矢印が表示される点に注意が必要です。SECONDARYシグナルは、シグナル基準を満たす任意のローソク足後に表示されます。したがって、長期的なトレンド移動の場合、画面に多くのSECONDARY矢印が表示されます(添付の
CRYSTAL HEIKIN ASHI SIGNALS MT4 Professional Trend Detection Indicator with Smart Entry Signals See the Trend. Catch the Move. Trade with Confidence. The professional Heikin Ashi indicator built for traders who want clarity, precision, and EA-ready signal automation. WHAT IS CRYSTAL HEIKIN ASHI SIGNALS? Crystal Heikin Ashi Signals is a professional-grade MetaTrader 4 indicator that combines pure Heikin Ashi candle visualization with an advanced momentum-shift detection system. Designed for both
The Propfolio Master Suite is the ultimate all-in-one analytical workstation for professional traders. Combining the power of the Beat The Market Maker (BTMM) methodology, Smart Money Concepts (SND/Liquidity), and Advanced Volume Profile, this suite replaces multiple different indicators with one optimized engine. Monitor up to 14 pairs simultaneously from a single chart, instantly identify market cycles, and seamlessly map institutional footprints with the click of a button. The Command Center
チャートを構成し、周期的な価格変動を識別するテクニカル指標。 どのチャートでも動作します。 いくつかの種類の通知。 グラフ自体に追加の矢印があります。 履歴を再描画せずに、キャンドルのクローズに取り組みます。 M5以上のTFを推奨します。 パラメータの使用と設定が簡単です。 異なるパラメータを持つ 2 つのインジケーターを使用する場合、他のインジケーターなしで使用できます。 入力パラメータは2つあります 周期性と信号持続時間 これら 2 つのパラメータは、チャート構造の処理を扱います。 Cyclicity - 反転サイクルが変化する頻度を調整し、サイクルを滑らかにします。 Signal duration - 最小数では価格変動の衝動を検出し、最大数では長期的なトレンドの動きを検出します。
The indicator is built on a non-standard Zig Zag, it draws accumulations after which if the price leaves this zone and a test of this zone occurs, then a sound signal is given and an arrow appears - after the test candle closes.The indicator does not redraw its signals, it is very easy to use, there are only three settings 1- this is the zig zag parameter 2- this is the minimum price exit from the zone 3- this is the maximum price exit from the zone. The lower the parameter for Zig Zag, the more
作者のその他のプロダクト
The Mirror Chart MT5 is a overlay indicator specifically designed to project a second financial instrument directly onto the main chart window. This tool is invaluable for traders who rely on correlation analysis, as it visualizes the price movements of two different instruments in real time. Unlike traditional overlays, this indicator utilizes intelligent, dynamic centering and scaling logic. It continuously analyzes the visible price range in the current window for both symbols and calculates
FREE
The indicator synchronizes eight types of markings on several charts of one trading instrument. This indicator is convenient to use in conjunction with "Multichart Dashboard" or other similar assistant that allows you to work with several charts at the same time. "Multichart Dashboard" can be found under the link on my youtube channel. Settings: enable vertical line synchronization enable horizontal line synchronization enable Trend Line synchronization enabling Fibonacci Retracement synchron
FREE
Trade Simulator        With this toolbar you have both: a compact surface, which simultaneously shows you the most important information you need for trading.    You can use it with your real account or also in the strategytester mode. This toolbar allows you to trade in the strategytester as real as possible with every  option available from the MT4 platform.   Settings available: Magic Number - When the 'MagicNumber' number is 0, the toolbar will watch all orders without a 'MagicNumber'. If th
FREE
本インジケーターは過去の価格レンジを日次ボックスとして表示し、 各取引日の内部構造を詳細に分析できるよう設計されています。各日ごとに個別の色を設定できます。 ボックス内には始値と終値のレンジが方向別の色で描画され、蓄積ゾーンやレンジ形成を効率的に把握できます。 Version for MT5 : https://www.mql5.com/ru/market/product/161828?source=Unknown The indicator displays historical price ranges as daily boxes, enabling detailed analysis of intraday structure and market behavior. Each trading day can be assigned an individual color. Inside every box, the range between the opening and closing prices is drawn with separate directional
FREE
The Shadow Chart  indicator is the advanced evolution of the Mirror Chart MT5. Rather than overlaying the second instrument directly onto the main chart with dynamic scaling, it renders it in a dedicated sub-window with its own independent price axis. The second symbol behaves exactly like a separately opened chart window — the scale is absolute and undistorted. The sub-window automatically adapts its display mode to match the main chart — candles, bars, or line — and inherits all color settings
FREE
アダプティブADR  アダプティブADR は、平均日中レンジ(ADR)を計算・表示するためのプロフェッショナル向けインジケーターで、日々の値動きの特徴を把握したいトレーダーに最適です。柔軟な設定により、さまざまな市場環境に対応できます。 計算と手法 4種類の平滑化: SMA、EMA、SMMA(Wilder)、LWMA トレードスタイルやボラティリティモデルに合わせて選択可能 トレンド相場・レンジ相場どちらにも対応 ダイナミックデイロジック 取引開始と同時に自動起動 始値を中心に2つの対称レベルを設定 ADR到達までレベルが徐々に収束 到達後は終日固定され、日内の値動きの限界を明確化 異常なボラティリティや過伸びの判断にも役立つ 視覚ガイド 始値ラインの表示が可能 色、ラインスタイル、透明度、表示設定を自由に調整 どのチャートテーマにも自然に馴染むデザイン メリット 明確なイントラデイ構造 日々のボラティリティを正確に評価 ブレイクアウト、平均回帰、ボラティリティ戦略に最適 過剰なエントリーを避け、効率的なトレード判断をサポート
Clonify PRO - Local Trade Copier for MT5 and MT4            (  Local trade copier for MT4   https://www.mql5.com/ru/market/product/15992   ) Professional tool for copying trades between MT5 and MT4 accounts (via the shared "Common" folder). FEATURES: 1. SENDER: Exports trades in real-time Sends everything (no filters) Requires no additional settings 2. RECEIVER: Copies trades. Magic Number: Uses the sender's account ID (default) or a custom number. Lot Modes: Analogous: Exactly the same volume
Sync Master   objects synchronization 1. モード選択:    - SYNC_MASTER: 1つのチャートにのみインストールします。同じ銘柄の他の      すべてのチャートにオブジェクトをコピーします。    - SYNC_PEER: 同期したいすべてのチャートにインストールします(同じ銘柄である必要があります)。 2. 機能:    - チェックボックス: 同期するオブジェクトの種類を選択します。    - 状態 (有効/無効): インジケーターを削除せずに同期のオン/オフを切り替えます。    - 完全同期: 既存のすべてのオブジェクトを即座にコピーします。    - 全削除: ターゲットチャート上のすべての描画オブジェクトを削除します(パネルは保持されます)。
FREE
WOz
Andrej Hermann
5 (3)
Universal trading advisor "WOz" with a built-in trading panel The EA's capabilities can be easily tested in the strategy tester in visual mode. The EA can simulate real trading with the ability to move the SL and TP levels.  The EA has 5 modes of operation:  1. AUTOTRADING automatic trading mode on a set signal  2. ONLY SIGNAL mode of tracking the set signal without auto trading  3. RANGE MODUS mode of automatic placement of equidistant orders on Bayi Sell at a specified time  4. HAND MODUS
FREE
Multichart Dashboard — Your Central Command Center for Trading The **Multichart Dashboard** Expert Advisor transforms your MetaTrader interface into a clean, professional trading hub. Manage up to **6 charts simultaneously** , switch between symbols in an instant and always stay in control — all within one compact, fully configurable panel. What does Multichart Dashboard do? **Up to 6 charts in parallel** — Set the desired number of charts (1–6) with a single input. All associated charts are
FREE
Clonify PRO - Local Trade Copier for MT5 and MT4 Professional tool for copying trades between MT5 and MT4 accounts (via the shared "Common" folder). FEATURES: 1. SENDER: Exports trades in real-time Sends everything (no filters) Requires no additional settings 2. RECEIVER: Copies trades. Magic Number: Uses the sender's account ID (default) or a custom number. Lot Modes: Analogous: Exactly the same volume as the sender. The Lot Multiplier allows you to decrease or increase the transmitted lot. Pr
FREE
アダプティブADR  アダプティブADR は、平均日中レンジ(ADR)を計算・表示するためのプロフェッショナル向けインジケーターで、日々の値動きの特徴を把握したいトレーダーに最適です。柔軟な設定により、さまざまな市場環境に対応できます。 計算と手法 4種類の平滑化: SMA、EMA、SMMA(Wilder)、LWMA トレードスタイルやボラティリティモデルに合わせて選択可能 トレンド相場・レンジ相場どちらにも対応 ダイナミックデイロジック 取引開始と同時に自動起動 始値を中心に2つの対称レベルを設定 ADR到達までレベルが徐々に収束 到達後は終日固定され、日内の値動きの限界を明確化 異常なボラティリティや過伸びの判断にも役立つ 視覚ガイド 始値ラインの表示が可能 色、ラインスタイル、透明度、表示設定を自由に調整 どのチャートテーマにも自然に馴染むデザイン メリット 明確なイントラデイ構造 日々のボラティリティを正確に評価 ブレイクアウト、平均回帰、ボラティリティ戦略に最適 過剰なエントリーを避け、効率的なトレード判断をサポート
本インジケーターは過去の価格レンジを日次ボックスとして表示し、 各取引日の内部構造を詳細に分析できるよう設計されています。各日ごとに個別の色を設定できます。 ボックス内には始値と終値のレンジが方向別の色で描画され、蓄積ゾーンやレンジ形成を効率的に把握できます。 The indicator displays historical price ranges as daily boxes, enabling detailed analysis of intraday structure and market behavior. Each trading day can be assigned an individual color. Inside every box, the range between the opening and closing prices is drawn with separate directional colors, helping traders identify accumulation and consolidation zones.
フィルタ:
bajusz
14
bajusz 2024.10.18 13:34 
 

Kiváló. Ne másoljon a magasabb idősíkora, csak lefelé!

Jexzeed
14
Jexzeed 2024.04.03 00:46 
 

ユーザーは評価に対して何もコメントを残しませんでした

tradingkevin
151
tradingkevin 2024.01.16 22:25 
 

ユーザーは評価に対して何もコメントを残しませんでした

Marx-David
197
Marx-David 2023.12.26 20:12 
 

It worked as stated by the author, but it would be nice if it synchronized the chart as well.

Alexander Ivanchenko
132
Alexander Ivanchenko 2023.09.07 15:46 
 

Индикатор хороший и идея хорошая.только лагает немного но для моих нужд хватает.я рад что его вообще нашел,долго искал а уже кто-то заделал и бесплатно.

Kedrov
1241
Kedrov 2023.07.13 21:28 
 

Индикатор недоработан. Выставляя уровень на W1 и делая отметки в отображении на необходимость проецирования уровня на W1 и ниже – он выставляет уровень на ТФ ВЫШЕ - на MN1. И получается, что на D1 мы видим уровни с Н1, уровень с М15 видим на H4. Провожу трендовую линию на D1 и ограничивая её отображение на ТФ D1 и ниже – мы эту линию видим и на W1.

削除済み 2023.06.15 21:04 
 

ユーザーは評価に対して何もコメントを残しませんでした

singer2
61
singer2 2023.05.07 13:10 
 

наверное полезная штука для тестера, только позьзоваться не получается....вешает терминал

plast008
14
plast008 2023.03.13 19:33 
 

оч полезный !

Romário Costa
45
Romário Costa 2023.02.21 17:05 
 

ユーザーは評価に対して何もコメントを残しませんでした

PipsMT5
24
PipsMT5 2023.02.20 02:06 
 

Excelente

varon
531
varon 2023.01.11 17:48 
 

Thank you very much for this amazing tool!!! The BEST!!!

MIKHAIL GVOZDIKOV
143
MIKHAIL GVOZDIKOV 2022.11.25 17:05 
 

Спасибо разработчику, отличный индикатор!!!!

Mahyar Kakaee
18
Mahyar Kakaee 2022.11.08 09:36 
 

absolutely practical

dashfx1
80
dashfx1 2022.09.28 02:14 
 

It is an excellent indicator; however, my MT4 enters into an infinite loop when other indicators like volume profile continuously update horizontal levels. Would it be possible to add a property to read a prefix in the object name and only update objects with that prefix? Thanks!

mstrkrft
17
mstrkrft 2022.07.04 13:22 
 

Good tool, thanks a lot for making it free for us Andrej! Could you please make the button make a color change when on/off mode? My eyes don't see the difference between blue/blue... Thanks!

slananiki
19
slananiki 2022.06.23 22:28 
 

Working great!

13808080
18
13808080 2022.06.22 14:07 
 

Good

MohammadAli NorouziFar
24
MohammadAli NorouziFar 2022.01.29 09:13 
 

Thank You please do it for "Linear Regression Channel" and "Andrews'Pitchfork"

ali ghalebi
18
ali ghalebi 2021.12.20 13:42 
 

ユーザーは評価に対して何もコメントを残しませんでした

12
レビューに返信