Objects synchronization
- インディケータ
- バージョン: 1.31
- アップデート済み: 16 1月 2026

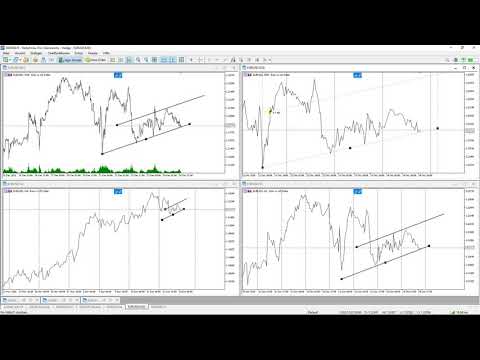
The indicator synchronizes eight types of markings on several charts of one trading instrument.
This indicator is convenient to use in conjunction with "Multichart Dashboard" or other similar assistant that allows you to work with several charts at the same time.
"Multichart Dashboard" can be found under the link on my youtube channel.
Settings:
enable vertical line synchronization
enable horizontal line synchronization
enable Trend Line synchronization
enabling Fibonacci Retracement synchronization
enable Equidistant Channel sync
enable Rectangle sync
enable Text sync
enable Arrow sync
enable display of the SynchButton


This is a very good trading tool and many thanks to Andrej Hermann for the creation and sharing it with the trading community. But please Mr. Andrej Hermann can you also kindly add the Andrews Pitchfork lines to the list of the synch objects as this is also a very good tools and if placed the HTF and can display on the LTF for trade entry execution. Please if this can be added it will be so much appreciated. Kind regards.