NexaTrend

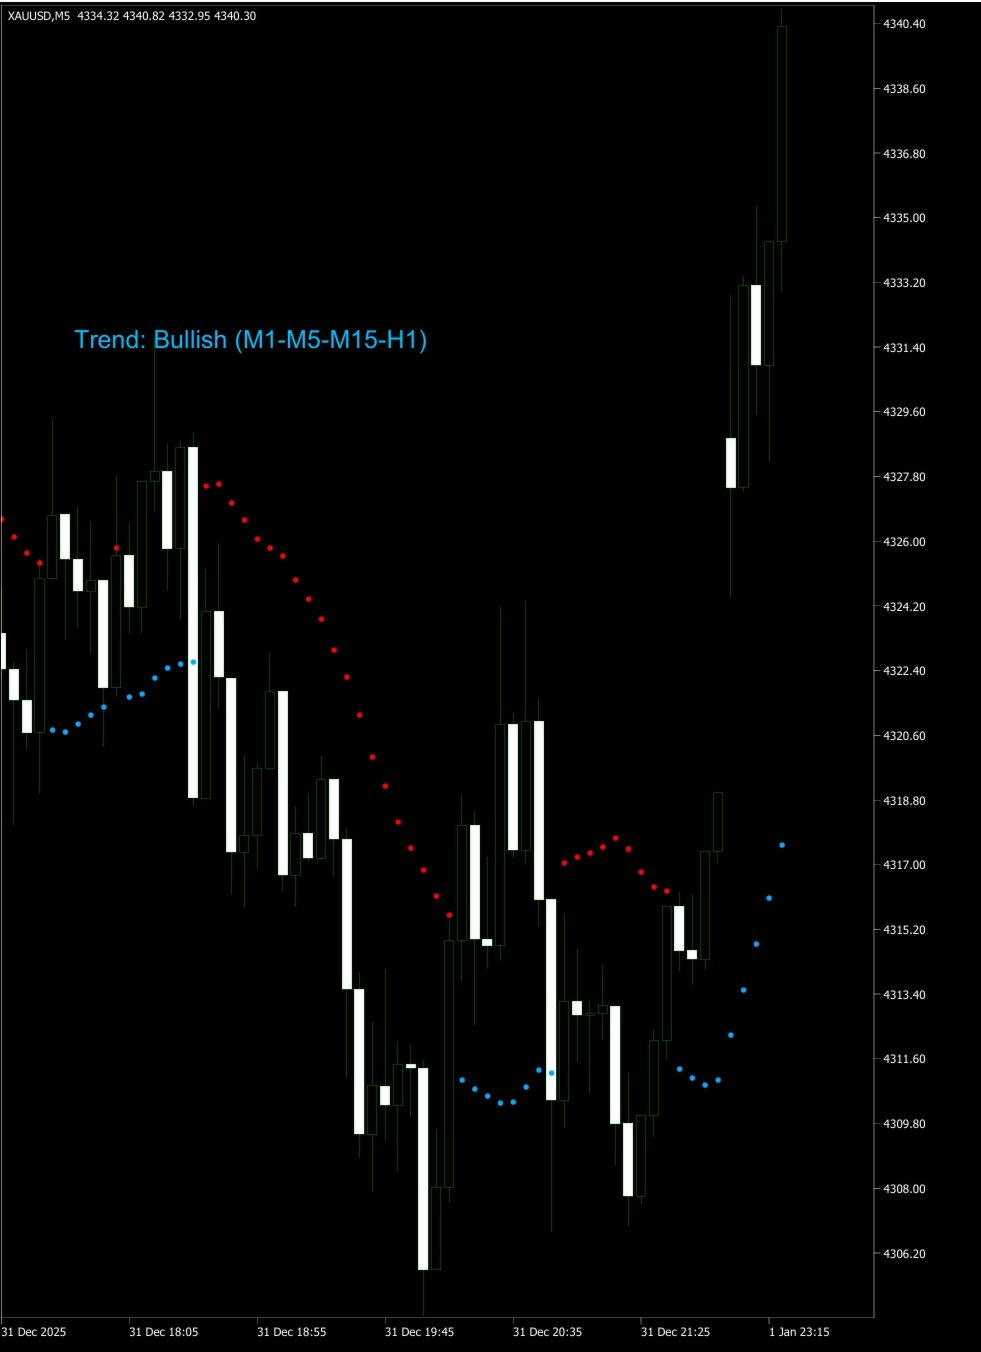
MTF MA Trend Indicator is a powerful multi-timeframe analysis tool designed to give traders a clear and unified view of market direction using Moving Averages (MA).

Instead of analyzing each timeframe separately, this indicator combines M1, M5, M15, and H1 into one consolidated trend reading, helping traders quickly understand whether the market is:

  • 📈 Bullish
  • 📉 Bearish
  • ➖ Sideways (ranging market)

✨ Key Features:

🔹 Multi-Timeframe Trend Fusion

The indicator analyzes multiple timeframes (M1, M5, M15, H1) and merges them into a single overall trend direction for better decision-making.

🔹 Sideways Market Detection

Uses dot-based logic to identify ranging or sideways conditions, helping traders avoid low-probability setups and false breakouts.

🔹 Trade Opportunity Arrows

Provides arrows on specific timeframes (e.g., M30) to highlight potential entry points when market conditions are favorable for opening a position.

🔹 MA-Based Trend Logic

All signals are generated using Moving Average structure, ensuring a clean and objective trend classification.

📊 How It Works:

  • Each timeframe is analyzed individually using MA direction
  • Results are combined into a unified trend score
  • Market state is classified as bullish, bearish, or sideways
  • Additional filters detect consolidation zones using dot markers
  • Entry arrows appear only when conditions align across logic rules

🎯 Included Components:

  • MTF Trend Engine (M1 → H1)
  • Sideways Detection Dots
  • Entry Signal Arrows (e.g., M30 opportunities)
  • MA-based trend confirmation system

💡 Additional Tool:

Along with the MTF version, a separate indicator is included that shows bullish or bearish direction based on the current timeframe only, also using Moving Averages for trend detection.

⚠️ Important Note:

This indicator is designed for analysis and decision support. Traders should always combine it with proper risk management and confirmation strategies.


おすすめのプロダクト
RBreaker Gold Indicatorsは、金先物の短期日内取引戦略であり、トレンドフォローと日内反転の2つの取引手法を組み合わせたものです。トレンド相場での利益を捉えるだけでなく、相場が反転した際には迅速に利確し、その流れに沿ってポジションを反転させることができます。 この戦略は、アメリカの雑誌『Futures Truth』において、15年連続で最も収益性の高い取引戦略トップ10に選ばれた実績を持ち、非常に長いライフサイクルを誇り、現在も国内外で広く使用・研究されています。 本インディケーターは、2026年の金先物の値動きに対応し、14日間のATR指標に基づいて、ブレイクアウト係数A、観察係数B、リバーサル係数Rをより合理的な値で定義しています。非常に優れたインディケーターであり、安定的な年間収益を実現しています。ぜひおすすめします〜
HAS RSI Signal — SL/TP自動計算機能付き プロフェッショナル・トレンドインジケーター HAS RSI Signal は、信頼性の高いクラシックな手法と最新のノイズ除去アルゴリズムを融合させた強力なトレーディングツールです。 平均足スムーズド(Heiken Ashi Smoothed) と RSI を組み合わせることで、トレンドの転換点や買われすぎ・売られすぎ圏からの脱出タイミングを正確に捉え、明確なエントリーシグナルを提示します。 主な特徴: 二重のフィルタリング: 平均足スムーズドで市場の「ノイズ」を除去し、RSIで勢い(モメンタム)の強さを確認します。 損切り・利確ラインの自動計算: 単にシグナルを出すだけでなく、ボラティリティ( ATR )に基づいた最適なストップロス(SL) と テイクプロフィット(TP)を自動で算出します。 視覚的な分かりやすさ: シグナルはチャート上にカラーキャンドルとして表示されるため、一目でトレンドを把握でき、取引画面をスッキリと保てます。 充実の通知機能: アラート、音声、スマートフォンへのプッシュ通知機能を搭載。チャンスを逃すこと
TRI Visualizer Enhanced - 熱力学的市場分析の革命 概要 TRI(Thermal Range Indicator)Visualizer Enhanced は、従来のテクニカル分析を超越した、物理学の熱力学理論を応用した革新的なマーケット分析インジケーターです。市場の価格変動を「熱力学的エネルギー」として捉え、これまで見落とされていた市場の微細な変化を高精度で検出します。 革新的な仕組み 1. デュアル計算エンジン クラシックTRIモード 基本公式: |終値-始値| + (高値-安値) ローソク足の実体とヒゲを統合した純粋なボラティリティ測定 シンプルで直感的、あらゆる市場環境で安定動作 熱力学的TRIモード(独自開発) 価格加速度 :2次微分による価格変化の勢いを測定 出来高変化率 :相対的な出来高の変化を動的に評価 ポジションエネルギー :正規化された価格変動エネルギーを計算 熱力学的係数 :物理学の熱力学法則を市場分析に応用 2. 高度な平滑化システム SMA(単純移動平均) :基本的なノイズ除去 EMA(指数移動平均) :最新データ重視の平滑化
HiLo Activator is one of the most used indicators to determine trend. Find it here with the ability to customize period and colors. This indicator also plots up and down arrows when there is a change on the trend, indicating very strong entry and exit points. HiLo fits well to different types of periods for day trading. You can easily understand when it is time to buy or sell. It works pretty good also for other periods like daily and monthly signalizing long-term trends. The use of the indicato
STRICTLY FOR BOOM INDEX ONLY!!!!! Here I bring the Maximum Trend Arrows OT1.0 MT5 indicator. This indicator is made up of a combination of different trend indicators for entries and exits, for entries an orange arrow will paint on the chart below the current market and a red flag for closing of trades and it produces buy arrows only. When the orange arrow appears, it will appear along with it's sound to notify you. The 1H timeframe is recommended, don't use it anywhere else than on the 1H timefr
Linear Regression Angle is a directional movement indicator which defines a trend at the moment of its birth, and additionally defines trend weakening. The indicator calculates the angle of the linear regression channel and displays it in a separate window in the form of histogram. The signal line is a simple average of the angle. The angle is the difference between the right and left edges of regression (in points), divided by its period. The angle value above 0 indicates an uptrend. The higher
# DRAWDOWN INDICATOR V4.0 - The Essential Tool to Master Your Trading ## Transform Your Trading with a Complete Real-Time Performance Overview In the demanding world of Forex and CFD trading, **knowing your real-time performance** isn't a luxury—it's an **absolute necessity**. The **Drawdown Indicator V4.0** is much more than a simple indicator: it's your **professional dashboard** that gives you a clear, precise, and instant view of your trading account status. --- ## Why This Indicator
TCT BB PANEL - Bollinger Bands Dashboard MASTER VOLATILITY WITH BOLLINGER BANDS The TCT BB PANEL monitors Bollinger Bands, identifying volatility squeezes and price extremes. WHAT YOUR DASHBOARD DISPLAYS Account: Balance, Equity, Profit, Drawdown Positions: Buys, Sells, Total BB: Upper, Middle, and Lower Bands Milestones: Detection, Last Touched, Next
Trend Monitor MT5
Pavel Zamoshnikov
4.5 (2)
The indicator generates early signals basing on ADX reading data combined with elements of price patterns. Works on all symbols and timeframes. The indicator does not redraw its signals. You see the same things on history and in real time. For better visual perception signals are displayed as arrows (in order not to overload the chart). Features The best results are obtained when the indicator works on two timeframes. For example: M30 – the indicator shows the main trend; M5 – the indicator gen
This indicator is used to compare the relative strength of the trade on the chart against the other several selected symbols. By comparing the price movement of each traded variety based on the same base day, several trend lines of different directions can be seen, reflecting the strong and weak relationship between the several different traded varieties, so that we can have a clearer understanding of the market trend. For example, you can apply this indicator on a EurUSD chart and compare it w
PipFinite Trend PRO MT5
Karlo Wilson Vendiola
4.84 (557)
Breakthrough Solution For Trend Trading And Filtering With All Important Features Built Inside One Tool! Trend PRO's smart algorithm detects the trend, filters out market noise and gives entry signals with exit levels. The new features with enhanced rules for statistical calculation improved the overall performance of this indicator. Important Information Revealed Maximize the potential of Trend Pro, please visit www.mql5.com/en/blogs/post/713938 The Powerful Expert Advisor Version Automatin
Naturu
Ivan Stefanov
5 (1)
「Naturu(ナチュル)」は自然の対称性をアルゴリズムとして用いる手動インジケーターです。 シンプルな戦略と隠された知恵でマーケットを制覇しましょう! インジケーターを読み込むと、上側(Top)と下側(Bottom)の2本のラインが表示されます。 ラインを一度クリックするとアクティブ化され、移動させたいローソク足をクリックするだけでその位置に移動できます。 高値ポイントと安値ポイントを設定すると、インジケーターが自動的に以下を計算します: マゼンタのゾーン:ブル(買い勢)とベア(売り勢)の関心が最も接近する、サポート/レジスタンスになりやすいエリア グレーのゾーン:次に注目されるエリア アクア色のライン:ブルの価格目標 ゴールド色のライン:ベアの価格目標 手動インジケーターは完全なコントロールと柔軟性を提供し、リアルタイムの相場状況や個人の直感に応じてラインを調整できます。 価格の動きを自ら深く分析することで、サポートやレジスタンス、チャートパターンの形成を本質的に理解できます。 人間の判断を活かすことで、自動システムが誤認しがちなノイズを除去し、誤シグナルを減らします。 また、自分
NosTraderMus LinearRegressionBands MT5 — 回帰直線チャネル + RSI とシグナル矢印 NosTraderMus LinearRegressionBands MT5 は、価格の 移動ウィンドウ 上に 回帰直線 を構築し、その当てはめ残差の 標準偏差 から 動的チャネル を形成する、MetaTrader 5 向けのプロフェッショナル指標です。統計的に定義されたこのチャネル上で RSI フィルター (期間/タイムフレームを選択可)を用い、 「極値 + 確認」 がそろったときに 売買矢印 を描画します。シグナルは 確定足 で判定するため、 リペイントを低減 します。 何をするか・どのように動くか 回帰直線 + 適応チャネル RegPeriod 本の足で 最小二乗の直線 (チャネルの中心線)を計算します。チャネルの 幅 は、当てはめ残差の標準偏差 × StdDevFactor 。したがって、市場の ボラティリティに応じて自動的に広がり/狭まる チャネルになります。 トレンドフィルター(任意) 直線の 傾き が方向性を示します。 OnlyInTrend
The   Trendlines Oscillator   helps traders identify trends and momentum based on the normalized distances between the current price and the most recently detected bullish and bearish trend lines. The indicator features bullish and bearish momentum, a signal line with crossings, and multiple smoothing options. USAGE The   Trendlines Oscillator   works by systematically: Identifying pivot highs and lows. Connecting pivots to form bullish (support) and bearish (resistance) trendlines. Measuring
Terra Infinity is a flat indicator. This improved version of the CalcFlat indicator has three additional lines that significantly increase its effectiveness. Unlike its predecessor with two static levels, Terra Infinity adds three dynamic lines above the main histogram, which are interpreted as follows: base signal line, minimum signal line, maximum signal line. These lines are formed using the additional parameter Avg, which is the average value of the histogram. Averaging produces a line cl
Inverted_Chart_EA Utility Expert Advisor Inverted_Chart_EA creates and maintains a mirror-inverted chart of any symbol and timeframe. It automatically generates a custom instrument (e.g. US30_INV ) and keeps its price history updated in real time, with bars mirrored around a chosen pivot. This utility gives traders a new way to analyze the market from a different perspective by flipping the chart upside down. Why use an inverted chart? Highlight hidden patterns – price formations that look ordin
WPRV2 指標の詳細説明 WPRV2は、ウィリアムズ・パーセントレンジ(%R)という古典的なテクニカル分析ツールをベースにした強化版です。この指標は、株式取引所やフォレックス、暗号通貨プラットフォームなどのファイナンスマーケットで利用されており、市場動向の分析や取引ポイントの把握に役立ちます。 指標の目的 WPRV2の主たる目的は、現在価格が最近の高値と安値に対してどの程度近づいているかを測定することです。これによってトレーダーは以下のような情報を獲得できます。 現在の価格は歴史的高値に近いのか? または歴史的安値に近付きつつあるのか? これらの情報から、市場の変動や既存の傾向継続性を素早く察知し、適切な判断を下すことが可能になります。 WPRV2指標の特徴 1. グラフィカル表現 WPRV2はメイン資産チャートから別枠で表示され、次の2本の線で構成されています。 メインライン( WPR ):指定された期間内の%R値の変化を表します。 追加赤ライン( Current ):現在値と一つ前のデータポイントだけを描画し、移動方向を視覚的に追跡します。 2. 横軸レベルと通知機能 ユーザー
BlueBoat – Prime Cycle is a technical indicator for MetaTrader 5 that visualizes market cycles based on the Fimathe cycle model (Marcelo Ferreira) . It identifies and displays historic and live cycle structures such as CA, C1, C2, C3, etc., helping traders understand the rhythm and timing of price movement across multiple sessions. This tool is ideal for manual analysis or as a supporting signal in discretionary strategies. Key Features Historical Cycle Analysis – Backtest and visualize as many
Improved version of the free HMA Trend indicator (for MetaTrader 4) with statistical analysis. HMA Trend is a trend indicator based on the Hull Moving Average (HMA) with two periods. HMA with a slow period identifies the trend, while HMA with a fast period determines the short-term movements and signals in the trend direction. The main differences from the free version: Ability to predict the probability of a trend reversal using analysis of history data. Plotting statistical charts for analyzi
H4 Candles And OpenLine Sessions MT5 is a professional indicator for MetaTrader 5 that visualizes your trading sessions and key 4-hour candle ranges with clear, customizable boxes and stylish opening price lines. Highlight Asia , London , and New York market sessions plus up to 6 custom H4 candle ranges — each with fully adjustable colors, line styles, thickness, opacity, and labels. The powerful OpenLine feature marks the exact opening price for each session or H4 range, helping you instantly s
Special offer : ALL TOOLS , just $35 each! New tools   will be   $30   for the   first week   or the   first 3 purchases !  Trading Tools Channel on MQL5 : Join my MQL5 channel to update the latest news from me Breakaway Fair Value Gaps (FVG) ツールは、トレーダーが価格がバランスから逸脱した領域を特定し、修正の可能性に関する詳細な洞察を提供するために設計された最先端のソリューションです。このツールは重要なシグナルを強調するだけでなく、意思決定の精度を向上させるための高度な機能も含まれています。 MT4バージョンはこちら:  Breakaway Fair Value Gaps MT4 その他の製品を見る:   すべての 製品 Breakaway FVGの主な特徴 1. Breakaway Fair Value Gapとは何ですか? 定義: Bre
The Fractals indicator displays on the chart only fractals with the specified parameters in the indicator settings. This allows you to more accurately record a trend reversal, excluding false reversals. According to the classical definition of a fractal, it is a candlestick - an extremum on the chart, which was not crossed by the price of 2 candles before and 2 candles after the appearance of a fractal candle. This indicator provides the ability to adjust the number of candles before and after t
HAshi-EはHeiken-Ashiシグナルを分析する強化された方法です。 説明 HAshi-Eは、Heiken-Ashiシグナルを分析するための強化された方法です。HAshi-Eは、Heiken-Ashiシグナルを分析するための強化された方法です。HAshi-Eは、Heiken-Ashiシグナルを分析するための強化された方法です。伝統的なローソク足チャートとは異なり、ヒーケンアシのローソク足は過去のバーの平均値を使って計算されるため、よりスムーズで解釈しやすい視覚的表現が可能です。 その主な利点は、ほとんどの人が本来の読み方をしない理由でもあります。Heiken-Ashiローソク足には平均値に関する情報が含まれており、通常、資産ローソク足の前に配置されているため、色や形に惑わされ、不適切な時間帯や遅い時間帯にエントリーやエグジットを行う人をよく見かける。 HAshi-Eは、伝統的なHeiken-Ashiインジケータの改良版です! HAshi-E(チャート版)の特徴: 同じデータを異なる角度から見る HAshi-Eは、伝統的なHeiken-Ashiローソク足だけでなく、ライ
Heiken Ashi Smoothed Strategy is a very simple but powerful system to get forex market trend direction. This indicator is actually 2 indicators in 1 pack, Heiken Ashi and Heiken Ashi Smoothed Moving Average both included. Because HA (Heiken Ashi) and HAS (Heiken Ashi Smoothed) are calculated in the same one system event with necessary buffers and loop only, so it is the FAST, OPTIMIZED and EFFICIENT HA having the combined indicator of MetaTrader 5. You can choose to display HA and HAS in the sam
DAILY OH/OL SDEV QUANT MODEL - STATISTICAL TRADING WITH PRECISION RISK MANAGEMENT TRADE WITH MATHEMATICAL CERTAINTY - KNOW YOUR EXACT STOP-LOSS AND TAKE-PROFIT BEFORE YOU ENTER This indicator analyzes 5,000+ days of price history to give you: Exact entry levels (sigma bands locked at daily open) Exact stop-loss distance (from M
Slopes are an increasingly key concept in Technical Analysis. The most basic type is to calculate them on the prices, but also on technical indicators such as moving averages and the RSI. In technical analysis, you generally use the RSI to detect imminent reversal moves within a range. In the case of the Blue indicator, we are calculating the slope of the market price and then calculating the RSI of that slope in order to detect instances of reversal. The Blue indicator is therefore used as
CasperIT Trend Reversal Signals Light Overview CasperIT Trend Reversal Signals Light is an enhanced version of the popular Trend Reversal Signals indicator, designed for traders who want more control, better customization, and advanced notifications while keeping the indicator simple and easy to use. 100% NO REPAINT! The indicator automatically identifies potential trend reversals and trend continuation opportunities by classifying market conditions into three clear signal categories: Reversal S
Divergent Stochastic Filter II Catch Reversals Early, Filter Noise, Trade with Confidence The Edge: Why This Stochastic is Different  Every trader knows the Stochastic oscillator. But knowing when to trust its signals, that's the real challenge. The Divergent Stochastic Filter II transforms this classic indicator into a precision reversal detection system by adding critical elements: divergence intelligence, signal filtering and exhaustion detection.  While standard Stochastic oscillators fire s
The indicator detects divergence signals - the divergences between the price peaks and the MACD oscillator values. The signals are displayed as arrows in the additional window and are maintained by the messages in a pop-up window, e-mails and push-notifications. The conditions which formed the signal are displayed by lines on the chart and in the indicator window. The indicator parameters MacdFast - fast MACD line period MacdSlow - slow MACD line period MacdSignal - MACD signal line period Macd
Price reach indicator. It also serves as the perfect term for supports and resistance. I use it in two experts. The basic tool for professional trading. The indicator analyzes the last 500 bar and uses this to determine the levels ( but it doesn't predict the future ) . Personally, I use it on TF H1.  It is very simple. Four lines on chart and that's all. Only two input parameters.  Thousands of indicators. Why this? Is good ? No! Is very good. Please test the indicator prior to purchasing. You
このプロダクトを購入した人は以下も購入しています
Neuro Poseidon is a new indicator by Daria Rezueva. It combines precise trading signals with adaptive TP/SL levels - creating best possible trades as a result! Message me and get  Neuro Poseidon Assistant  as a gift to automize your trading process! What makes it stand out? 1. Proven profitability on all assets and timeframes 2. Only confirmed BUY and SELL signals present on the chart 3. Adaptive TP & SL levels generated by the software for each trade 4. Easy to understand - suitable for al
SuperScalp Pro
Van Minh Nguyen
4.68 (28)
SuperScalp Pro – プロフェッショナル多層コンフルエンス・スキャルピングシステム SuperScalp Proは、インテリジェントなマルチファクター確認システムを通じて高確率の取引機会を特定するために設計された、プロフェッショナルなマルチレイヤー・コンフルエンストレーディングシステムです。Supertrend、VWAP、EMA、RSI、ADX、出来高分析、ボリンジャーバンド、およびMACDダイバージェンスを統合することで、低品質なセットアップを排除し、ダマシのブレイクアウトシグナルを減らし、エントリー精度を向上させます。 XAUUSD、BTCUSD、および主要なForex通貨ペア向けに特別に最適化されたSuperScalp Proは、ATRベースのボラティリティロジックとルールベースのシグナル検証を通じて市場環境の変化に適応し、M1からH4までの複数時間足で一貫性と客観性のある取引確認を提供します。 内蔵されたスマートコントロールパネルにより、リアルタイムで完全なカスタマイズが可能です。トレーダーは個別の確認フィルターを有効または無効にし、市場環境、取引スタイル、リスク許
まず正直に言いましょう。 どんなインジケーターも、それ単体であなたを利益化させることはできません。もしそう言う人がいるなら、それは夢を売っているだけです。完璧な売買シグナル(矢印)を表示するインジケーターは、いくらでも“完璧に見せる”ことができます。正しい過去の区間を拡大して、勝ちトレードだけを切り取ればいいだけです。私たちはそれをしません。 SMC Intraday Formula はツールです。 市場構造を読み取り、最も高い確率の価格ゾーンを特定し、今この瞬間のスマートマネーの痕跡をシンプルな言葉で正確に示します。最終判断はあなたが行います。トレードを実行するのもあなたです。しかし今は「希望」ではなく「精度」でエントリーできます。 私たちはこのインジケーターを、ゴールド(XAUUSD)および主要FX通貨ペアで約3年間、日々のスキャルピングに使用してきました。M1、M5、M15、M30の主要ツールです。これは未来を予測しようとするのではなく、今まさに形成されている高確率セットアップを示し、その理由を説明します。 他のすべてのインジケーターと何が違うのか? ほとんどのトレーディングイ
このインジケーターを購入された方には、以下の特典を 無料 で提供しています: 各トレードを自動で管理し、ストップロスとテイクプロフィットを設定し、戦略ルールに基づいてポジションを決済する補助ツール 「Bomber Utility」 様々な銘柄に合わせたインジケーターの設定ファイル(セットファイル) 「最小リスク」、「バランスリスク」、「待機戦略」 の3つのモードで使用できる Bomber Utility 用の設定ファイル このトレーディング戦略をすぐに導入・設定・開始できる ステップバイステップのビデオマニュアル ご注意: 上記の特典を受け取るには、MQL5のプライベートメッセージシステムを通じて販売者にご連絡ください。 オリジナルのカスタムインジケーター 「Divergence Bomber(ダイバージェンス・ボンバー)」 をご紹介します。これは、MACDのダイバージェンス(乖離)戦略に基づいた 「オールインワン」型のトレーディングシステム です。 このテクニカルインジケーターの主な目的は、価格とMACDインジケーターの間に発生するダイバージェンスを検出 し、将来の価格の動きを示す
Entry In The Zone and SMC Multi Timeframe is a real-time 2-in-1 market analysis tool that combines market structure analysis and a No Repaint BUY / SELL signal system into a single indicator, built on Smart Money Concepts (SMC) — a widely adopted framework used by professional traders to understand market structure. This indicator helps you see the market more clearly, make decisions based on structure rather than guesswork, and focus on high-probability zones where price is more likely to react
Gann Made Easy   は、ミスター・ギャンの理論を使用した取引の最良の原則に基づいた、プロフェッショナルで使いやすい外国為替取引システムです。 W・D・ガン。このインジケーターは、ストップロスとテイクプロフィットレベルを含む正確な買いと売りのシグナルを提供します。 PUSH通知を利用して外出先でも取引可能です。 ご購入後、取引方法の説明と優れた追加インジケーターを無料で入手するには、私にご連絡ください! おそらく、ギャンの取引手法についてはすでに何度も聞いたことがあるでしょう。通常、ギャンの理論は初心者のトレーダーだけでなく、すでにある程度の取引経験がある人にとっても非常に複雑なものです。なぜなら、ギャンの取引手法は理論的にはそれほど簡単に適用できるものではないからです。私はその知識を磨き、最良の原則を私の外国為替インジケーターに組み込むために数年を費やしました。 このインジケーターは非常に簡単に適用できます。必要なのは、それをチャートに添付し、簡単な取引推奨事項に従うだけです。このインジケーターは常に市場分析の仕事を行い、取引の機会を探します。適切なエントリーポイントを検
PrimeScalping is a powerful trading companion designed to generate high-probability entry signals with dynamic TP/SL/DP levels based on volatility. Built-in performance tracking shows win/loss stats, PP1/PP2 hits, and success rates — all updated live. Key Features: Buy/Sell signals with adaptive volatility bands Real-time TP/SL/DP levels based on ATR Built-in MA Filter with optional ATR/StdDev volatility Performance stats panel (Success, Profit/Loss, PP1/PP2) Alerts via popup, sound, push, or e
この製品は 2026 年の市場向けに更新され、最新の MT5 ビルドに最適化されています。 価格更新のお知らせ: Smart Trend Trading System は現在 $99 で提供されています。 次の 30 件の購入 後、価格は $199 に上がります。 特別オファー: Smart Trend Trading System を購入後、私にプライベートメッセージを送ることで、 Smart Universal EA を無料 で受け取り、Smart Trend のシグナルを自動売買に変えることができます。 Smart Trend Trading System は、リペイントなし、再描画なし、遅延なしの完全なトレーディングシステムです。よりクリーンなシグナル、より明確なトレンド方向、そしてより整理された取引方法を求めるトレーダー向けに作られています。 Online course , manual and [download presets] . このシステムは、トレンド検出、反転ゾーン、Smart Cloud、トレーリングストップロジック、サポートとレジスタンス、ローソク足の色分け
この製品は 2026 年の市場向けに更新され、最新の MT5 ビルドに最適化されています。 価格更新のお知らせ: Atomic Analyst は現在 $99 で提供されています。 次の 30 件の購入 後、価格は $199 に上がります。 特別オファー: Atomic Analyst を購入後、私にプライベートメッセージを送ることで、 Smart Universal EA を無料 で受け取り、Atomic Analyst のシグナルを自動売買に変えることができます。 Atomic Analyst は、リペイントなし、再描画なし、遅延なしの Price Action トレーディングインジケーターで、手動取引、シグナルの明確化、EA 自動化のために設計されています。 User manual: settings, inputs and strategy.   &   User Manual PDF . 価格行動、強さ、モメンタム、マルチタイムフレーム方向、高度なフィルターを分析し、トレーダーがノイズを減らし、弱いセットアップを避け、より構造化された取引判断を行えるようにします。 このイ
ご紹介     Quantum Breakout PRO は 、ブレイクアウト ゾーンの取引方法を変革する画期的な MQL5 インジケーターです。 13年以上の取引経験を持つ経験豊富なトレーダーのチームによって開発されました。     クォンタム ブレイクアウト プロ   は、革新的でダイナミックなブレイクアウト ゾーン戦略により、あなたのトレーディングの旅を新たな高みに押し上げるように設計されています。 クォンタム ブレイクアウト インジケーターは、5 つの利益ターゲット ゾーンを備えたブレイクアウト ゾーン上のシグナル矢印と、ブレイクアウト ボックスに基づいたストップロスの提案を提供します。 初心者トレーダーにもプロのトレーダーにも適しています。 量子EAチャネル:       ここをクリック 重要!購入後、インストールマニュアルを受け取るためにプライベートメッセージを送ってください。 推奨事項: 時間枠: M15 通貨ペア: GBPJPY、EURJPY、USDJPY、NZDUSD、XAUUSD アカウントの種類: ECN、Raw、またはスプレッドが非常に低い R
開発者からのお知らせ: 149ドル で購入できるライセンスは残り  8 つ です。売り切れ後、価格は 169ドル に変更されます。 M1 Quantum は、M1専用のプロフェッショナルトレーディングシステムであり、ストップロス、テイクプロフィット、スマートな資金管理を内蔵した、迅速かつ正確な取引シグナルを提供します。 M1 Quantum は、 連続勝利 に重点を置いて口座を素早く成長させるために設計されたプロフェッショナルな資金管理を備えています。 M1 Quantum インジケーター の主な特徴 M1時間足 およびすべての 主要通貨ペア 向けに設計 すべての取引にストップロスとテイクプロフィットを設定 資金管理 を実装し、トレーダーが簡単に取引できるようサポート 高い勝率と高い 連続勝利 リペイントなし、遅延なし あらゆるトレーダーにとって理解しやすい M1 Quantum を使用するには、 M1 Quantum Assistant が必要です。この強力なツールは、M1 Quantum をご購入いただいたすべてのお客様に 無料 で提供されています。 M1 Quantum Ass
Power Candles V3 - 自己最適化型強弱インジケーター Power Candles V3は 、通貨や銘柄の強さを、適用されたすべてのチャート上で実行可能なトレードプランに変換します。単にローソク足を色分けするだけでなく、バックグラウンドでリアルタイムの自動最適化を実行し、目の前の銘柄に対して最適なストップロス、テイクプロフィット、およびシグナルの閾値を提示します。ワンクリックで実取引に適用でき、エントリーポイント、ストップロス、テイクプロフィットのラインが正確な価格位置にチャート上に表示され、方向性を示すアラートがリアルタイムで発動します。 このツールは、Stein Investmentsのエコシステムの一部です。  18種類以上のツールをすべて閲覧し、AIを活用したセットアップの推奨事項を入手し、  https://stein.investments でコミュニティに参加しましょう クローズしたバーごとに3,000回以上のトレードシミュレーション。9つの強さの状態。2つの戦略を並行してテスト。勝率の高い設定をワンクリックで適用。 なぜこれが必要なのか ほとんどの強
トレンドキャッチャーインジケーター トレンドキャッチャーインジケーターは、開発者独自の適応型トレンド分析指標を組み合わせることで、市場価格の動きを分析します。短期的なノイズを除去し、根底にあるモメンタムの強さ、ボラティリティの拡大、価格構造の挙動に焦点を当てることで、真の市場方向性を特定します。また、移動平均線、RSI、ボラティリティフィルターなどの平滑化およびトレンドフィルタリング機能を備えたカスタマイズ指標も使用します。 実際の運用状況のモニタリングやその他の製品については、こちらをご覧ください: https://www.mql5.com/en/users/mechanic/seller ご注意ください。私はTelegramでEAや設定を販売していません。詐欺です。すべての設定はブログで無料で公開しています。 重要!ご購入後すぐにご連絡ください。手順とボーナスをお送りします!
The Oracle Pro:MT5向け合成マルチタイムフレーム・バイアスエンジン ️ サマー・ローンチ・オファー — The Oracle Pro を 199 USD で(早期購入者向け)。価格は普及に応じて上昇します。最終価格 399 USD。 The Oracle Pro は、要求の高いプロのトレーダーのために作られた MetaTrader 5 向けのプレミアム・マルチタイムフレーム バイアスエンジン です。ひとつの問いに規律をもって答えます。すなわち、各タイムフレームの現在の方向バイアスは何か、その強さはどれほどか、そしてタイムフレーム同士はどれだけ一致しているか。すべては確定足のみで計算され、リペイントはありません。 The Oracle Pro はマルチファクター・コンセンサス・システムです。独自のインジケーターと最適化されたアルゴリズムを単一の高度なコンセンサス・ベクトルに統合し、それを単一のインジケーター・インスタンス内で現在足と上位足のスタックにわたって読み取ります。複数のチャートにばらばらのツールを積み重ねる代わりに、です。 これは Oracle コンセンサス手法
Quantum TrendPulse を ご紹介します。これは、   SuperTrend   、   RSI   、および Stochastic のパワーを 1 つの包括的なインジケーターに組み合わせて、取引の可能性を最大限に引き出す究極の取引ツールです。精度と効率を求めるトレーダー向けに設計されたこのインジケーターは、市場のトレンド、勢いの変化、最適なエントリー ポイントとエグジット ポイントを自信を持って特定するのに役立ちます。 主な特徴: SuperTrend 統合: 現在の市場動向に簡単に追従し、収益性の波に乗ることができます。 RSI精度: 買われすぎと売られすぎのレベルを検出し、市場の反転のタイミングに最適で、SuperTrendのフィルターとして使用されます。 確率的精度: 確率的振動を活用して、変動の激しい市場で隠れたチャンスを見つけます。SuperTrend のフィルターとして使用されます。 マルチタイムフレーム分析:   M5 から H1 または H4 まで、さまざまなタイムフレームで市場を常に把握します。 カスタマイズ可能なアラート: カスタム取引条件が満たされ
Crystal Heikin Ashi Signals - Professional Trend & Signal Detection Indicator Advanced Heikin Ashi Visualization with Intelligent Signal System for Manual & Automated Trading Final Price: $149 ---------> Price goes up $10 after every 10 sales . Limited slots available — act fast . Overview Crystal Heikin Ashi Signals is a professional-grade MetaTrader 5 indicator that combines pure Heikin Ashi candle visualization with an advanced momentum-shift detection system. Designed for both manual traders
この製品は 2026 年の市場向けに更新され、最新の MT5 ビルドに最適化されています。 価格更新のお知らせ: Smart Price Action Concepts は現在 $200 で提供されています。 次の 30 件の購入 後、価格は $299 に上がります。 特別オファー: 購入後、私にプライベートメッセージを送ることで、 無料ボーナス + ギフト を受け取ることができます。 まず、このトレーディングツールはリペイントなし、再描画なし、遅延なしのインジケーターであり、プロフェッショナルな取引に最適であることを強調しておきます。 Online course , and manual Smart Price Action Concepts Indicator は、初心者から経験豊富なトレーダーまで使える非常に強力なツールです。20 種類以上の便利なインジケーターを 1 つにまとめ、Inner Circle Trader Analysis や Smart Money Concepts Trading Strategies などの高度な取引アイデアを組み合わせています。このインジケ
GoldenX Entryは、MT5向けのインジケーターであり、適応型Smart Entry Trendアルゴリズム、シグナルスコアリングシステム、マーケットレジーム検出機能、およびボラティリティフィルターを備えています。各シグナルには、計算されたエントリーレベル、3つのテイクプロフィット(TP1、TP2、TP3)、およびストップロスレベルが含まれます。本インジケーターは、異なる市場環境に適応するために設計された複数の分析レイヤー上に構築されており、マルチレイヤー分析システムと内蔵オプティマイザーおよび統計トラッキングシステムを組み合わせています。リスク・リワード(RR)指標および過去のトレード履歴に基づく定量分析を提供します。 使い始めは簡単です — 選択した時間足でオプティマイザーを実行し、そのままチャート上でインジケーターを使用します。 コア機能 GoldenX Entryは、シグナルエンジンとトレード管理機能、そして過去統計トラッキングを1つのチャートに統合しています: - 内蔵オプティマイザー: オプティマイザーはチャート上でワンクリックで実行できます。200通りのパラメー
ARIPoint
Temirlan Kdyrkhan
1 (1)
ARIPoint is a powerful trading companion designed to generate high-probability entry signals with dynamic TP/SL/DP levels based on volatility. Built-in performance tracking shows win/loss stats, PP1/PP2 hits, and success rates all updated live. Key Features: Buy/Sell signals with adaptive volatility bands Real-time TP/SL/DP levels based on ATR Built-in MA Filter with optional ATR/StdDev volatility Performance stats panel (Success, Profit/Loss, PP1/PP2) Alerts via popup, sound, push, or email Cu
Trend Sniper X
Sarvarbek Abduvoxobov
5 (1)
Trend Sniper X — 概要 Trend Sniper X は、HTF SuperTrendエンジンとEMAフィルターを組み合わせた、MetaTrader 5用のマルチタイムフレーム・トレンド追従型インジケーターです。上位タイムフレームのトレンド方向に応じて現在のタイムフレームのローソク足の色を変更し、トレンドの転換点をBUY/SELL矢印でマークします。 価格情報: 現在の価格はプロモーション価格であり、今後のアップデートや新機能のリリースに伴い変更される場合があります。 Code2Profitチャンネル   マルチタイムフレーム分析で市場をマスターしよう!   技術仕様 プラットフォーム MetaTrader 5 インジケータータイプ マルチタイムフレーム・トレンドキャンドル(SuperTrendベース) シグナルソース HTF SuperTrend (ATRベース) + HTF EMAフィルター 動作タイムフレーム 任意のチャートタイムフレーム。独立して選択可能な上位タイムフレーム(M1〜MN1)に対応 主要銘柄 FX、ゴールド(XAUUSD)およびその他のCFD商品
Valtor Edge Pro – Precision Gold Signal Indicator with 3-Level Take-Profit, Session Filter & Live Stats Dashboard Valtor Edge Pro   is a   non-repaint   MetaTrader 5 indicator built exclusively for   XAUUSD (Gold) . It marks high-probability buy/sell signals directly on your chart — each one with a defined stop-loss and a complete three-level take-profit map (TP1 / TP2 / TP3). Designed for disciplined traders, it pairs a clean trend-following signal engine with a professional sidebar dashboard,
ScalpPoint is a powerful trading companion designed to generate high-probability entry signals with dynamic TP/SL/DP levels based on volatility. Built-in performance tracking shows win/loss stats, PP1/PP2 hits, and success rates — all updated live. Key Features: Buy/Sell signals with adaptive volatility bands Real-time TP/SL/DP levels based on ATR Built-in MA Filter with optional ATR/StdDev volatility Performance stats panel (Success, Profit/Loss, PP1/PP2) Alerts via popup, sound, push, or emai
FX Trend NG:次世代マルチマーケット・トレンドインテリジェンス 概要 FX Trend NG は、複数の時間足に対応したプロフェッショナル向けトレンド分析およびマーケット監視ツールです。 市場全体の構造を数秒で把握することができます。 複数のチャートを切り替える必要はありません。どの銘柄がトレンド中なのか、どこでモメンタムが弱まっているのか、そしてどの時間足で強い整合性があるのかを瞬時に確認できます。 ローンチ特別オファー – FX Trend NG を $30(6ヶ月) または $80 永久ライセンス でご利用いただけます。 すでに Stein Investments のユーザーですか? -> メッセージを送信 して、プライベートグループへアクセスしてください。 セットアップや詳細情報が必要ですか? -> Stein Investments 公式ページ をご覧ください。 1. FX Trend NG が他と異なる理由 3ステート・トレンドロジック ― Buy と Sell だけではない • 多くのインジケーターは Buy または Sell の2状態のみを表示します。
トレーダーの皆さん、こんにちは! 多くの個人トレーダーは、動作の遅いウェブスクリプトに頼っています。真の収益性を実現するには、体系化されたフレームワークが必要です。 Astro AIインジケーターは、一般的なチャートオーバーレイではありません。これは、ターミナル上で直接動作する2つのエージェントを含む、コンパイル済みのニューラルネットワークです。 システムの具体的な技術は以下のとおりです。 1. エージェント1:アナリスト(グラフィカルニューラルネットワーク - GNN) 市場は孤立した価格バーではなく、相互に連結されたデータネットワークです。 機能:エージェント1は、グラフィカルニューラルネットワークを使用して、これらの複雑で非線形な関係をマッピングします。 利点:一般的なインジケーターは過去の移動平均しか考慮しませんが、当社のGNNは市場の深い構造的関係をリアルタイムで処理し、個人トレーダーの取引量が大きな影響を与える前に、隠れた相関関係を明らかにします。 2. エージェント2:エグゼキューター(近接戦略最適化 - PPO) パターン認識は、戦いの半分に過ぎませ
優れたテクニカルインジケーター「Grabber」をご紹介します。これは、すぐに使える「オールインワン」トレーディング戦略として機能します。 ひとつのコードに、市場のテクニカル分析ツール、取引シグナル(矢印)、アラート機能、プッシュ通知が強力に統合されています。 このインジケーターを購入された方には、以下の特典を無料で提供します: Grabberユーティリティ:オープンポジションを自動で管理するツール ステップバイステップのビデオマニュアル:インジケーターのインストール、設定、取引方法を解説 カスタムセットファイル:インジケーターをすばやく自動設定し、最大限の成果を出すための設定ファイル 他の戦略はもう忘れてください!Grabberだけが、あなたを新たなトレードの高みへと導いてくれるのです。 Grabber戦略の主な特徴: 推奨タイムフレーム:M5〜H4 対応通貨ペア・資産:どれでも使用可能ですが、私が実際に検証した以下を推奨します(GBPUSD、GBPCAD、GBPCHF、AUDCAD、AUDUSD、AUDSGD、AUDCHF、NZDUSD、NZDCAD、EURCAD、EURUSD、E
Azimuth Pro
Ottaviano De Cicco
5 (7)
Azimuth Pro V2:MT5向けシンセティック・フラクタル構造分析と確認済みエントリー 概要 Azimuth Pro は Merkava Labs によるマルチレベルスイング構造インジケーターです。4つのネストされたスイングレイヤー、スイングアンカーVWAP、ABCパターン検出、3タイムフレーム構造フィルタリング、そして確定バーでの確認済みエントリー — 1つのチャートで、ミクロスイングからマクロサイクルまでを網羅するワークフロー。 これはブラインドシグナル製品ではありません。ロケーション、コンテキスト、タイミングを重視するトレーダーのための構造ファーストワークフローです。 ️ サマーセール — 夏至とThe Oracle Proの発売を記念して、Azimuth Proが30%オフ。現在279 USD(通常399 USD)。期間限定の夏季オファー。 1. V2での変更点 シンセティック・マルチタイムフレームエンジン 上位タイムフレーム分析をMeridian Proと同じ独自のシンセティックアーキテクチャで一から再構築。よりクリーンなHTFコンテキスト、安定したライブ動作、
SmartScalping is a powerful trading companion designed to generate high-probability entry signals with dynamic TP/SL/DP levels based on volatility. Built-in performance tracking shows win/loss stats, PP1/PP2 hits, and success rates — all updated live. Key Features: Buy/Sell signals with adaptive volatility bands Real-time TP/SL/DP levels based on ATR Built-in MA Filter with optional ATR/StdDev volatility Performance stats panel (Success, Profit/Loss, PP1/PP2) Alerts via popup, sound, push, or e
Murrey Math Classic
Sarvarbek Abduvoxobov
5 (3)
Murrey Math Classic Murrey Math Classic は、数理的な精度で金融市場の価格変動を予測するために設計された、プロフェッショナルでダイナミックな取引インジケーターです。このシステムは、伝説的な価格と時間の幾何学を現代化し、現代の金融市場に適した高度に構造化された数理モデルへと進化させました。 マレーマスの根底にある論理は、金融市場はランダムに動くのではなく、特定の特定のリズムに従って動くという点にあります。音楽が1オクターブの8つの音符に分かれているのと同じように、特定の価格幅は8つの等しい数理的レベル(0/8から8/8まで)に分割されます。これらのラインは、隠された非常に信頼性の高いサポートおよびレジスタンスゾーンとして機能し、価格がそこに到達する前に潜在的な転換点を明らかにします。 Code2Profit チャンネル インジケーターの仕組み | 完全なストラテジー概要 Murrey Math Classic:理論からチャートの精度まで なぜ Murrey Math Classic が従来のインジケーターよりも優れているのか インジケータ
FX Power: 通貨の強弱を分析して、より賢い取引を実現 概要 FX Power は主要通貨と金の実際の強弱をあらゆる市場状況で理解するための必須ツールです。強い通貨を買い、弱い通貨を売ることで、 FX Power は取引の意思決定を簡素化し、高い確率の取引機会を見出します。トレンドを追従する場合でも、極端なデルタ値を使用して反転を予測する場合でも、このツールはあなたの取引スタイルに完全に適応します。ただ取引するだけではなく、 FX Power で賢く取引をしましょう。 1. なぜ FX Power がトレーダーにとって非常に有益なのか 通貨と金のリアルタイム強弱分析 • FX Power は主要通貨と金の相対的な強弱を計算し、マーケットダイナミクスに関する明確な洞察を提供します。 • どの資産がリードしているか、または後れを取っているかを監視して、取引するペアを賢く選びましょう。 マルチタイムフレームの包括的なビュー • 短期、中期、長期のタイムフレームで通貨と金の強弱を追跡し、マーケットトレンドに基づいて取引戦略を調整できます。 • スキャルピングからスイングトレード
Meridian Pro
Ottaviano De Cicco
5 (2)
Meridian Pro 2.00:MT5向けプロ仕様マルチタイムフレーム・トレンドマトリクス Meridian Pro 2.00 は、MetaTrader 5 向けのプロ仕様の適応型トレンドマトリクスです。オリジナルの Meridian トレンドエンジン、クリーンなチャート ribbon、確定足ベースのシグナル矢印、8時間足 dashboard、Fuel momentum、weighted consensus、synthetic HTF processing、そしてチャート上に直接表示される上位足コンテキストラインを統合します。 目的はシンプルです。現在のトレンド、マルチタイムフレーム構造、強度、momentum、EA-ready 状態を、複数チャートに無関係なインジケータを重ねるのではなく、1つの整理された workflow で読むことです。 ️ サマーセール — 夏至とThe Oracle Proの発売を記念して、Meridian Proが現在99 USD(通常149 USD)。期間限定の夏季オファー。 Meridian Pro の違い 1つの適応型エンジン - 同じ vola
作者のその他のプロダクト
Heiken Pulse Pro
Sami Eid Fahid Almashaqbeh
Heiken Pulse Pro — Professional Trend Intelligence for MT5 Heiken Pulse Pro is an advanced Heiken-Ashi based Moving Average indicator designed for traders who demand smoother trend analysis, cleaner market structure, and smarter momentum visualization inside MetaTrader 5 . By combining the power of Moving Averages with transformed Heiken-Ashi price calculations, the indicator helps reduce market noise and reveal the true directional pulse of the market with exceptional clarity. Built for both m
LumiTrend Edge
Sami Eid Fahid Almashaqbeh
LumiTrend Edge is a precision-engineered trend-following indicator built for traders who demand clarity, speed, and visual confidence in fast-moving markets. Unlike traditional moving averages that lag or clutter the chart, LumiTrend Edge delivers a smooth, adaptive trend line that reacts intelligently to price momentum while filtering out market noise. At its core, the indicator combines advanced smoothing algorithms with dynamic slope detection to highlight real trend shifts — not random fluct
Liquidity Compass Pro is an advanced Smart Money and ICT-style market analysis tool designed to identify and map high-probability liquidity objectives across the chart. Instead of focusing solely on current price action, the indicator highlights the key liquidity pools that may attract future price movement, helping traders anticipate potential market direction and target areas. The indicator automatically scans the market and displays significant liquidity targets, providing a clear visual roa
Apex Quantum AI
Sami Eid Fahid Almashaqbeh
Apex Quantum AI – High-Frequency Multi-Strategy Trading System The Next Generation of Intelligent MT5 Trading Apex Quantum AI is an advanced AI-driven trading system built for traders who demand speed, adaptability, precision, and professional-grade automation . Engineered with a sophisticated blend of: Price Action Analysis Volatility Intelligence Momentum Detection Real-Time News Protection Adaptive Market Logic …Apex Quantum AI continuously analyzes market conditions and autom
SMC Alpha Signals
Sami Eid Fahid Almashaqbeh
SMC Alpha Signals   is a professional-grade Smart Money Concepts (SMC) indicator designed to bring institutional trading logic directly to your MetaTrader 5 chart with precision and clarity. Built for traders who rely on price action and liquidity behavior, this indicator integrates the core pillars of Smart Money methodology into a single, optimized tool. It delivers real-time detection and visualization of market structure shifts, liquidity zones, and high-probability entry signals—without clu
Are you looking for more than just a standard ZigZag? WavePulse Structure Pro is an advanced, institutional-grade market structure indicator designed for Smart Money Concepts (SMC), Price Action, and Swing traders. As demonstrated in the chart MetaTrader 52.png , this tool automatically maps out market swings, calculates exact wave distances, and projects key historical levels. It goes beyond basic charting by identifying critical structural shifts ( BoS / ChoCH ) and managing liquid levels in r
QualiTrend ZigZag Pro is an indicator designed as an extension of the classic Donchian Channel concept. It focuses on visualizing market structure through channel behavior combined with a zigzag-based pivot framework. The indicator detects potential pivots when the channel enters a flat or low-momentum state. These conditions are used to construct structural swing points that define market direction over time. A depth parameter is applied to filter minor fluctuations and confirm that a valid st
Apex Institutional Reversal is an advanced Smart Money Concepts (SMC) and ICT trading framework designed to identify high-probability market reversals, continuation phases, and institutional exhaustion zones before they become obvious to retail traders. This is not another lagging oscillator or generic overbought/oversold tool. Apex Institutional Reversal acts as a market regime intelligence system that combines statistical trend analysis, fractal market behavior, and institutional momentum dia
フィルタ:
レビューなし
レビューに返信