ACB Breakout Arrows MT5
- インディケータ
- バージョン: 5.5
- アップデート済み: 10 3月 2022
- アクティベーション: 10

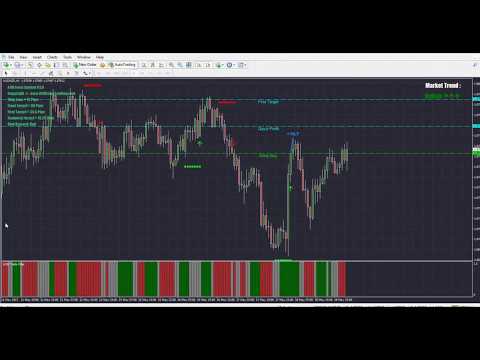
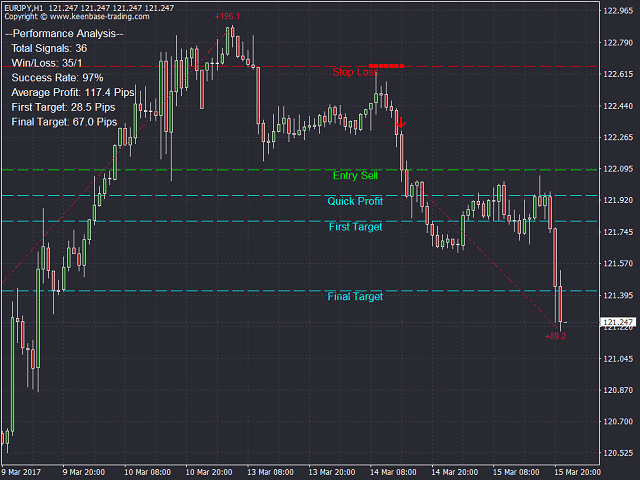
ACB Breakout Arrows インジケーターは、特別なブレイクアウトパターンを検出することで、市場における重要なエントリーシグナルを提供します。このインジケーターはチャートを常に監視し、一方向に勢いが定着してきた段階で、主要な値動きの直前に精度の高いエントリーシグナルを表示します。
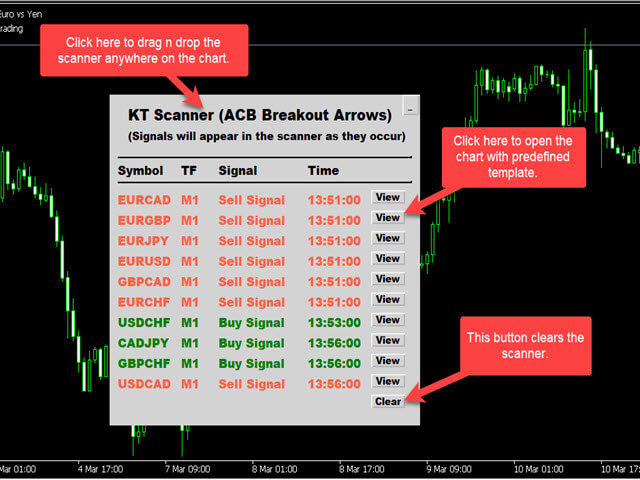
マルチシンボル・マルチタイムフレームスキャナーはこちらから - ACB Breakout Arrows MT5 用スキャナー
主な機能
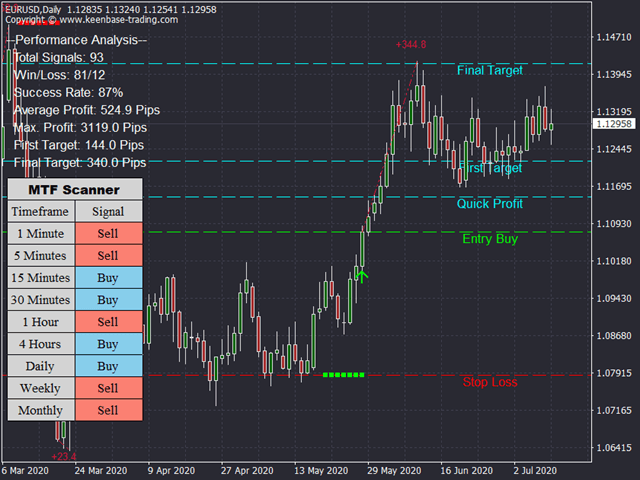
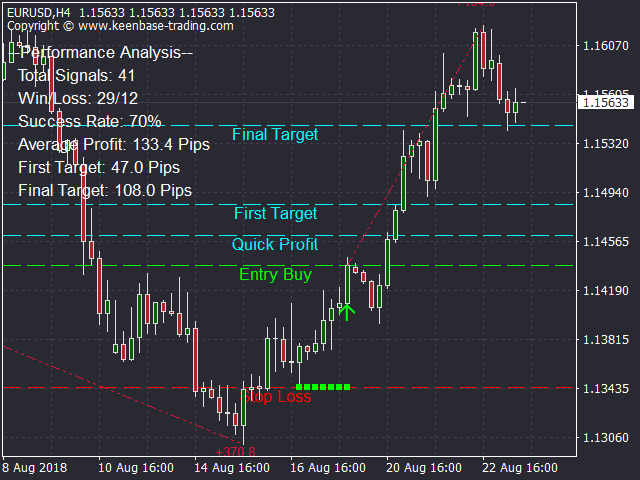
- ストップロスとテイクプロフィットの水準が自動で表示されます。
- すべての時間足のブレイクアウトシグナルを監視できるMTFスキャナーダッシュボードを搭載。
- デイトレーダー、スイングトレーダー、スキャルパーに最適。
- シグナル精度を高めるための最適化されたアルゴリズム。
- 損益分岐点やスキャルピングターゲットに使える特別なライン(クイックプロフィットライン)。
- 勝率、平均利益などのパフォーマンス分析メトリクスを表示。
- リペイントなし。
トレードの確認
- 低確率のトレードを除外するために ACB Trade Filter インジケーター を使用してください。
- 強い買い: 上向き矢印 + 緑のヒストグラム + 上昇トレンド。
- 強い売り: 下向き矢印 + 赤のヒストグラム + 下降トレンド。
- ヒストグラムがグレーでトレンドがレンジの場合はトレードを避けましょう。
(オプション) - 重要なサポート/レジスタンス付近でのトレードエントリーを避けるために、KT サポート&レジスタンスインジケーター の使用を推奨します。そういったエントリーはすぐに損失になる可能性があります。
「成功するトレーダーの目標は、最良のトレードを行うこと。お金は二の次である。」– アレキサンダー・エルダー
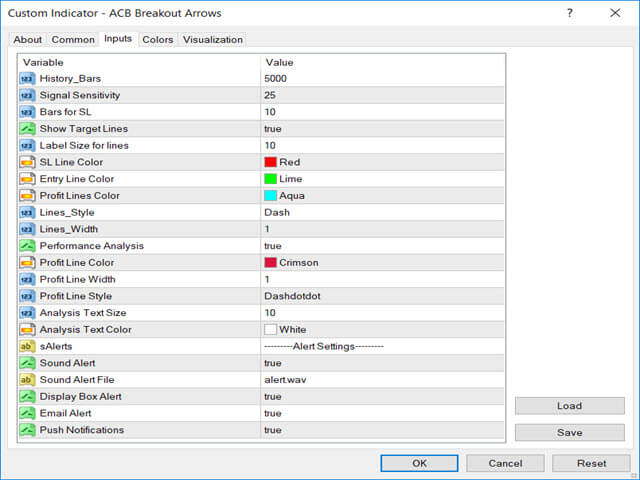
入力パラメータ
- ヒストリーバー数: インジケーターの計算に使用するバーの数。
- シグナル感度: 矢印シグナルの感度を選択。
- SL 用バー数: ストップロス計算に使用するバーの数。
- ターゲットラインの表示: SL、TP、クイックプロフィットのラインの表示/非表示を切り替え。
- パフォーマンス分析: 各シグナルの利益トレンドラインなどを含むパフォーマンス要素の表示/非表示。
- アラート設定: アラートボックス、メール、プッシュ通知、サウンドアラート対応。
EA 開発者向け
// 配列の定義

double Buy_Arrow[];
double Sell_Arrow[];
double Buy_SL[];
double Sell_SL[];

// インジケーターのハンドルを定義

int ACB_handle = iCustom(_Symbol,0,\"Market/ACB Breakout Arrows\");

// バッファを配列にコピー

CopyBuffer(ACB_handle,0,1,1,Buy_Arrow);
CopyBuffer(ACB_handle,1,1,1,Sell_Arrow);
CopyBuffer(ACB_handle,2,1,1,Buy_SL);
CopyBuffer(ACB_handle,3,1,1,Sell_SL);

if(Buy_Arrow[0] != 0) // 買いエントリー条件
if(Sell_Arrow[0] != 0) // 売りエントリー条件

Buy_SL[0]; // 買いストップロス
Sell_SL[0]; // 売りストップロス

// チャートからターゲットを取得

double Quick_Profit = NormalizeDouble(ObjectGetDouble(0, \"FirstTarget\", OBJPROP_PRICE), _Digits);
double First_Target = NormalizeDouble(ObjectGetDouble(0, \"Target1\", OBJPROP_PRICE), _Digits);
double Final_Target = NormalizeDouble(ObjectGetDouble(0, \"Target2\", OBJPROP_PRICE), _Digits);


...