Order Blocks ICT Multi TF MT5
- インディケータ
- バージョン: 2.0
- アップデート済み: 13 7月 2026
- アクティベーション: 10

[MT4 Version] [Kill Zones] [SMT Divergences]
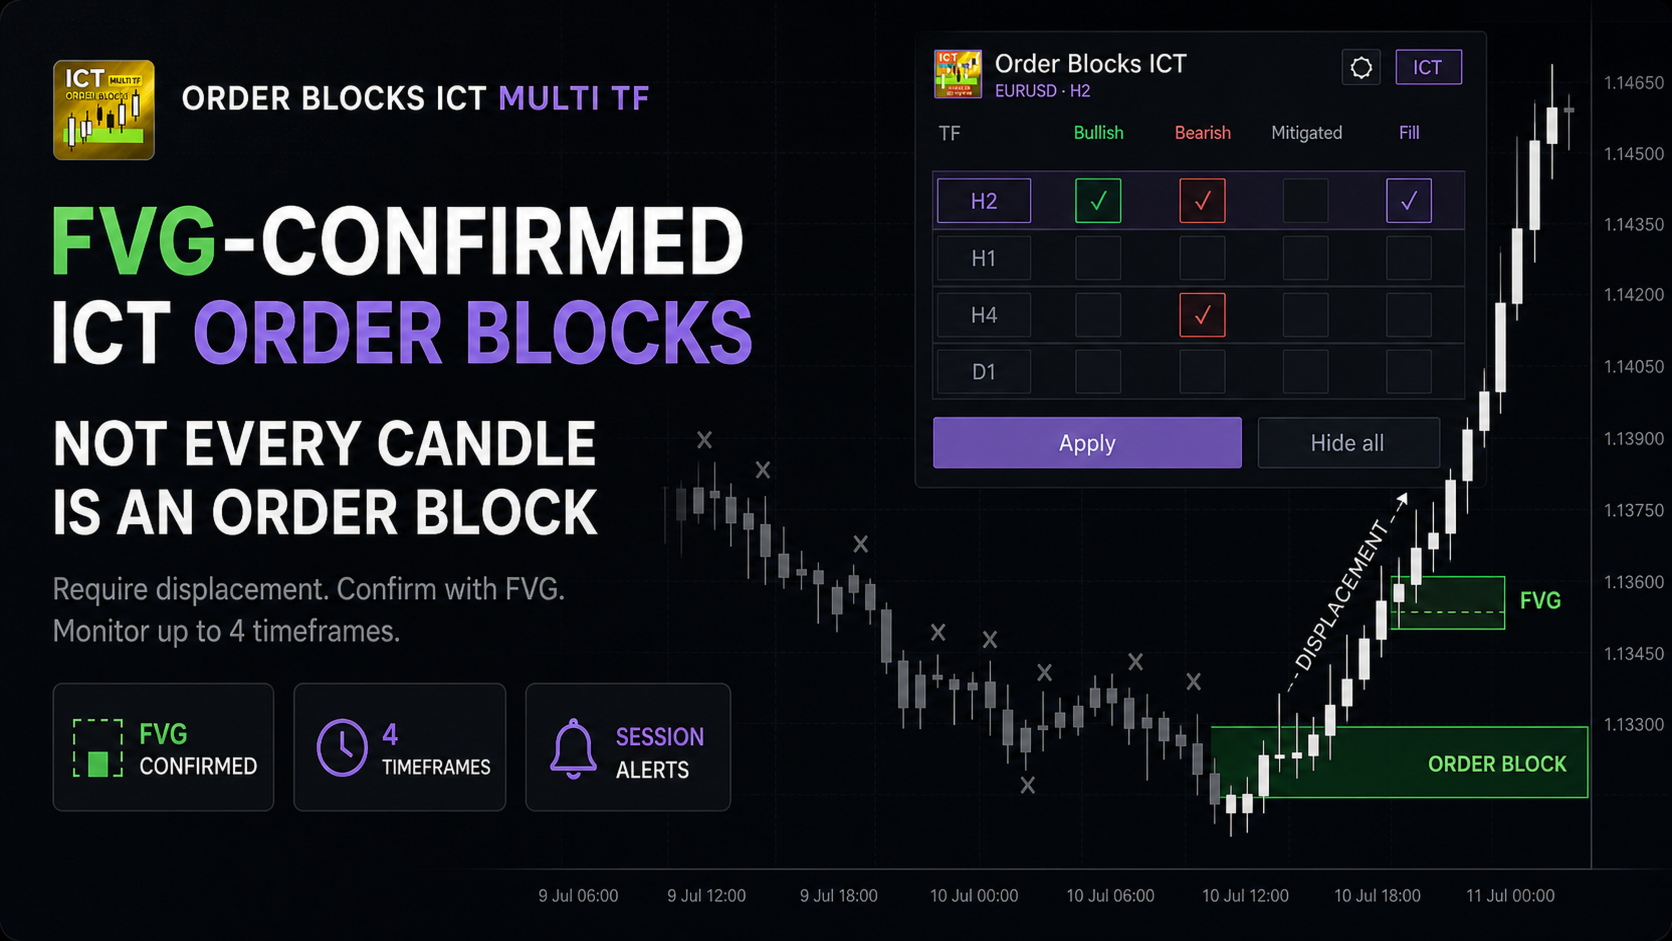
Order Blocks ICT Multi TF - FVG-Confirmed Order Blocks for MT5
Most ICT order block indicators for MT5 turn every opposite candle into an order block. The chart fills up and the label stops meaning anything.
Order Blocks ICT Multi TF uses Fair Value Gap confirmation and monitors up to four timeframes from one chart. It is built for traders who want a defined reason for the block, not another coloured rectangle.
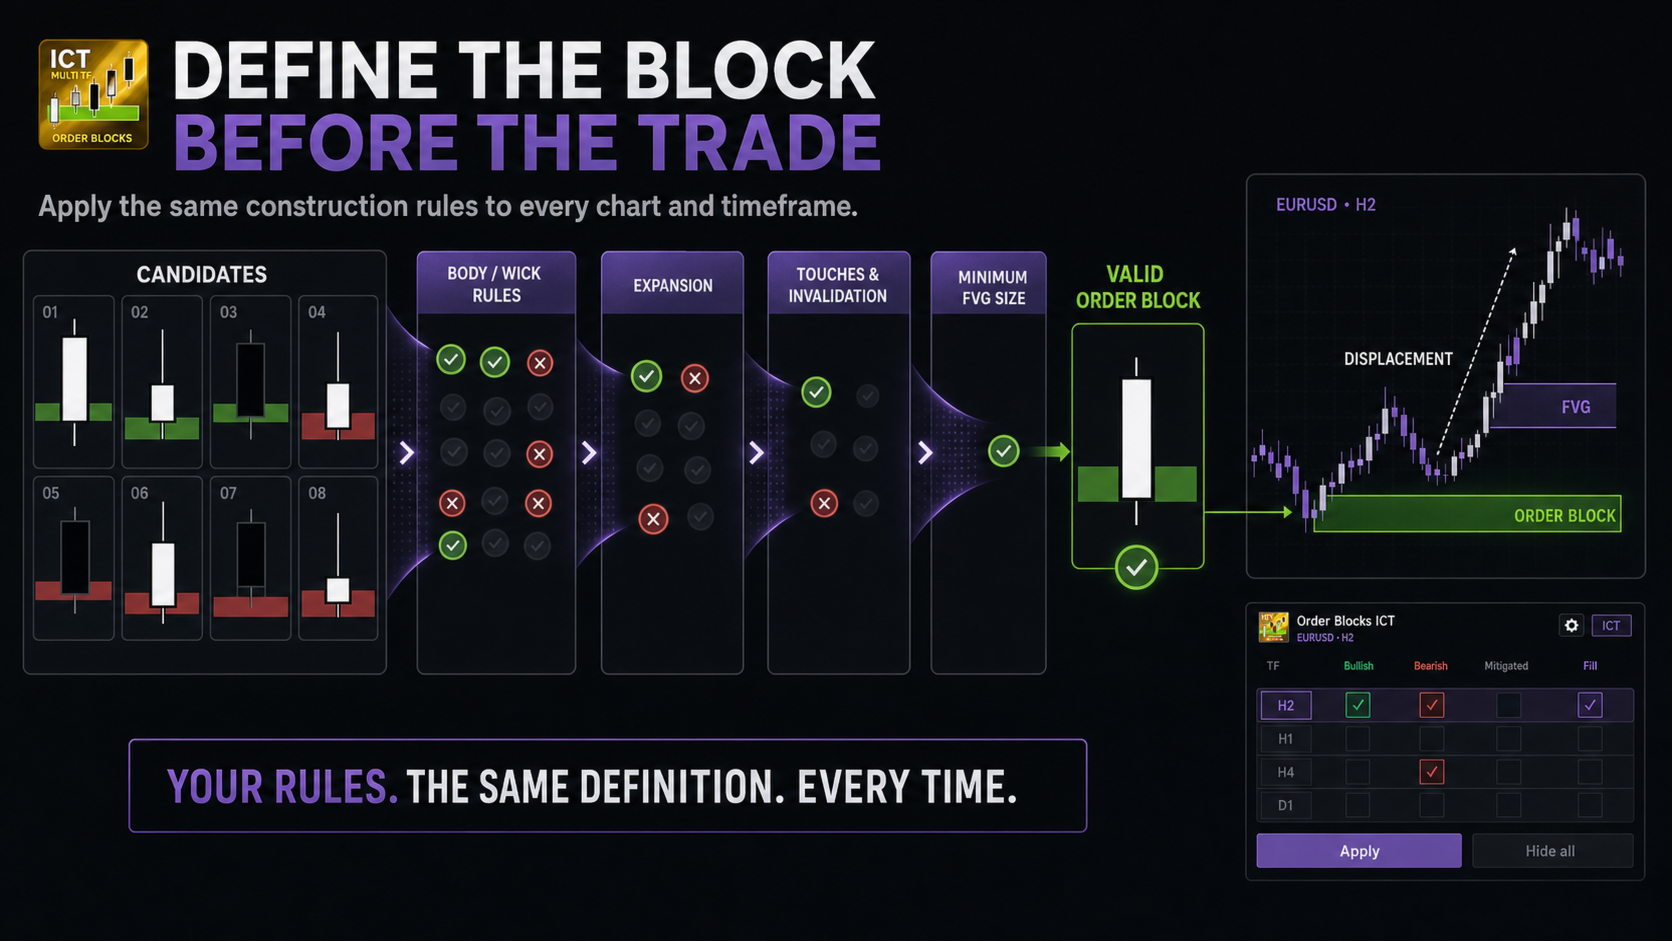
GIVE THE BLOCK A REASON TO MATTER
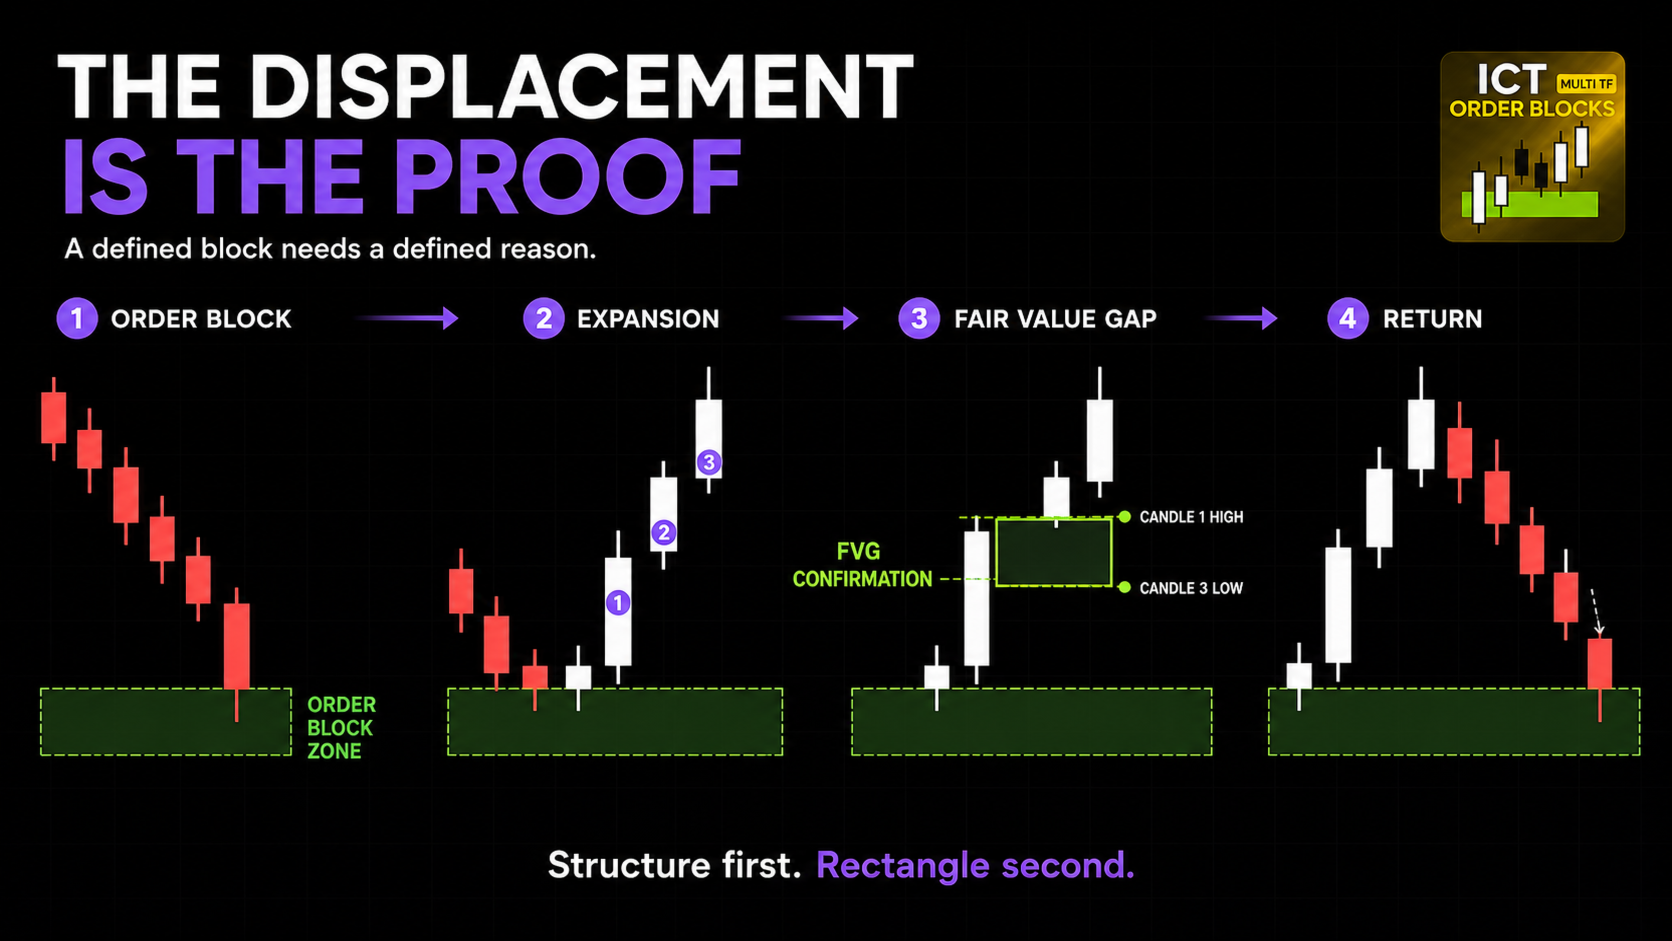
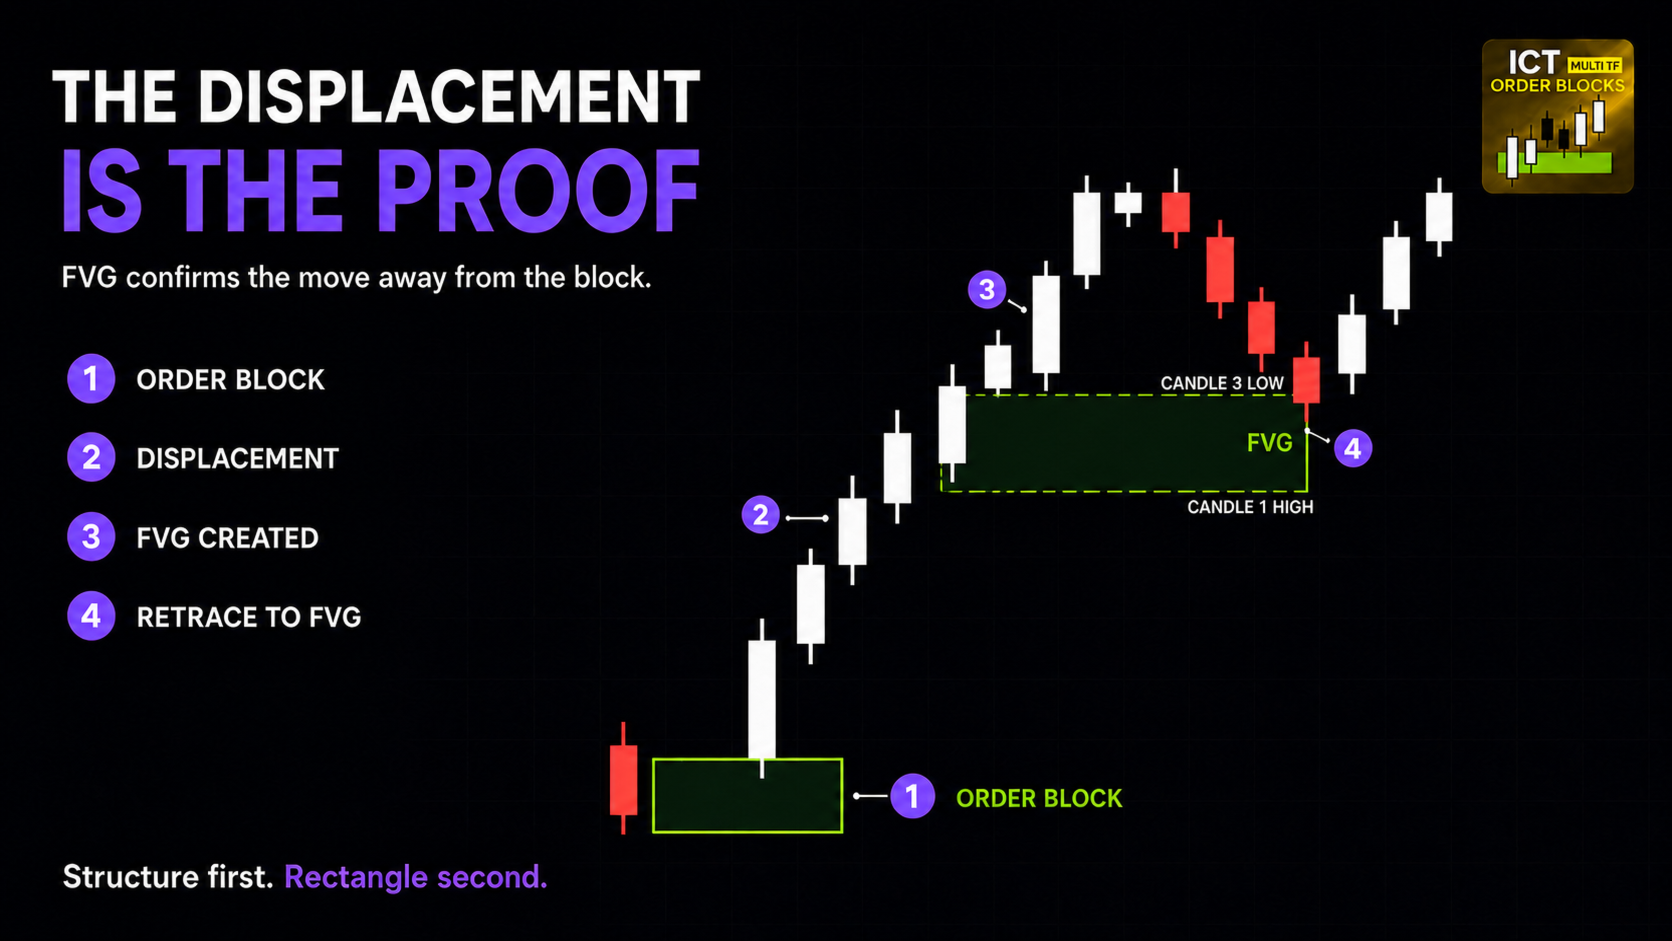
The detection engine evaluates the candle structure around a potential block and the expansion that follows it. Fair Value Gap confirmation connects the zone to visible displacement and can be drawn beside its associated block.
Control trend strength, candle-body and wick invalidation, expansion requirements, opposite-candle tolerance, touches before invalidation, zone penetration and departure, and minimum Fair Value Gap size.
The point is not to add more settings. It is to stop changing the definition of a valid block every time the last trade loses. Define the model once, then apply the same construction rules across your charts.
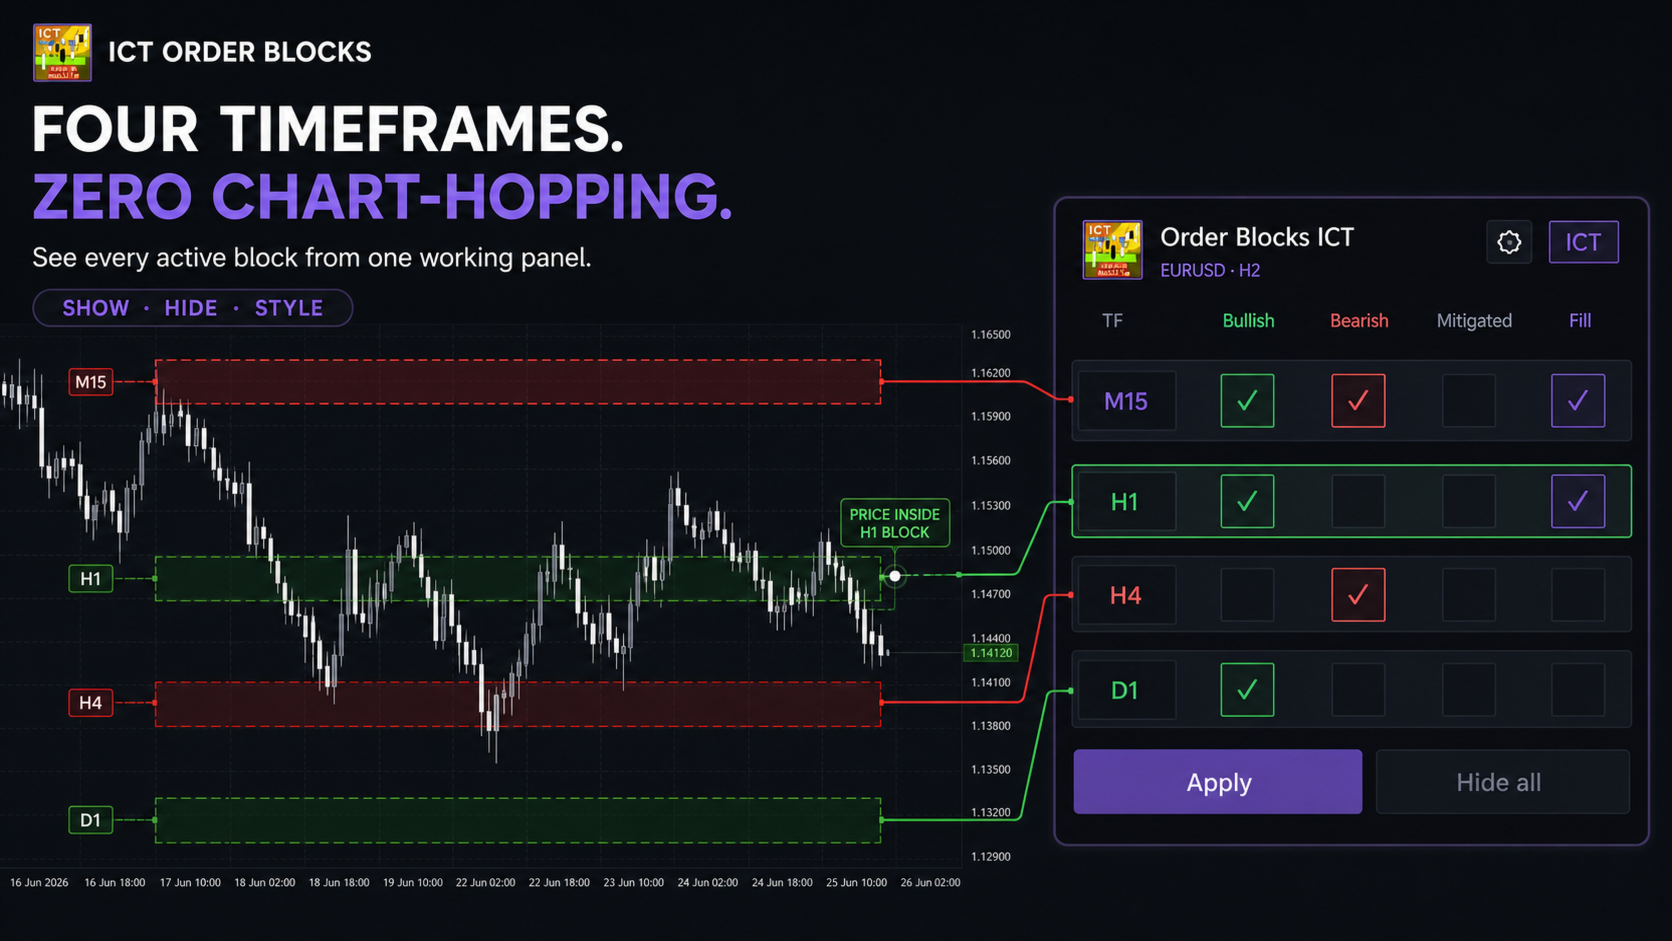
FOUR TIMEFRAMES. ONE WORKING PANEL.
- Select up to four independent timeframes.
- Show, hide and style every timeframe separately.
- See when price is inside any active order block.
- Display outer and inner price labels.
- Draw optional FVG boxes and a scalping reference level.
- Use filled or outlined zones with separate colours and line styles.
- Switch between Light and Dark panel themes.
The compact panel keeps active timeframes and touch state visible. You no longer have to jump from M5 to M15 to H1 just to discover that price already entered the zone you were waiting for.
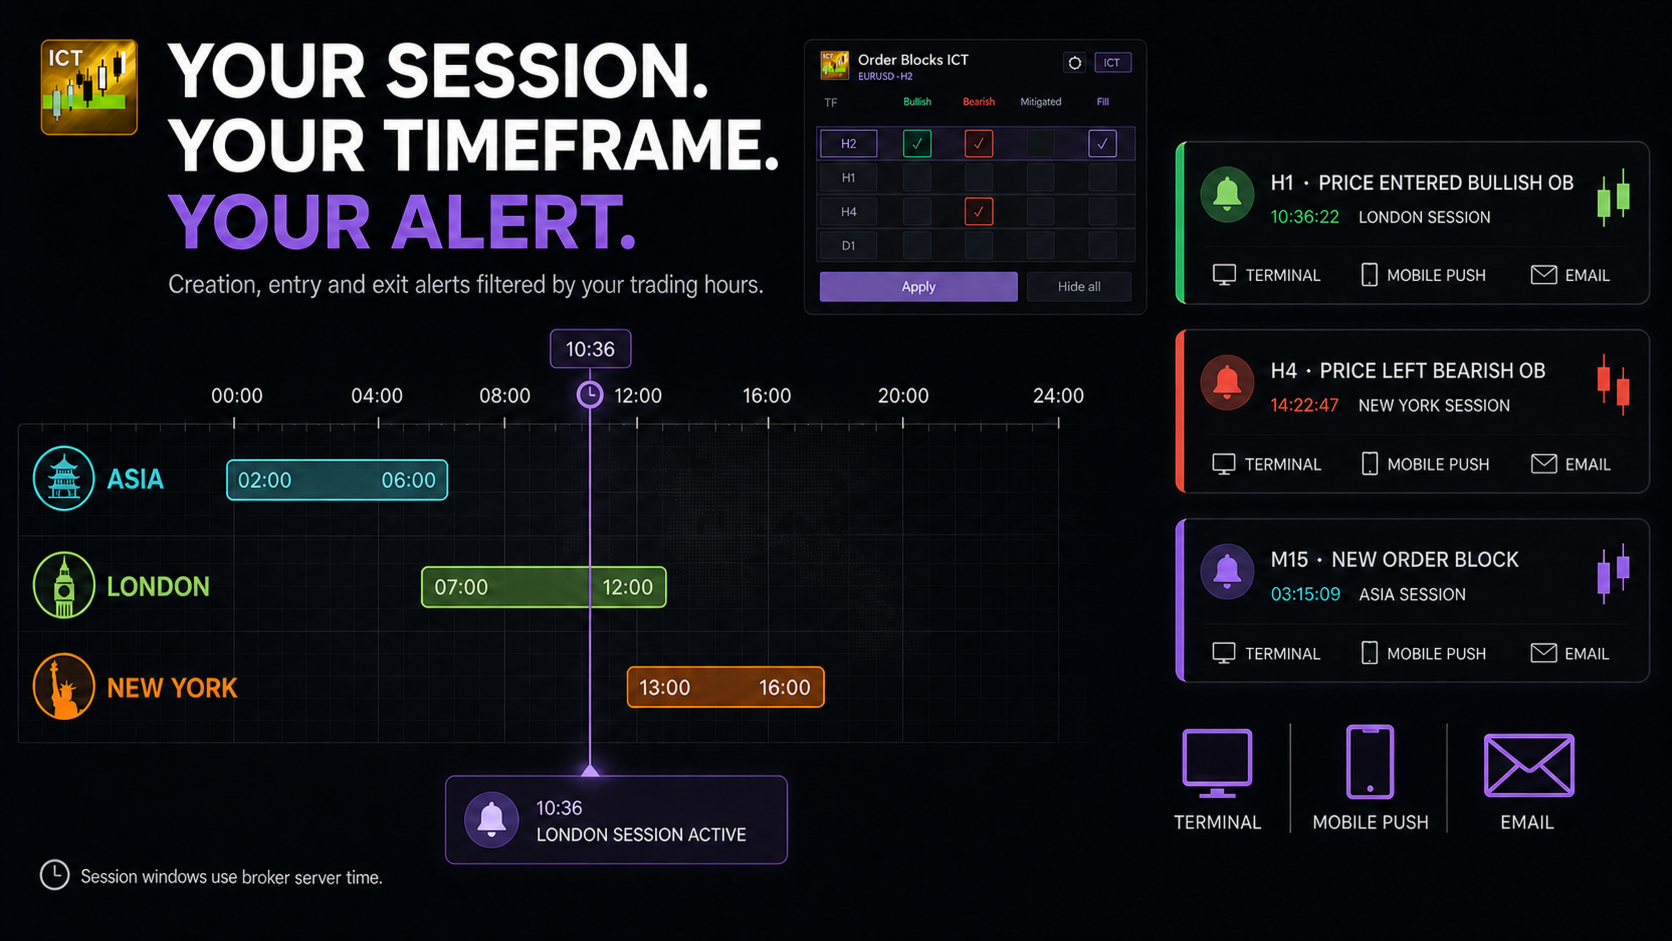
ENTRY, EXIT AND SESSION ALERTS
Receive alerts when a block is created, when price enters it and when price leaves it. Entry and exit states are tracked independently for each selected timeframe.
Use terminal, mobile push or email notifications. London, New York and Asia windows can restrict alerts to the sessions used by your plan. When no session is selected, alerts are allowed at any time.
Session times use the broker server clock and should be adjusted when the broker offset changes.
BUILT FOR TRADERS WITH AN ACTUAL ICT PROCESS
This product is for discretionary ICT and Smart Money Concept traders who want their block, displacement and session rules in the same workflow.
Choose ICT Multi TF when you need granular block construction, Fair Value Gap confirmation and session-filtered alerts. Choose DoIt Order Blocks when you prefer a simpler multi-timeframe zone-and-touch workflow.
It finds the structures that match your rules. It does not replace the rules. If you already trade an ICT model and want fewer arbitrary blocks, this is built for that workflow.


ユーザーは評価に対して何もコメントを残しませんでした