Monthly High Low Range Dynamique v

Dynamique mensuelle des plages hautes et basses v1.0

👤 Auteur :

KOUAME N'DA LEMISSA

📈 Description :

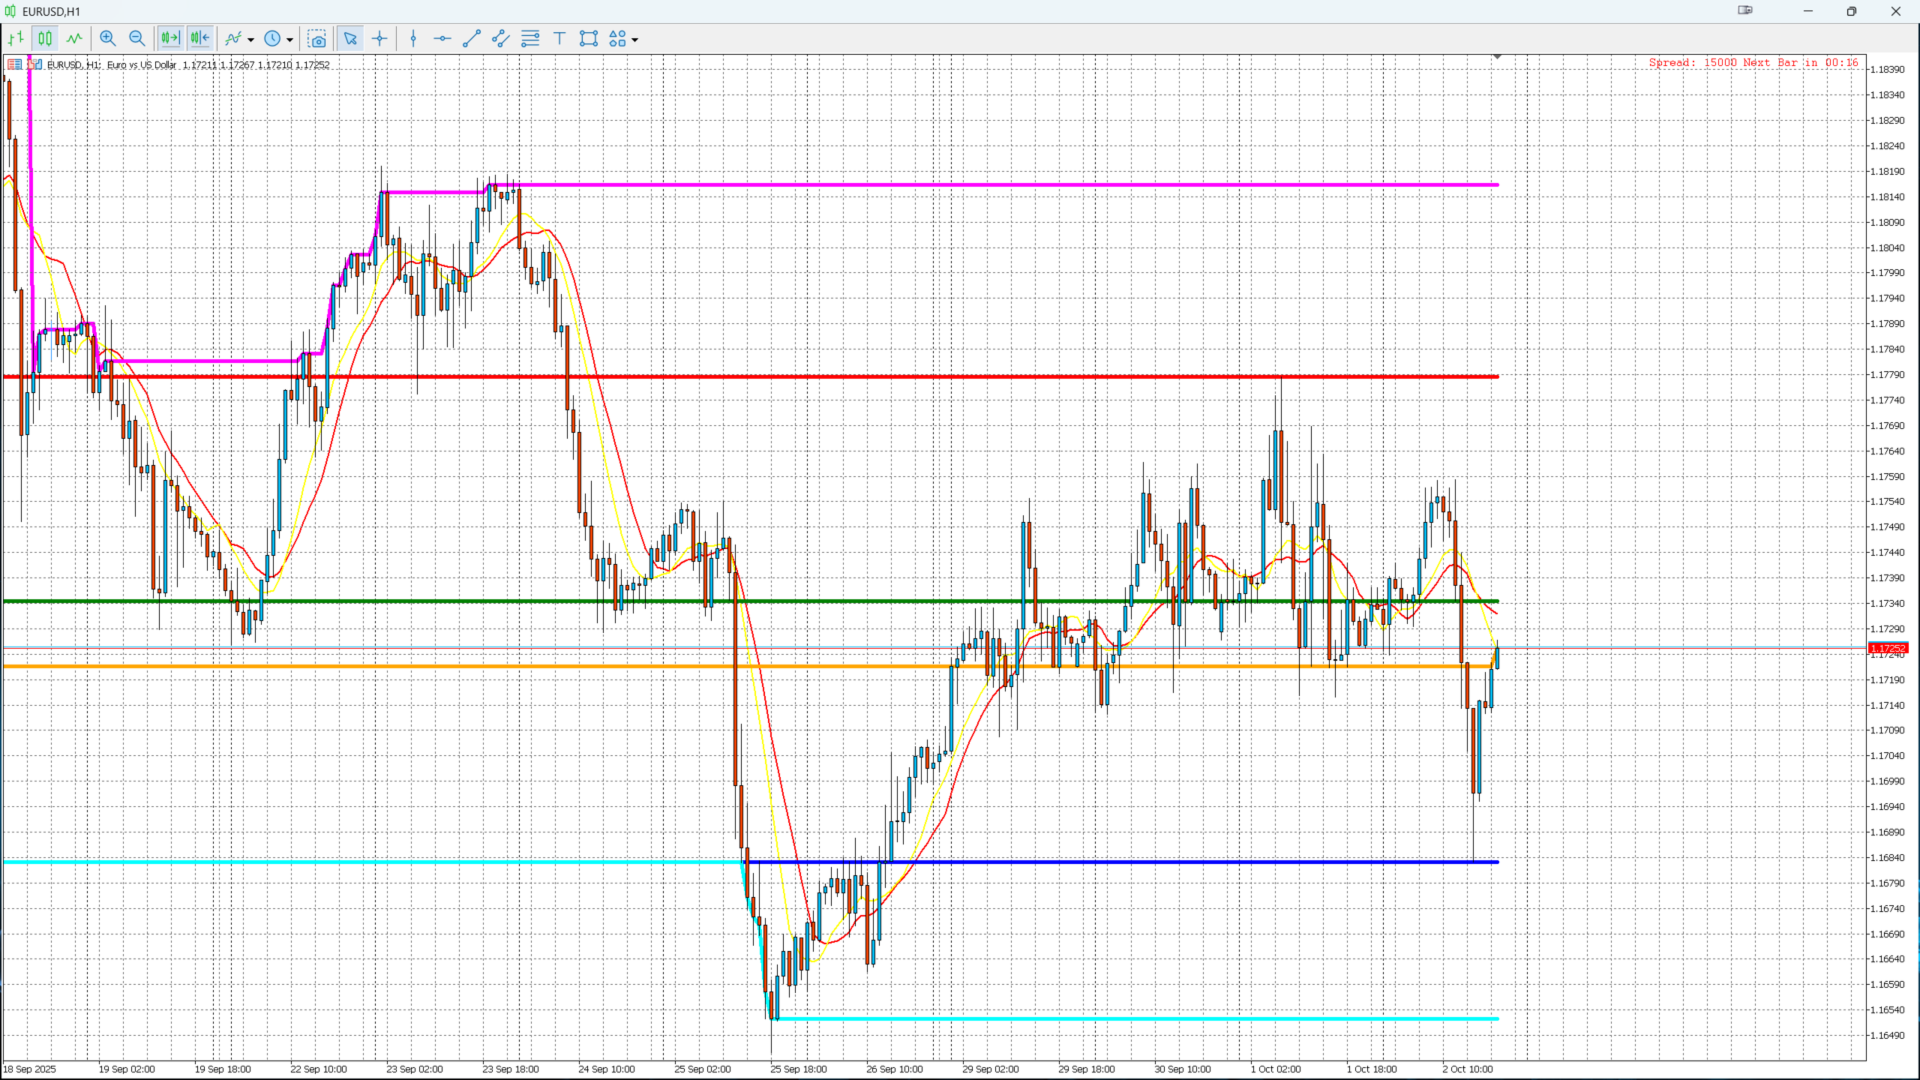
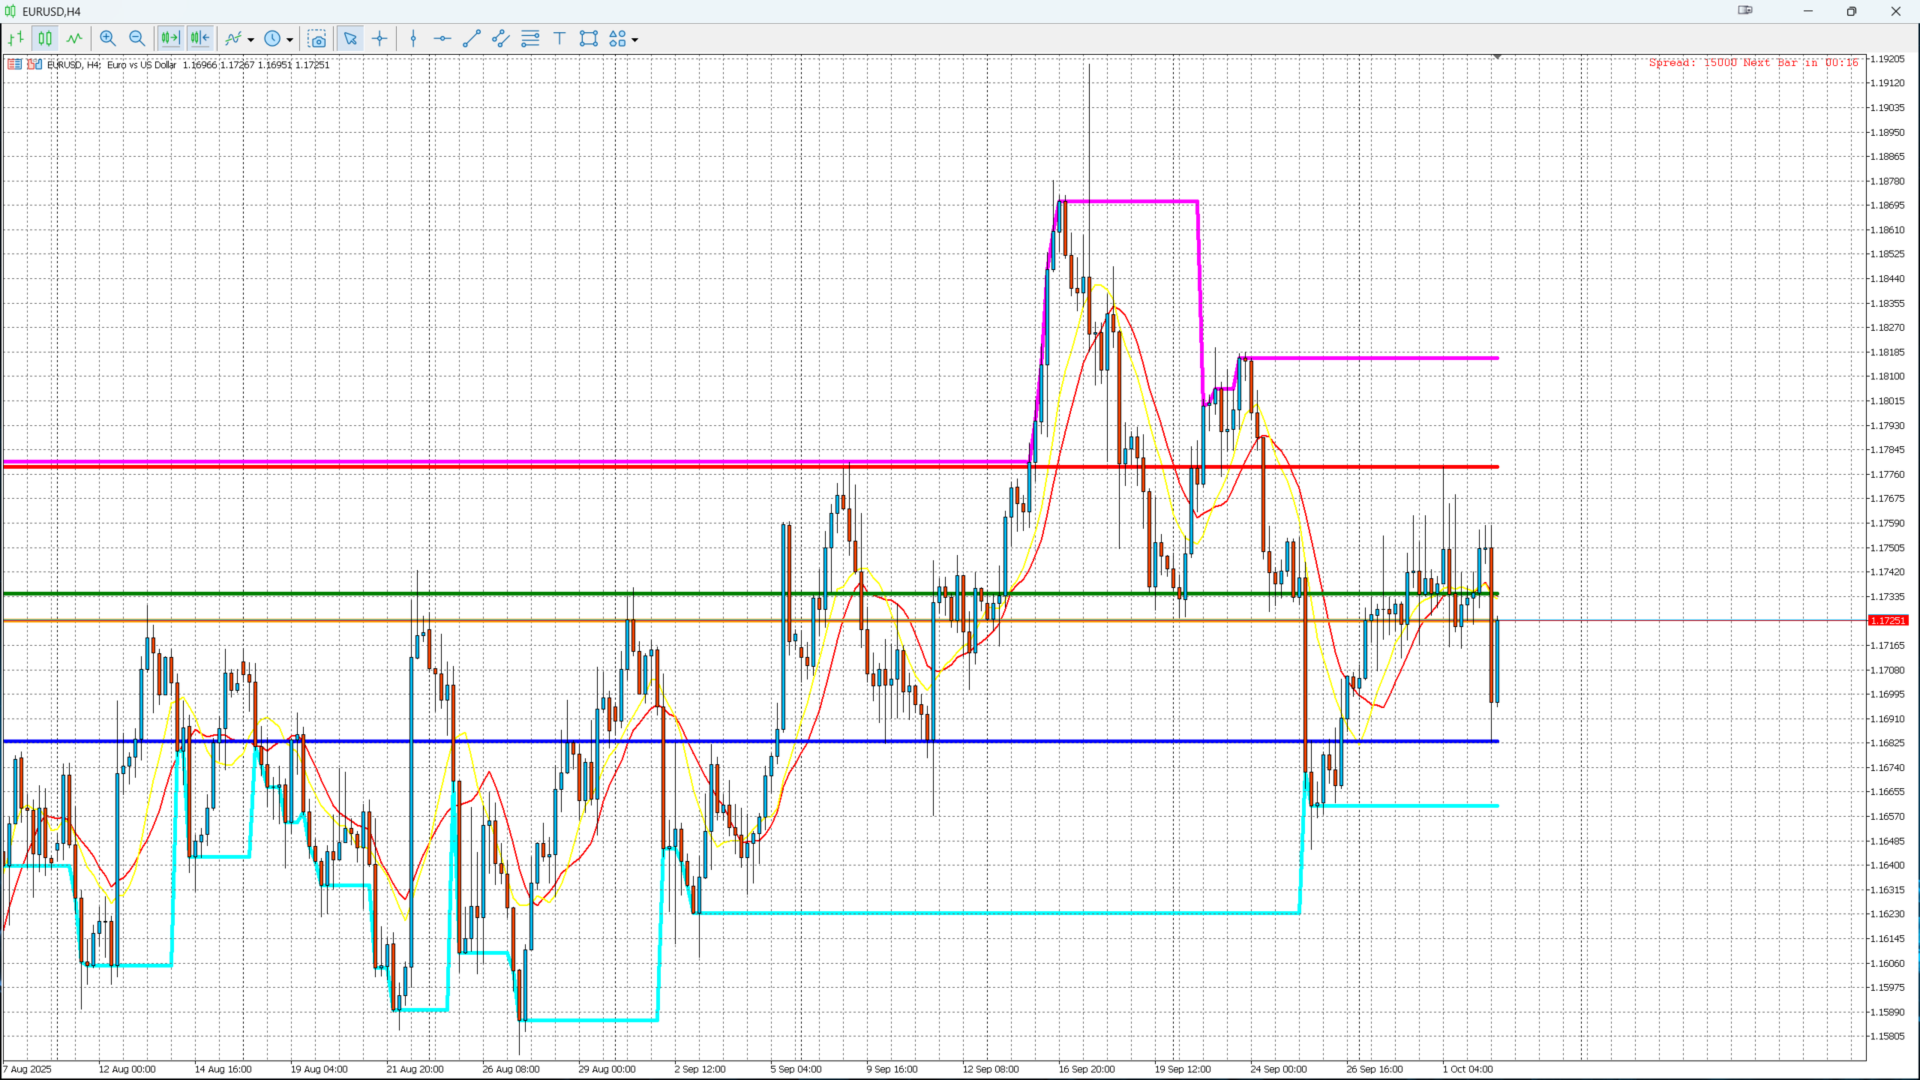
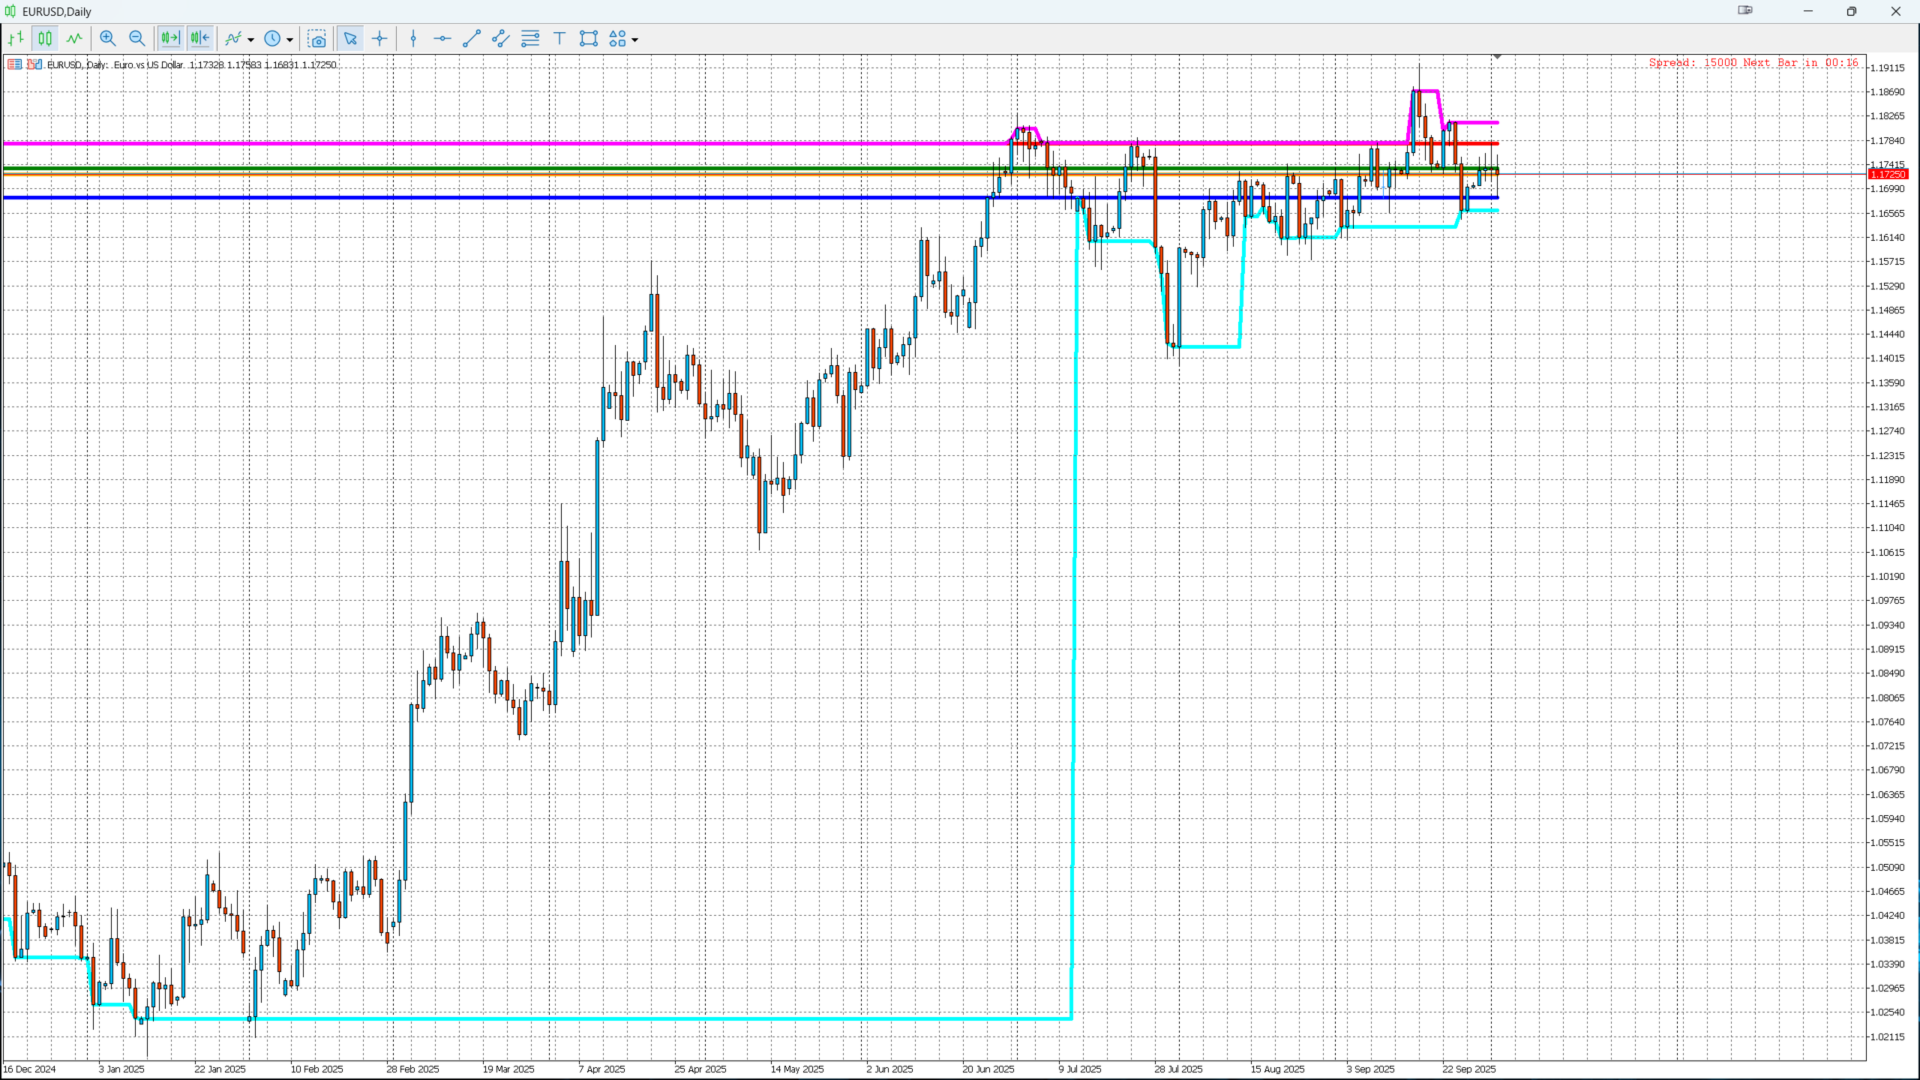
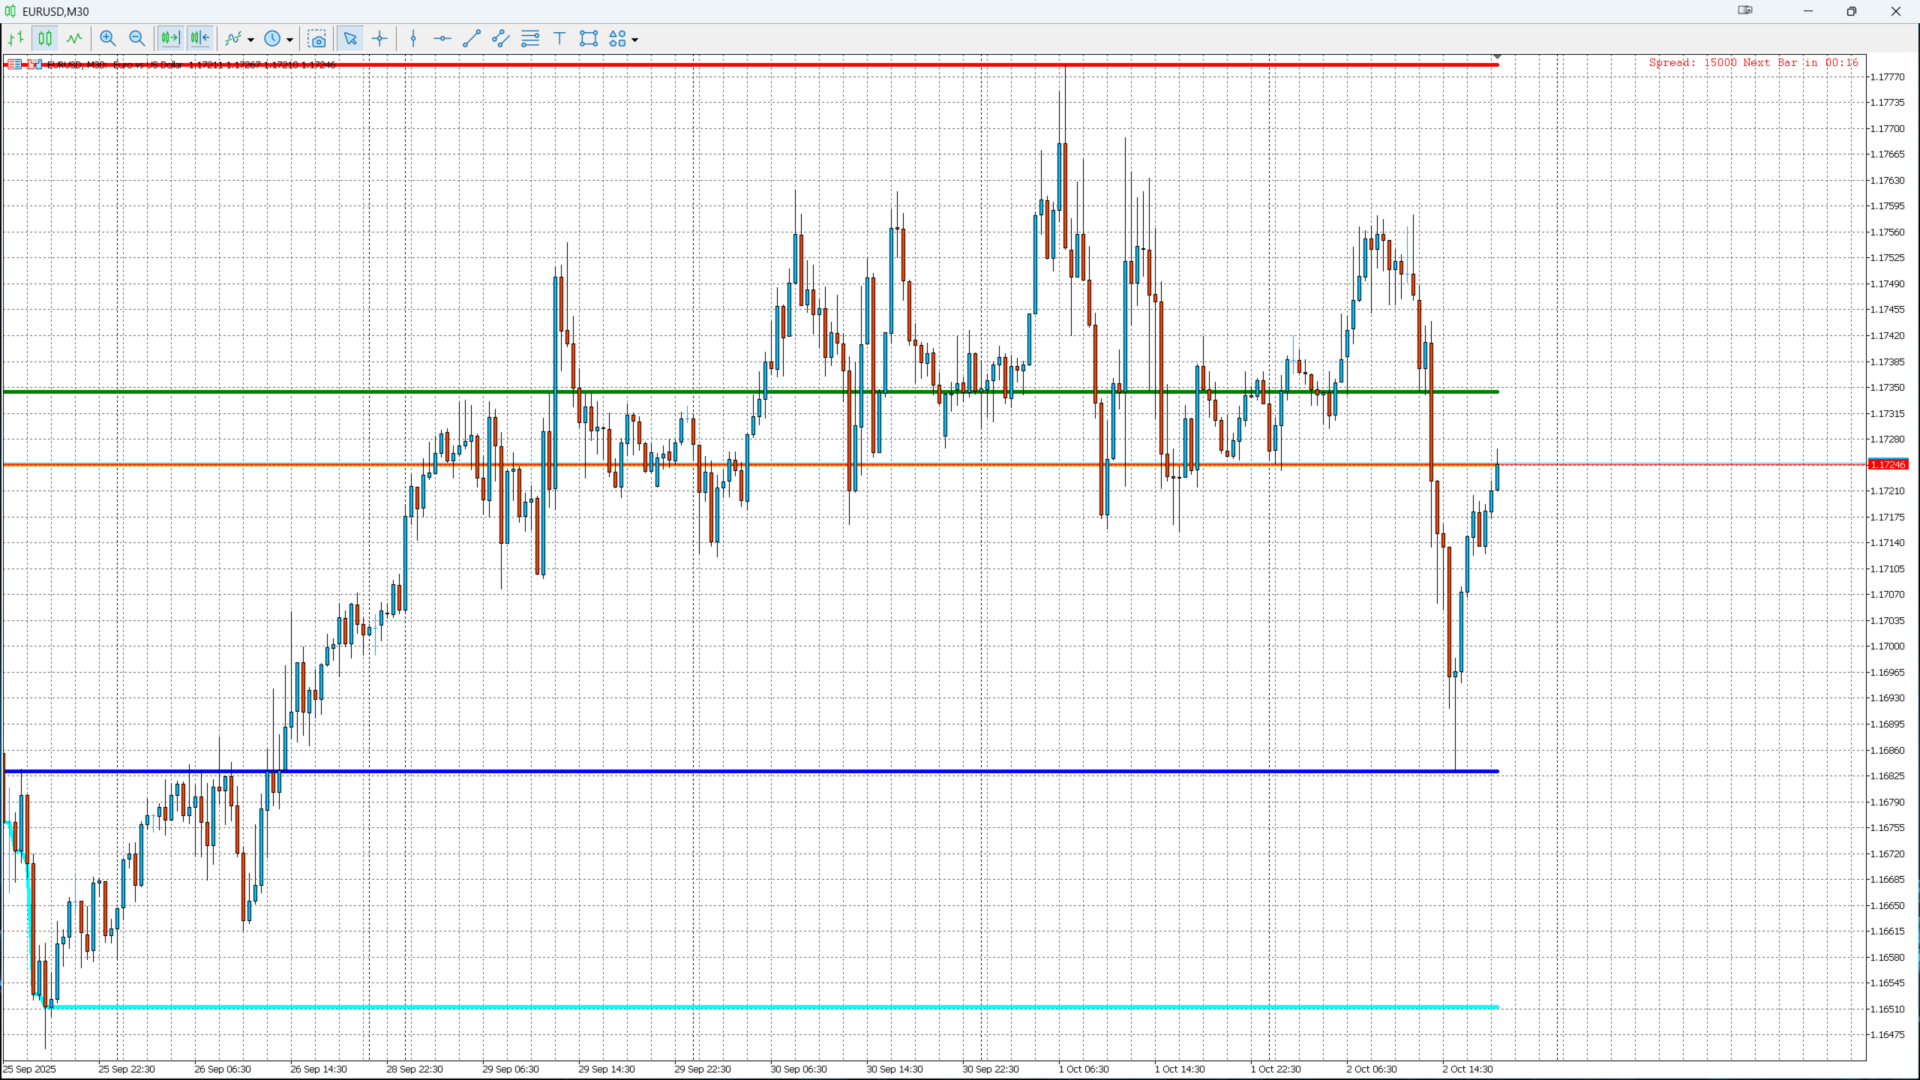
L' indicateur dynamique mensuel de fourchette haute et basse affiche les niveaux mensuels clés sur votre graphique grâce à des fonctionnalités avancées de suivi dynamique. Il permet aux traders de visualiser facilement les zones de support et de résistance mensuelles, ainsi que les zones où le prix tend à dépasser ou à tester ces niveaux, offrant ainsi des opportunités de trading précises.

🟢 Principales caractéristiques :

  1. Haut / Bas mensuel :

    • Rouge : Niveau de résistance mensuel (élevé)

    • Bleu : niveau de support mensuel (faible)

  2. Gamme dynamique haute/basse :

    • Magenta : High Range Dyn – suit les mouvements au-dessus du High initial

    • Cyan : Low Range Dyn – suit les mouvements en dessous du niveau bas initial

  3. Niveaux d'ouverture et de fermeture optionnels :

    • Ouvert (Vert) : Référence intermédiaire pour la confirmation d'entrée

    • Fermeture (Orange) : Point de référence pour le suivi des tendances

  4. Suivi dynamique :

    • Les niveaux dynamiques Haut/Bas s'ajustent automatiquement si le prix dépasse le niveau de référence mensuel.

    • Parfait pour détecter les cassures ou les zones de retournement.

⚙️ Paramètres d'entrée :

Paramètre Description Exemple
Ref_Timeframe Période de référence pour calculer les niveaux PERIODE_MN1
Ref_Shift Bougie de référence à utiliser 0

Les couleurs et les largeurs de ligne peuvent être personnalisées directement dans l'indicateur pour correspondre au style de votre graphique.

💡 Comment l'utiliser pour le trading :

  1. Identifier les zones clés :

    • Plus haut mensuel = forte résistance → envisagez des positions de vente si le prix rebondit.

    • Plus bas mensuel = support fort → envisagez des positions d'achat si le prix rebondit.

  2. Surveiller les évasions dynamiques :

    • Clôture au-dessus du High Range Dyn → début potentiel d'une tendance haussière.

    • Clôture en dessous de Low Range Dyn → début potentiel d'une tendance baissière.

  3. Combiner avec Ouvrir / Fermer :

    • Utilisez le niveau ouvert pour confirmer la direction du marché.

    • La clôture peut servir à placer un stop ou à confirmer une cassure.

✅ Avantages :

  • Interface graphique claire et intuitive

  • Compatible avec tous les symboles et courtiers

  • Permet un suivi dynamique pour ne jamais manquer les évasions

  • Optimisé pour le trading mensuel et swing


おすすめのプロダクト
ROMAN5 Time Breakout Indicator automatically draws the boxes for daily support and resistance breakouts. It helps the user identifying whether to buy or sell. It comes with an alert that will sound whenever a new signal appears. It also features an email facility. Your email address and SMTP Server settings should be specified in the settings window of the "Mailbox" tab in your MetaTrader 5. Blue arrow up = Buy. Red arrow down = Sell. You can use one of my Trailing Stop products that automatical
FREE
SlopeChannelB – 価格の傾斜チャネルを構築するテクニカル分析ツールで、市場の現状を評価し、取引シグナルを見つけるためのユニークな機会を提供します。 インジケーターの主な特徴: 価格の傾斜チャネル : このインジケーターは、サポートとレジスタンスのレベルを視覚化するのに役立ち、トレンドの逆転または継続の可能性を示すことができます。 ラインの色と背景の強調表示が異なる : 傾斜したサポートとレジスタンスのレベルは異なる色で表示され、チャネル自体はさらに背景で強調され、チャートの視覚的分析を簡素化します。 ライン計算のための3つのオプション : このインジケーターは回帰分析を使用してチャネルラインを構築します。3つの方法から選択できます: Robust(デフォルト) – 外れ値に強い方法。 OLS(最小二乗法) . Median(中央値計算) . 最適なモデル選択 : SlopeChannelBは5つの品質基準の分析に基づいて最も適切なチャネルラインのバリエーションを自動的に選択します。 品質パラメータはチャートに直接表示され、結果の評価に役立ちます。また、ボタンを使
AlphaGain AI – 次世代AIによるエリートトレーディング精度 AlphaGain AIは、MetaTrader 5向けに設計された高性能エキスパートアドバイザー(EA)で、AIと過去10年以上のデータを活用し、マーケット環境に応じた自動適応戦略で正確なシグナルを提供します。 主な特徴: AIコア:ローソク足パターン、ボラティリティゾーン、モメンタムロジックを解析; 10年以上のヒストリカルデータで学習; 高度なエントリー/エグジットロジック:SL/TP、トレーリングストップ、ブレイクイーブン、ボラティリティに応じたTP; 資金保護:ドローダウン制限、エクイティガード、最大スプレッドフィルター、取引時間制限; 完全自動運用:人間の介入不要; 低レイテンシー対応:ECN環境に最適化。 推奨設定: 通貨ペア:EUR/USD 時間足:15分(M15) 最低残高:100ドル アカウントタイプ:ECNまたはRaw Spread レバレッジ:1:100以上 AlphaGain AIを選ぶ理由: 簡単導入:.ex5ファイル、.set設定、PDFガイド付属;
New Product Description for MadoCryptoXPro --- MadoCryptoXPro — The Smartest Crypto Warrior ️ Battle-tested on BTC & ETH. Built for real-time chaos. --- MadoCryptoXPro isn’t just another technical bot. It’s a battlefield machine designed to handle the madness of BTCUSD and ETHUSD with surgical precision. Whether the market is flat, trending, or just plain psycho — it stays focused, adapts fast, and protects your capital like a vault guard on Red Bull. --- Core Features: Smart
Gioteen Volatility Index (GVI) - your ultimate solution to overcoming market unpredictability and maximizing trading opportunities. This revolutionary indicator helps you in lowering your losing trades due to choppy market movements. The GVI is designed to measure market volatility, providing you with valuable insights to identify the most favorable trading prospects. Its intuitive interface consists of a dynamic red line representing the volatility index, accompanied by blue line that indicate
Trade Extender
Loncey Duwarkah
5 (1)
Autonomously executes trades, overseeing the entire process from initiation to completion.  Free support via chat, email and remote assistance Originally built for XAUUSD (Gold). Settings changes for other symbols Powerful rules management Enhanced positioning features Risk Management / Dynamic lot sizing Quick Setup Symbols : XAUUSD Investment for all: Our trading bot is crafted to serve traders of all investment levels, ensuring accessibility to the forex market even for those with limited fu
Advanced Trading Chaos  The main purpose of the indicator is to help the trader detect the signals described by Bill Williams in his books to make a quick and correct trading decision. 1)Bullish/Bearish Reversal Bar(BDB) 2) Divergent Bar(DB) 3) Second Sage Signal — the third consecutive Awesome Oscillator bar  4) Working fractals (Fractals that worked above/below the red forehead  5) Three bar coloring modes 5.1) Coloring of bars according to the AO indicator (Including the squatting bar) 5.2
MT4版  |  FAQ Owl Smart Levels Indicator は、 Bill Williams の高度なフラクタル、市場の正しい波構造を構築する Valable ZigZag、エントリの正確なレベルをマークする Fibonacci レベルなどの一般的な市場分析ツールを含む 1 つのインジケーター内の完全な取引システムです。 利益を得るために市場と場所に。 戦略の詳細な説明 インジケータを操作するための指示 顧問-取引助手 プライベートユーザーチャット ->購入後に私に書いて、私はプライベートチャットにあなたを追加し、あなたはそこにすべてのボーナスをダウンロードすることができます 力はシンプルさにあります! Owl Smart Levels 取引システムは非常に使いやすいので、専門家にも、市場を勉強し始めて自分で取引戦略を選択し始めたばかりの人にも適しています。 戦略と指標に秘密の数式や計算方法が隠されているわけではなく、すべての戦略指標は公開されています。 Owl Smart Levels を使用すると、取引を開始するためのシグナルをすばやく確認し、注文を出すための
https://youtu.be/JJanqcNzLGM ,  https://youtu.be/l70MIHaQQa4 ,  https://youtu.be/pg0oiT5_8y0   Automated Supply and Demand Trading Edge MT5. These videos demonstrate how we apply the supply and demand system to our latest trading review and market analysis Enhance your Trading Strategy with the Supply and Demand Trading Edge MT5. Gain a competitive market advantage with the Supply and Demand Trading Edge MT5 indicator, a powerful tool that combines MACD signals with supply and demand zones. By
稼ぎと研究のためのツール。 トレーディングシグナルと戦略の中核は、価格予測パターンを形成するための著者のアルゴリズムに基づいています。どんな楽器にも使えます! MA「九尾の狐」に基づく制御システムが追加され、市場、機器、および作業期間に合わせて信号を可能な限り正確に更新および調整します。 対象:すべての市場のすべての商品(例外があります)。 対象者:ヘッジファンド、ファンドおよび資産運用会社、投資運用会社、投機家、投資家および利害関係者。 .................................................................................................................................................................................
PR EA - Engulfing Pattern Trading System Automated Engulfing Pattern Detection with MA Confirmation The PR EA is a Meta Trader 5 expert advisor that identifies and trades bullish/bearish engulfing candlestick patterns when confirmed by a moving average filter. Designed for swing trading on 30-minute charts with compatibility for M15 and H1 time frames. Key Features: Pattern Recognition - Detects valid bullish/bearish engulfing candle formations Trend Confirmation - 238-period SMA filter
The indicator detects divergence signals - the divergences between the price peaks and the MACD oscillator values. The signals are displayed as arrows in the additional window and are maintained by the messages in a pop-up window, e-mails and push-notifications. The conditions which formed the signal are displayed by lines on the chart and in the indicator window. The indicator parameters MacdFast - fast MACD line period MacdSlow - slow MACD line period MacdSignal - MACD signal line period Macd
Elite Harmony Signals Pro Panoramica Elite Harmony Signals è un indicatore sofisticato di analisi tecnica che visualizza rettangoli dinamici che forniscono zone di trading chiare e segnali di conferma per decisioni migliorate. Caratteristiche Principali Zone Rettangolo Dinamiche Estensione in Tempo Reale : I rettangoli si estendono automaticamente all'azione corrente del prezzo Chiusura Intelligente : I rettangoli si chiudono solo quando appaiono segnali opposti Conferma Visiva : Zone di trading
Gold Crazy EA   is an Expert Advisor designed specifically for trading Gold H1/ EU M15. It use some indicators to find the good Entry. And you can set SL or you can DCA if you want. It can be an Scalping or an Grid/ Martingale depend yours setting. This EA can Auto lot by Balance, set risk per trade. You also can set TP/ SL for earch trade or for basket of trade. - RSI_PERIOD - if = -1, then the default strategy works, if >0, then the RSI strategy works - MAX_ORDERS - to trade with only 1 order,
Description : Rainbow EA MT5 is a simple Expert advisor based on   Rainbow MT5 indicator witch is based on Moving average with period 34. The indicator is incorporated in the EA, therefore, it is not required for the EA to operate, but if you wish, you can download it from   my product page . The Expert Advisor settings are as follows : Suitable for Timeframes up to H1 The parameters below can be set according to your trading rules. StopLoss ( Stop Loss in pips) TakeProfit ( Take Profit in pips
Stop guessing. Start trading BTC with AI-powered precision. NeuralBTC AI is not just another Expert Advisor — it's a complete AI trading ecosystem built specifically for Bitcoin. Our proprietary neural network processes real-time BTCUSD market data 24/7, delivering actionable trading signals with calculated confidence levels. LIVE AI SERVER INCLUDED Your license includes full access to our cloud-based AI infrastructure: Dedicated neural network analyzing Bitcoin markets 24/7 Real-time dat
r-Trend Sync indicator is manual trading system for extra volatility markets. Main System features : The indicators's algorithm is based on the analysis of an extensive array of historical data (from 1995 for EURUSD & EURJPY and from 2004 for XAUUSD), which ensured the identification of general patterns in the behavior of these pairs across a wide range of timeframes. The analysis of historical data helped the system learn to recognize market triggers for medium-term trends and cycles, as well a
Supertrend indicator uses a combination of a moving average and average true range to detect the trend of a trading instrument. Supertrend indicator for MetaTrader 5 easily shows the trend as a line following the price. Triple SuperTrend Histo indicator  calculate  three supertrends to show the trend as a histogram. Changing the color from red to green means you can BUY , from green to red means you can SELL . Description of the method of drawing a histogram. The price is above the EMA 200,
Introducing the DS Gold Robot, your ultimate companion in navigating the intricate world of XAUUSD trading. Developed with precision and powered by cutting-edge algorithms, DS Gold is a forex robot meticulously crafted to optimize your trading performance with  XAUUSD pairs . With its advanced analytical capabilities,  DS Gold  Robot   constantly monitors the gold market, identifying key trends , patterns, and price movements with lightning speed. The DS Gold Robot opens positions every day from
Stargogs Spike Catcher
Lorenzo Edward Beukes
4.5 (8)
Stargogs Spike Catcher V4.0 This Indicator is Developed To milk the BOOM and CRASH indices . Now Also work on weltrade for PAIN and GAIN indices. Send me Message if you need any help with the indicator.  CHECK OUT THE STARGOGS SPIKE CATCHER EA/ROBOT V3: CLICK HERE ALSO CHECK OUT SECOND TO NONEFX SPIKE CATCHER:   CLICK HERE STARGOGS SPIKE CATCHER V4.0 WHATS NEW! Brand New Strategy. This is the Indicator you need for 2025. New Trend Filter to minimize losses and maximize profits. New Trendline th
Neon Trade(ネオン・トレード)—— 最先端の取引ソリューションで、財務的自由と最高レベルのトレーディングを実現 私は、あらゆるトレーダーの目的や課題に応えられる、唯一無二の取引ソリューションを開発することを目指しました。その核となるアイデアは、機械学習と高度な取引テクニックを融合させ、双方のシナジー効果を最大限に引き出すことにあります。本システムは、1~2か月で少額の資金を急成長させる用途にも、何年にもわたる長期投資にも適しています。 製品についてさらに詳しく知るためのリンク集 以下のことができるリンクです: 購入前の質問や、購入後のサポート・お問い合わせ 無料で試す 実際の口座で最も慎重なアプローチで取引するための.SETファイル 私のTelegramコミュニティ(質問や、すでに製品を購入された他ユーザーとの交流が可能) 慎重戦略による取引のモニタリング MetaTrader 4専用の同等バージョン! 製品と入力パラメータの詳細ガイド 重要!!!ロボットをご購入された方、または購入をご検討中の方は、必ず私にダイレクトメッセージを送信してください。設定のアドバイス、推奨事項
Engulfing with EMAs Indicator Unlock the power of advanced candlestick pattern detection with the Engulfing with EMAs Indicator , a cutting-edge tool designed for MetaTrader 5. This futuristic indicator combines the precision of engulfing pattern analysis with the trend-following strength of Exponential Moving Averages (EMA 21 and EMA 50), empowering traders to identify high-probability setups across all currency pairs and timeframes. Key Features: Comprehensive Engulfing Detection : Detects b
FX Order Flow MT5
Carl Gustav Johan Ekstrom
5 (1)
This powerful tool is engineered to transform the way traders analyze currency strength. Built for every experience level, it offers clear, actionable guidance on when to trade and in which direction. Its versatility extends across all currency-related symbols, including gold (XAU/USD) and bitcoin (BTC/USD). By delivering deep, data-driven insights, it empowers traders to make smarter, more confident decisions. Whether you're a beginner or a seasoned professional, this indicator equips you with
Description of   Simo : an innovative robot with a unique trading system Simo is a revolutionary trading robot that changes the rules of the game with its unique trading system. Using sentiment analysis and machine learning, Simo takes trading to a new level. This robot can work on any time frame, with any currency pair, and on the server of any broker. Simo uses its own algorithm to make trading decisions. Various approaches to analyzing input data allow the robot to make more informed decis
Gecko EA MT5
Profalgo Limited
5 (1)
NEW PROMO: Only a few copies copies available at 349$ Next price: 449$ Make sure to check out our " Ultimate EA combo package " in our   promo blog ! Gecko runs a simple, yet very effective, proven strategy.  It looks for important recent support and resistance levels and will trade the breakouts.  This is a "real" trading system, which means it will use a SL to protect the account.  It also means it will not use any dangerous techniques like martingale, grid or averaging down. The EA shows its
This indicator is great for trading on various trading pairs. The indicator itself uses mathematical linear strategies of augmented accuracy. It has many additional signals and basic signals. Many settings can be configured in the initial settings. There are lines and arrows on the graph for visualization. He displays his decision on a graph in the form of icons, text, and colored lines. There are only two types of main icons. In the tester it works fine by default in the settings. It is alread
MetaTrader 4 version available here : https://www.mql5.com/en/market/product/24881 FFx Basket Scanner is a global tool scanning all pairs and all timeframes over up to five indicators among the 16 available. You will clearly see which currencies to avoid trading and which ones to focus on. Once a currency goes into an extreme zone (e.g. 20/80%), you can trade the whole basket with great confidence. Another way to use it is to look at two currencies (weak vs strong) to find the best single pairs
Awesome Oscillator by Bill Williams with the ability to fine-tune and replace the averaging algorithms of the indicator, which significantly expands the possibilities of using this oscillator in algorithmic trading and brings it closer in its properties to such an indicator as the MACD. To reduce price noise, the final indicator is processed with an additional Smooth averaging. The indicator has the ability to give alerts, send mail messages and push signals when the direction of movement of th
Red and Green Light – Intelligent Trading Signal Indicator Product Overview Red and Green Light is a professional trading signal indicator based on the multi-stage T3 smoothing algorithm. It integrates a visual traffic light system, intelligent signal recognition, risk alerts, and multiple notification features. Whether you're a manual trader or an Expert Advisor (EA) developer, this indicator helps you capture market opportunities with greater precision and effectively avoid the risks of
このプロダクトを購入した人は以下も購入しています
AriX
Temirlan Kdyrkhan
1 (4)
AriX Indicator for MT5 A powerful trend-following and signal-evaluation tool AriX is a custom MT5 indicator that combines Moving Averages and ATR-based risk/reward logic to generate clear buy/sell signals. It visualizes dynamic SL/TP levels, evaluates past trade outcomes, and displays win/loss statistics in a clean on-chart panel. Key features include: Buy/Sell signals based on MA crossovers ATR-based SL/TP1/TP2/TP3 levels with visual lines and labels Signal outcome tracking with real-time stat
ARICoin is a powerful trading companion designed to generate high-probability entry signals with dynamic TP/SL/DP levels based on volatility. Built-in performance tracking shows win/loss stats, PP1/PP2 hits, and success rates all updated live. Key Features: Buy/Sell signals with adaptive volatility bands Real-time TP/SL/DP levels based on ATR Built-in MA Filter with optional ATR/StdDev volatility Performance stats panel (Success, Profit/Loss, PP1/PP2) Alerts via popup, sound, push, or email Cust
note: this indicator is for METATRADER4, if you want the version for METATRADER5 this is the link:  https://www.mql5.com/it/market/product/108106 TRENDMAESTRO ver 2.5 TRENDMAESTRO recognizes a new TREND from the start, he never makes mistakes. The certainty of identifying a new TREND is priceless. DESCRIPTION TRENDMAESTRO identifies a new TREND in the bud, this indicator examines the volatility, volumes and momentum to identify the moment in which there is an explosion of one or more of these da
「 Dynamic Scalper System MT5 」インジケーターは、トレンド波の中でスキャルピング取引を行う手法のために設計されています。 主要通貨ペアと金でテスト済みで、他の取引商品との互換性があります。 トレンドに沿った短期的なポジションオープンのシグナルを提供し、追加の価格変動サポートも提供します。 インジケーターの原理 大きな矢印はトレンドの方向を決定します。 トレンド波の中では、小さな矢印の形でスキャルピングシグナルを生成するアルゴリズムが機能します。 赤い矢印は強気方向、青い矢印は弱気方向です。 トレンドの方向には敏感な価格変動ラインが描かれ、小さな矢印のシグナルと連動します。 シグナルは次のように機能します。適切なタイミングでラインが現れるとエントリーシグナルが形成され、ラインが開いている間はポジションが保持され、完了すると取引が終了します。 推奨される動作時間枠はM1~H4です。 矢印は現在のローソク足に形成され、次のローソク足が開いている場合は、前のローソク足の矢印は再描画されません。 入力パラメータ Trend Wave Period - トレ
##   ONLY GOLD ##   Тiльки Золото ## **Mercaria Professional Trading Zones - Complete Guide** ## **Mercaria Professional Trading Zones - Повний посібник** ### **How Mercaria Zones Work / Як працюють зони Mercaria** **English:** Mercaria Zones is an advanced trading indicator that identifies high-probability support and resistance areas using ZigZag extremes combined with mathematical zone calculations. The indicator works on multiple timeframes simultaneously, providing a comprehensive view
無料の AUX インジケーターと EA サポ   直接ダウンロード — ここをクリック [ D.I.C.E ] The DICE Indicator Divergence in Chaos Environment は、エリオット波動理論とトレーディングカオス手法を組み合わせて使用するトレーダーのために設計された MT5 専用ツールです。価格変動の中の隠れたおよび通常のダイバージェンスを検出し、ビル・ウィリアムズが説明したカオス市場環境と同期します。 主な特徴 エリオット波動に対応したダイバージェンス検出:波動構造と調和した強気・弱気ダイバージェンスを識別。 カオス手法の統合:AO(オーサムオシレーター)と市場構造に整合。 マルチタイムフレームスキャン:異なる時間枠でダイバージェンスを分析し、トレンドの転換を確認。 視覚的アラートとオブジェクト:チャート上の矢印、ライン、マーカーで即座に識別。 市場適応読解:カオス的状況に自動適応し、ノイズを除去して有効なセットアップを維持。 ブレイクプルバックエントリー手法:シンプルなフィボナッチリトレースメントとピボットポイントを使用。 利点 ダイ
+++++++++++++++++++++++++++++++++++++++++++++++++++++++++++++++++++++++++++++++++++++++++++++++++ +++ Link to EURUSD Only Free Version -->  https://www.mql5.com/en/market/product/156904?source=Unknown +++++++++++++++++++++++++++++++++++++++++++++++++++++++++++++++++++++++++++++++++++++++++++++++++ Hallo Trader, This is a traditional GANN & FIBONACCI strategy based on detection of an impulsive move in the opposite direction. This is called a Breakout. At the moment of Breakout, the indicator draw
FRONTIER PIVOTS - Geometric Levels Indicator This indicator plots support and resistance levels/ranges on the chart using mathematical calculations. It helps traders identify potential price reaction zones based on geometric patterns. Main Features: Automatically calculates and displays key price levels Plots both support and resistance lines Uses daily price data for level calculation Clean visual presentation with different colors for different level types No repainting - levels remain static
A tool for on-chart strategy backtesting and performance analysis. A utility for developing, debugging, and testing custom trading ideas and indicator functions. An indicator designed to quickly test trading concepts and visualize the effectiveness of different input parameters. An all-in-one sandbox for testing everything from simple crossovers to complex, multi-condition trading systems.
Weis Wave with Alert MT5
Trade The Volume Waves Single Member P.C.
4.94 (17)
Rental/Lifetime Package Options and Privileges  Rent Monthly Six Months   Yearly/Lifetime Weis Wave with Speed with Alert+Speed Index x x x Manual  x x x Quick Set up Video x x x Blog x x x Lifetime Updates x x x Setup and Training Material x x Discord Access Channel "The SI traders"          x Rectangle Break Alert Tool      x How to trade with it:    http://www.tradethevolumewaves.com   ** If you purchase please contact me to setup your  : Training Room and  complete manual access.  Wei
Hello I Want to introduce The Forex Buy Sell Arrow Premium MT5 i recently release this premium indicator! its 1000% Non Repaint Indicator, It Work Perfectly Well,, i tested it day by day, Just mind blowing Result,  Including Powerful trend Algorithm! How It Work? well, it work market trend formula, when trend Bullish Or when trend Bearish,  Recommend Timeframe M30, H1 it work all timeframe, and all currency pair, 100% non repaint, How to take signal From Forex Buy Sell Arrow Premium Ind
Big Player Range
Thalles Nascimento De Carvalho
5 (3)
BigPlayerRange — MT5向け最強インジケーター BigPlayerRange は、MetaTrader 5 で日経ミニやドル先物などの取引において、 最も効果的なインジケーター と評価されています。大口投資家(機関投資家)の行動を可視化し、高精度なテクニカル分析を可能にします。 どのように機能するのか? BigPlayerRangeは、買い圧力ゾーン(緑ライン)と売り圧力ゾーン(赤ライン)を描画し、価格がその範囲を超えるとトレンド方向への動きを示唆します。 緑のライン上で終値: 買いの勢いが強く、上昇トレンドの可能性。 赤のライン下で終値: 売り圧力が優勢で、下落が予想される。 範囲内での価格: レンジ相場でブレイクを待つ段階。 主なメリット: 機関投資家ゾーンの検出: 大口のエントリーポイントを視覚化。 自動ターゲット計算: 利確ポイントを戦略的に設定。 プルバックの可能性分析: リスク管理に役立つ情報提供。 推奨の使い方: Imbalance DOM Pro と併用してゾーンブレイクを確認。 SwingVolum
Enigma 112 Indicator - User Manual Enigma 112 Indicator Complete User Manual - Ultimate Trading Solution Introduction The Enigma 112 is a comprehensive multi-timeframe trading indicator that combines advanced technical analysis concepts including Tesla 3-6-9 Gates, Huddleston Theory, PO3 Dealing Ranges, and sophisticated risk management systems. Tesla 3-6-9 Gates Based on Nikola Tesla's vortex mathematics for precise support and resistance levels Huddleston Theory Volume-based market
VTrende Pro
Andrii Diachenko
5 (1)
VTrende Pro - MTF indicator for trend trading with a display panel for MT5 *** Videos can be translated into any language using subtitles (video language - Russian) Although the signals of the VTrende Pro indicator can be used as signals of a full-fledged trading system, it is recommended to use them in conjunction with the Bill Williams TS. VTrende Pro is an extended version of the VTrende indicator. Difference between Pro version and VTrende: - Time zones - Signal V - signal 1-2 waves -    S
インジケーターは任意のポイントから出来高を分析し、その出来高に対する市場のエグゾースト(疲労)レベルを計算します。 Meravith の主なライン: 強気出来高エグゾーストライン – 目標として機能します。 弱気出来高エグゾーストライン – 目標として機能します。 トレンドライン – 市場のトレンドを示します。市場が強気か弱気かに応じて色が変化し、トレンドサポートとして機能します。 使い方: 紫色の縦線をダブルクリックし、希望の位置に移動してください。 トレンドや調整など、あらゆるものを分析できます。インジケーターを市場の上部、下部、または重要と考える任意のポイントに移動します。良い方法は、市場がエグゾーストラインの間に位置するように Meravith を設定することです。こうすることで、追跡できる明確な目標を持つことができます。 初期のエグゾーストラインがブレイクされた場合、新しいエグゾーストラインが出現し、追加の取引可能なチャネルが形成されます。 エグゾーストに到達した後は、インジケーターの位置を変更するか、別の時間枠に切り替えて新しいエグゾーストレベルを特定できます。 トレンドラ
ChartMaster Heikin Ashi with Pivot Indicator for MT5 Take your trading to the next level with ChartMaster Heikin Ashi with Pivot Indicator , a powerful tool that combines the clarity of Heikin Ashi candles with advanced pivot-point analysis. This indicator is designed for traders who want to identify market trends, reversals, and key support/resistance zones with precision. Key Features: Heikin Ashi Visualization – Smooths out market noise for cleaner trend identification. Automatic Pivot
The Second-Level Tick Candlestick Generator is a professional-grade MT5 indicator tool specifically designed for high-frequency trading and short-term scalping. It can convert raw tick data into highly customizable second-level candlestick charts in real-time, helping traders accurately capture micro-market fluctuations and optimize entry and exit timing. This tool provides clear chart displays, allowing you to more intuitively identify price action patterns and improve trading decision efficien
XCalper TFO
Aecio de Feo Flora Neto
This oscillator was developed exclusively by xCalper in 2015 based on moving averages calculations to indicate and try predicting oversold and overbought levels. The fast line (white, by default) oscillates basically between values -0.5 (oversold) and +0.5 (overbought). Whenever this line crosses upward value -0.5, it means an oversold price level. When it crosses downward value +0.5, it means an overbought price level. When fast line crosses value 0.0 and returns, it is a strong pull-back indic
The Expert Advisor and the video are attached in the Discussion tab . The robot applies only one order and strictly follows the signals to evaluate the indicator efficiency. Pan PrizMA CD Phase is an option based on the Pan PrizMA indicator. Details (in Russian). Averaging by a quadric-quartic polynomial increases the smoothness of lines, adds momentum and rhythm. Extrapolation by the sinusoid function near a constant allows adjusting the delay or lead of signals. The value of the phase - wave s
Классификатор силы тренда. Показания на истории не меняет. Изменяется классификация только незакрытого бара. По идее подобен полной системе ASCTrend, сигнальный модуль которой, точнее его аппроксимация в несколько "урезанном" виде, есть в свободном доступе, а также в терминале как сигнальный индикатор SilverTrend . Точной копией системы ASCTrend не является. Работает на всех инструментах и всех временных диапазонах. Индикатор использует несколько некоррелируемых между собой алгоритмов для класси
FFx Universal Strength Meter PRO is more than a basic strength meter. Instead of limiting the calculation to price, it can be based on any of the 19 integrated strength modes + 9 timeframes. With the FFx USM, you are able to define any period for any combination of timeframes. For example, you can set the dashboard for the last 10 candles for M15-H1-H4… Full flexibility! Very easy to interpret... It gives a great idea about which currency is weak and which is strong, so you can find the best pai
The FFx Universal MTF alerter shows on a single chart all the timeframes (M1 to Monthly) with their own status for the chosen indicator. 9 indicators mode (MACD-RSI-Stochastic-MA-ADX-Ichimoku-Candles-CCI-PSAR). Each can be applied multiple times on the same chart with different settings. Very easy to interpret. Confirm your BUY entries when most of the timeframes are showing green color. And confirm your SELL entries when most of the timeframes are showing red color. 2 Alert Options : input to s
The FFx Watcher PRO is a dashboard displaying on a single chart the current direction of up to 15 standard indicators and up to 21 timeframes. It has 2 different modes: Watcher mode: Multi Indicators User is able to select up to 15 indicators to be displayed User is able to select up to 21 timeframes to be displayed Watcher mode: Multi Pairs User is able to select any number of pairs/symbols User is able to select up to 21 timeframes to be displayed This mode uses one of the standard indicators
FFx Patterns Alerter gives trade suggestions with Entry, Target 1, Target 2 and StopLoss .... for any of the selected patterns (PinBar, Engulfing, InsideBar, OutsideBar) Below are the different options available: Multiple instances can be applied on the same chart to monitor different patterns Entry suggestion - pips to be added over the break for the entry 3 different options to calculate the SL - by pips, by ATR multiplier or at the pattern High/Low 3 different options to calculate the 2 TPs -
Currency Index Watcher is a simple and user-friendly tool for whoever wish to trade Forex using currencies indexes. Currency Index Watcher is configurable and usable directly from the panel. Indexes of 8 custom currencies EUR, USD, GBP, JPY, CHF, AUD, CAD, NZD (default) Any 3-chars symbol from your market watch could be used (BTC = bitcoin, RUB = ruble, CNH = yuan etc ...) : double click the symbol label  Ability to select which currencies and made-of pairs will be analyzed : check/uncheck wante
MetaTrader 4 version available here: https://www.mql5.com/en/market/product/25793 FFx Pivot SR Suite PRO is a complete suite for support and resistance levels. Support and Resistance are the most used levels in all kinds of trading. Can be used to find reversal trend, to set targets and stop, etc. The indicator is fully flexible directly from the chart 4 periods to choose for the calculation: 4Hours, Daily, Weekly and Monthly 4 formulas to choose for the calculation: Classic, Camarilla, Fibonac
Forex Relative Performance indicator This indicator calculates the relative strength of major currencies against the US dollar. The basic idea behind this indicator is "to buy strong currency and to sell weak currency". This indicator allows you to quickly identify the best forex pair to trade according to your trading style (Intraday, Scalping, Swing, or Long Term)
プレミアムレベルは、正しい予測の精度が80%を超える独自の指標です。 この指標は、最高のトレーディングスペシャリストによって2か月以上テストされています。 あなたが他のどこにも見つけられない作者の指標! スクリーンショットから、このツールの正確さを自分で確認できます。 1は、1キャンドルの有効期限を持つバイナリーオプションの取引に最適です。 2はすべての通貨ペア、株式、商品、暗号通貨で機能します 手順: 赤い矢印が表示されたらすぐにダウントレードを開き、青い矢印が表示されたら閉じます。青い矢印の後に開くこともできます。 試してテストしてください!推奨設定はデフォルトです! 日足チャートで最高の精度を示します! インディケータは、2600 Pipsの収益性に対して、約10Pipsという非常に小さなマージンを使用します。
Indicador en base a la pendiente de la linea de precio, dibuja una línea de color cuando sube a base de los precios que previamente has sido procesados o linealizados, y cuando baja la pendiente la linea linealizada toma otro color. En este caso se a considerado 6 lineas de diferentes procesos desde pendientes largas hacia las cortas, observándose que cuando coincidan las pendientes se produce un máximo o mínimo, lo que a simple vista nos permitirá hacer una COMPRA O VENTA.
A scalping indicator based on mathematical patterns, which on average gives signals with relatively small SL, and also occasionally helps to catch big moves in the markets (more information in the video) This indicator has three main types of notifications: The first type warns of a possible/upcoming signal on the next bar The second type indicates the presence of a ready signal to enter the market/open a position The third type is for SL and TP levels - you will be notified every time price re
作者のその他のプロダクト
Nuage Trend Pro – トレンド追跡&Kijunシグナル Nuage Trend Pro は MetaTrader 5 用の高機能インジケーターで、 強い市場トレンド を素早く把握し、Kijunクロスを利用して 最適なエントリーポイント を見つけることができます。チャートを わかりやすいビジュアルマップ に変換し、 正確で自信のあるトレード をサポートします。 主な機能 自動Kijunクロス検出 :価格が基準線を横切る重要な瞬間を瞬時に表示。 動的トレンドクラウド :市場の方向に応じてチャートの色が変化。上昇は緑、下降は赤。 明確な買い/売りシグナル :エントリーポイントを素早く確認可能。 カスタマイズ可能な設定 :Kijun期間、クラウドの色、表示スタイルを戦略に合わせて調整可能。 Nuage Trend Proを選ぶ理由 シンプルで直感的なトレンド可視化 。 多用途 :すべての時間足や取引対象(FX、指数、商品)で使用可能。 初心者から上級者まで 、エントリー・エグジットの最適化に最適。 他のインジケーターや戦略との併用も容易 。
日本語 (Japonais) – Weekly Levels Pro Weekly Levels Pro – 週間主要レベル は MetaTrader 5 向けのシンプルかつ強力なインジケーターで、各取引週の最も重要な4つのレベルを自動的に表示します: 週間高値 (Weekly High) → 自然なレジスタンス 週間安値 (Weekly Low) → 自然なサポート 週間始値 (Weekly Open) → トレンドの基準点 週間終値 (Weekly Close) → 強気・弱気の指標 特徴: 新しい週の開始時に自動更新 チャート上で分かりやすく表示 主要なサポート・レジスタンスを迅速に特定 外国為替、株価指数、商品、暗号資産に対応 シンプルな設定 – 複雑な調整は不要
Pin Bar Pro v1.0 – MQL5 インジケーター 説明: Pin Bar Pro は MetaTrader 5 用のプロフェッショナルインジケーターで、 Pin Bar を自動検出します。市場反転を予測するのに便利です。 青い矢印 → 買いシグナル 赤い矢印 → 売りシグナル 特徴: Pin Bar の自動検出 カスタマイズ可能な矢印 ( Arrow_Up_Code , Arrow_Down_Code ) 垂直オフセット調整 ( Arrow_Offset_Pts ) すべてのシンボルとタイムフレームで使用可能 パラメータ: パラメータ 説明 デフォルト Arrow_Up_Code 買い矢印コード 233 Arrow_Down_Code 売り矢印コード 234 Arrow_Offset_Pts 垂直オフセット (ポイント) 10 作者: KOUAME N’DA LEMISSA バージョン: 1.0 – MQL5用
4. 日本語 (Japonais) インジケーター Monthly Levels + Pin Bar Pro 説明 Monthly Levels + Pin Bar Pro は、 月足の主要レベル(高値、安値、始値、終値) と プライスアクション反転パターン(ピンバー) の自動検出を組み合わせたインジケーターです。 テクニカルトレーダーや機関投資家向けに設計され、市場の反応ゾーンを予測し、チャート上に明確なシグナルを表示します。 主な機能 月次レベルを自動表示 :高値、安値、始値、終値。 ピンバー検出 (強気・弱気)リアルタイム。 視覚的にわかりやすい表示 :水平ライン + シグナル矢印。 ️ カスタマイズ可能 :タイムフレーム、矢印コード、サイズ、オフセット。 最適化済み :軽量、スキャルピングやスイング取引に最適。 ️ EA互換 :自動売買戦略に統合可能。 ️ 使い方 任意のタイムフレームのチャートに追加します。 月次の 高値、安値、始値、終値 が自動で表示されます。 矢印を確認: 青い矢印 → 強気ピンバー (月次サポー
6️⃣ 日本語 (Japanese) バージョン: 1.0 開発者: KOUAME N'DA LEMISSA プラットフォーム: MetaTrader 5 (MT5) タイプ: テクニカル指標 / 年間価格レベル 説明: Yearly Levels Pro v1.0はKOUAME N'DA LEMISSAによって開発され、年間の主要価格レベルを迅速に特定できる強力なインジケーターです。指定した年の 始値、最高値、最安値、終値 を自動計算し、チャート上に色付き水平線で表示します。 主な機能: High(赤)、Low(青)、Open(緑)、Close(オレンジ) Year_Shift で年を選択 全ての通貨ペア・タイムフレームに対応 リアルタイム自動更新 パラメータ: Year_Shift : 0 = 当年、1 = 前年、等 特徴: 直感的で簡単 年間のサポート/レジスタンスを特定 長期トレード分析に最適 使用のヒント: High/Lowラインでサポートとレジスタンスを確認 現在価格をOpen/Closeと比較してトレンド分析 他のインジケーターやローソク足パターンと併用
. Japanese Version (日本語) Quarterly Levels Pro v1.0 – 商業通知 製品名: Quarterly Levels Pro v1.0 開発者: KOUAME N'DA LEMISSA バージョン: 1.0 説明: Quarterly Levels Pro は KOUAME N'DA LEMISSA によって開発された MetaTrader 5 用のプロフェッショナルインジケーターで、四半期ごとの High, Low, Open, Close レベルを自動表示します。トレーダーはチャート上で重要なサポートおよびレジスタンスゾーンを明確に視覚化でき、中期取引の意思決定を容易にします。 主な機能: 四半期ごとの High, Low, Open, Close レベルを自動表示。 各レベルの色をカスタマイズ可能: High: 赤 Low: 青 Open: 緑 Close: オレンジ 線の幅を調整して視覚的に区別可能。 Quarter_Shift パラメータを使用して、 現在、前四半期、またはそれ以前の四半期 のレベルを表示可能。 MT5 のすべ
日本語 (Japonais) 説明 Multi-Timeframe Levels Pro v1.0 は、チャート上に自動的に 日足・月足・四半期・年足 の高値、安値、始値、終値を描画します。 重要なサポートやレジスタンス、ブレイクアウトゾーンを特定するのに最適です。 特徴 Daily / Monthly / Quarterly / Yearly のレベルを自動表示 高値・安値・始値・終値を色分け表示 過去の期間を分析するための Shift パラメータ FX、株式、指数、商品、暗号資産 に対応 軽量で高速、 プライスアクション、スイング、スキャルピング に最適 パラメータ DailyShift → 当日または前日 MonthlyShift → 当月または前月 QuarterlyShift → 当四半期または前四半期 YearlyShift → 当年または前年 推奨使用法 年足・四半期レベルで大きなゾーンを確認し、日足・月足レベルで短期取引に活用してください。
Commercial Description – Marubozu Pro (MT5) Description Marubozu Pro is a professional indicator for MetaTrader 5 that automatically detects Marubozu candles (bullish and bearish) directly on your chart. It helps traders identify strong market momentum where buyers or sellers take full control, by displaying clear visual arrows for buy and sell signals. This tool is designed to be simple, effective, and fast , perfect for manual trading or as a filter in automated strategies. Key Features
ETE Detector – Head & Shoulders Indicator Turn your charts into clear and actionable trading opportunities! About the Indicator The ETE Detector automatically identifies Head & Shoulders (H&S) and Inverse Head & Shoulders (IH&S) patterns — classic trend reversal formations. No more spending hours searching manually: your analysis becomes fast, accurate, and visual . What You Get Automatic detection of trend reversal patterns Colored arrows : green for buys (Inverse H&S), red for sell
Fusion Monthly Levels + PinBar + Marubozu 説明 このユニークなインジケーターは、3つの強力なテクニカル分析ツールを1つに統合しています: 月間レベル(High, Low, Open, Close) – 重要なサポート・レジスタンスゾーンを特定するため。 PinBar 検出 – 信頼性の高い反転ローソク足パターンで、価格の反発を示します。 Marubozu 検出 – 強いトレンドローソク足で、方向性のあるモメンタムを示します。 この融合により、 視覚的で包括的、かつ反応の速い 市場予測ツールを手に入れることができます。 利点 機関レベルの価格帯 + プライスアクションを組み合わせ。 明確な視覚シグナル:PinBar は青/赤の矢印、Marubozu は青/赤の四角で表示。 全ての資産で使用可能(FX、指数、暗号通貨、コモディティ、株式)。 カスタマイズ可能なパラメーター(参照期間、ヒゲのサイズ、矢印のスタイル)。 コード最適化済み、複数チャートでも遅延なし。 MetaTrader 5 完全対応。 シグナル ブルッシュ PinB
ABCD Lemissa + 月足レベル + ピンバー + マルボウズ 指標 説明 このインジケーターは、 複数の強力なツールを統合 して、市場の全体像を提供します。 ABCD Lemissa – ABCD構造 を自動検出し、 A、B、C、D のポイント、サポート/レジスタンスゾーン、買い/売り矢印を表示します。 月足レベル (Monthly Levels) – 月足ローソク足の High、Low、Open、Close レベルを表示し、重要なゾーンを特定します。 ピンバー & マルボウズ – ピンバー (反転シグナル)および マルボウズ (強トレンドローソク足)を自動検出し、カスタマイズ可能な矢印やシンボルを表示します。 このインジケーターは完全に 視覚的 で、ライン、矢印、矩形を組み合わせて、市場分析と取引判断をサポートします。 主な機能 ABCD Lemissa A、B、C、Dのポイントを自動検出 BUY および SELL シグナル矢印 X1 / X2 矩形でサポート・レジスタンスゾーンを強調 月足レベル 月足ローソク足の High、Low、Open、Close のライ
Order Block Pro (MQL5) – バージョン 1.0 作成者: KOUAME N'DA LEMISSA プラットフォーム: MetaTrader 5 説明: Order Block Pro は、チャート上の**強気および弱気のオーダーブロック(Order Blocks)**を自動で検出する高度なインジケーターです。小さな保ち合いローソク足と、その後の強いインパルスローソク足を分析することで、価格が加速する可能性のある重要なゾーンを特定します。 トレーダーに最適: 正確なエントリーとエグジットポイントを特定したい方。 動的なサポートおよびレジスタンスゾーンを把握したい方。 リスク管理と取引戦略を向上させたい方。 主な機能: 強気OB検出: 保ち合いローソク足の後、強い上昇が発生した場合、緑色の矢印で表示。 弱気OB検出: 保ち合いローソク足の後、強い下落が発生した場合、赤色の矢印で表示。 完全にカスタマイズ可能: 保ち合いローソク足の最大実体比率 ( BodyMaxRatio ) 次のローソク足の最小比率で動きを確認 ( NextCandleMinPct ) チャー
ETE Detector v4.0 (Head & Shoulders) Author: KOUAME N’DA LEMISSA Version: 4.0 Platform: MetaTrader 5 Indicator Type: Chart / Visual Trading Signals Overview The ETE Detector v4.0 is a technical indicator designed to automatically detect classic and inverse Head & Shoulders patterns (H&S) on MT5 charts. These patterns are widely used to anticipate trend reversals. With this tool, traders can: Detect sell signals (classic H&S) and buy signals (inverse H&S) with accuracy. Easily visualize patterns
Description – ETE DETECTOR POWER v5.0(ヘッド&ショルダープロ) 「ヘッド&ショルダー」パターンの自動検出 PUISSANCE DU DÉTECTEUR ETE v5.0 , トレーダーが 市場の大きな反転を事前に捉えるた めのプロ仕様ツールです。最も強力なチャートパターンの1つである ヘッド et ショルダー(H&S)と逆ヘッド&ショルダー を利用します. Description du produit (MaxObjects) 、混雑したチャートや複数時間枠でもスムーズかつ見やすく表示されます。 主な機能 リアルタイム自動検出: 通常H&S(売り) と 逆H&S(買い) Mots clés :  肩, 頭, ​​ネ ッ ク ラ イ ン 自動描画: 反転ゾーン (赤=売り、緑=買い) ACHETER/ VENDRE 循環オブジェクトプール によるスマート管理 完全カスタマイズ可能:ローソク本数、最小距離、許容差、最大パターン数、矩形スタイル、マーカーサイズ・色 トレーダーへの利点 時間節約:市場を自動分析 度:許容範囲調整
月次ハイ&ロー ダイナミックレンジ + 流動性ゾーン v1.2 作成者: KOUAME N'DA LEMISSA 説明: この強力なインジケーターで市場分析を変革しましょう。特徴は以下の通りです: 主要月次レベル: 高値(High)、安値(Low)、始値(Open)、終値(Close)で、最も重要なサポート・レジスタンスゾーンを特定。 ダイナミックハイ/ロー範囲: 価格の極端な動きを自動追跡し、重要な市場変動を検出。 流動性ゾーン: 流動性が集中するエリアを示す視覚的な矩形(Buy/Sell)。ゾーンの太さや色は完全にカスタマイズ可能で、チャート上での視認性を最大化。 全ての銘柄・ブローカー対応: Forex、株式、指数、暗号通貨で完璧に動作。 主な機能: 月次のHigh、Low、Open、Closeレベルを自動検出。 極端な動きを追跡するダイナミックハイ/ロー範囲の表示。 境界線の太さや色をカスタマイズ可能な視覚的流動性ゾーン。 すべてのタイムフレームに対応。 トレードスタイルに合わせて完全にカスタマイズ可能な設定。 インジケーター設定: Ref_Timeframe: レベル計算
Japonais (Japonais / 日本語) Booster Trading Pro par exemple  : KOUAME N'DA LEMISSA . 明 Trading de rappel Pro を使って市場分析を変革しましょう。複数のLa description de la situation est : Description du produit  : Il s'agit d'un article : ダイ ナミックオープニングレンジ : Nom du produit :  ダイナミックで色分けされた長方形で潜在的な買い・売りゾーンを視覚化。 主な特徴 すべての銘柄と時間軸に対応。 ダイナミックレベルを リアルタイム 更新. 柔軟なゾーン表示のために色や太さをカスタマイズ可能。 月次レベルとダイナミック範囲を明確に表示。 MetaTrader 5 est basé sur MetaTrader 5 . トレーダーへの利点 迅速な意思決定: 重要なゾーンを素早く特定可能。 Description du produit : Nom du produit  :
StructureBlocksAuto + MensuelOU 構造の力と月次精度の融合 Description: Fusion StructureBlocksAuto + MensuelOR は、市場構造(スイングの高値・安値、サポート・レジスタンスゾーン)を自動的に検出し、 月間オープンレンジ(MOR) と統合します。 プロのトレーダー向けに、 機関投資家レベルのゾーン と モメンタムブレイクアウト を視覚的に識別できます。 Nom : サポート/レジスタンスゾーンの自動検出 月足の高値・安値・始値・終値ライン オープンレンジのブレイクゾーン表示 遅延なしで軽量動作 すべての時間軸・通貨ペアに対応 カラー表示 : 赤 → サポートゾーン 青 → レジスタンスゾーン 緑 →月のオープン 赤 → 月の高値 青 → 月の安値 Produit : MetaTrader 5 . Titre: KOUAME N'da LEMISSA バージョン 1.1
Channel Ultima – Indicateur Multi-Canal Dynamique Description courte Channel Ultima est un indicateur avancé qui trace automatiquement trois canaux dynamiques du marché. Il offre une lecture claire des zones de support, de résistance et d'équilibre , idéale pour les traders techniques et structurels. Présentation détaillée Channel Ultima détecte et affiche trois canaux indépendants associés sur les pivots majeurs et mineurs du marché. Chaque canal représente une zone de pression sur le p
Carte de liquidité institutionnelle Pro Voyez ce que voient les institutions — avant tout le monde Aperçu Institutional Liquidity Map Pro est un indicateur professionnel conçu pour cartographier les zones de liquidité institutionnelle à l'aide des niveaux mensuels les plus hauts et les plus bas . Il détecte automatiquement les zones de stop-hunt , les zones de retournement potentiel et les zones d'accumulation/distribution institutionnelles . L'indicateur suit dynamiquement jusqu'à trois ni
フィルタ:
レビューなし
レビューに返信