WVAP Scalping


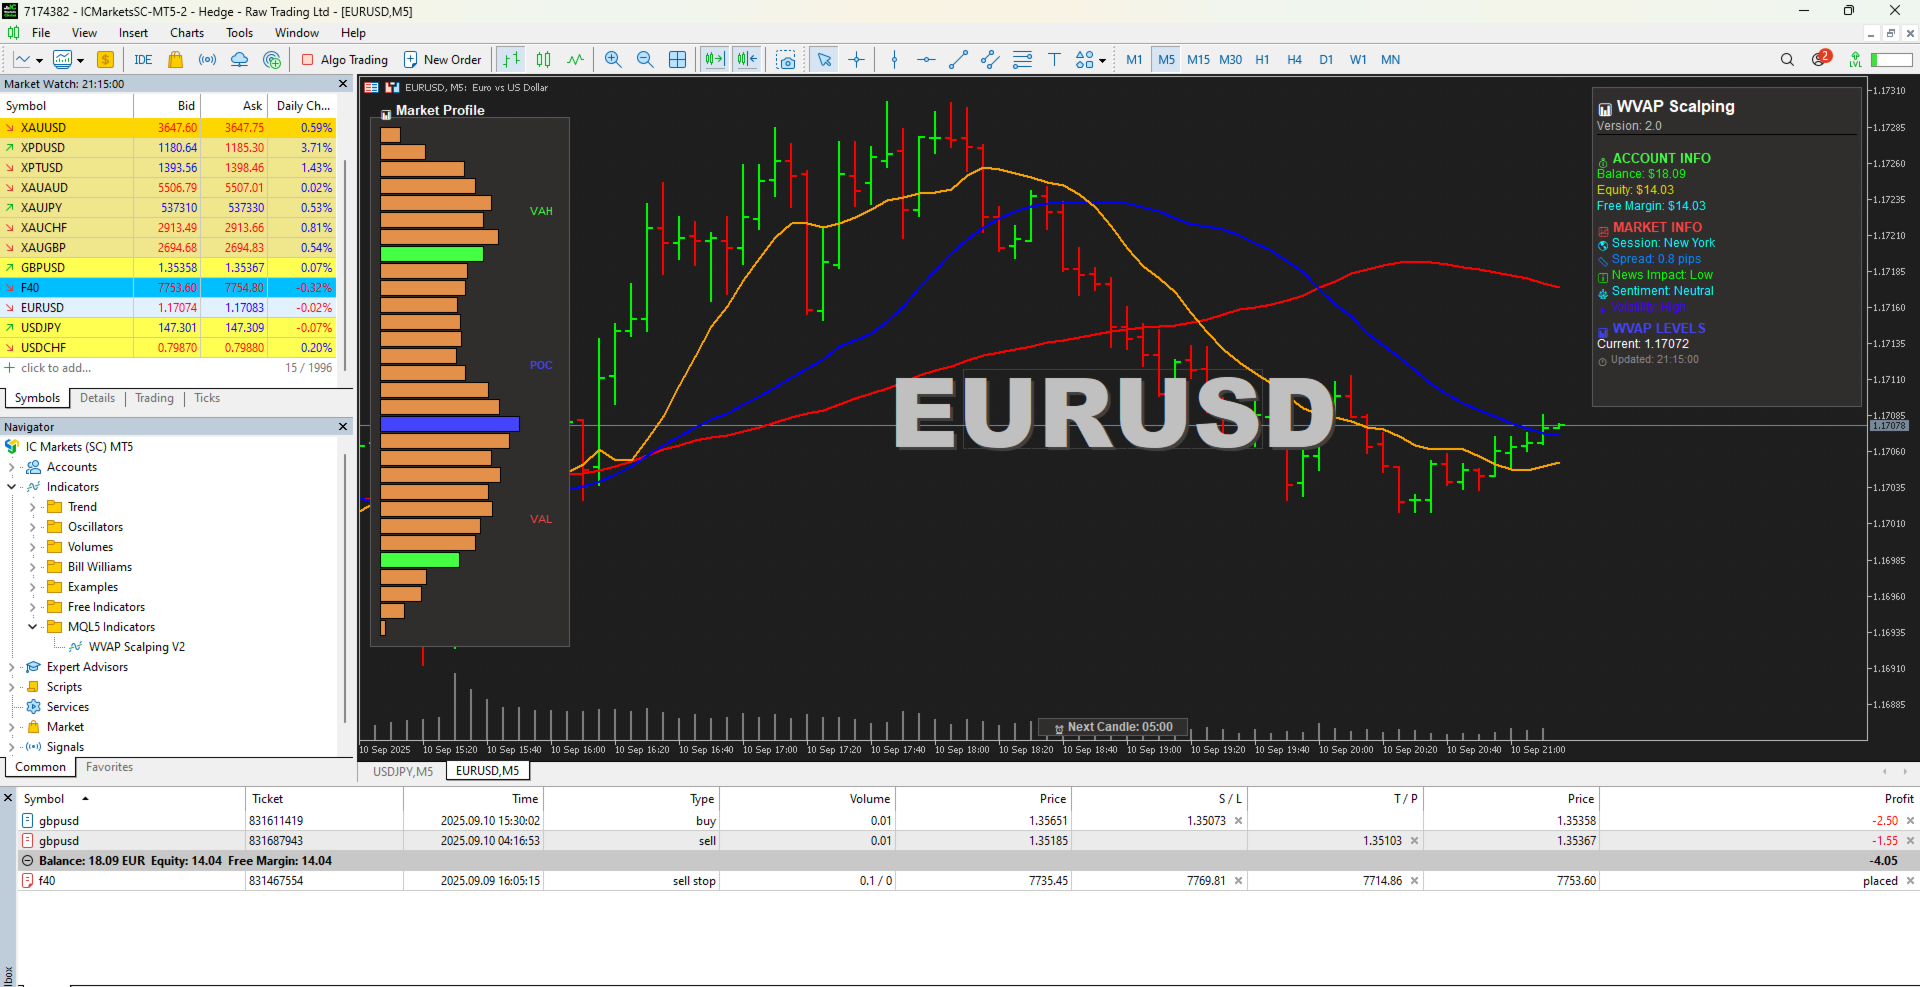
Professional-Grade VWAP + Market Profile Technology for Precision Trading

VWAP Scalping Pro is an advanced analytical tool that integrates Volume-Weighted Average Price (VWAP) analysis with professional Market Profile visualization.
It provides traders with institutional-style insights into price structure, volume distribution, and session dynamics — ideal for scalping, intraday, and swing trading strategies.

Key Features

Triple VWAP Strategy Framework

  • Trend VWAP (50) – Defines long-term directional bias

  • Supply VWAP (25) – Highlights selling pressure zones

  • Demand VWAP (10) – Identifies potential high-probability entry points

The system visually aligns all three VWAPs, helping traders identify confluence-based trading opportunities with greater precision.

Integrated Market Profile

  • Real-time volume distribution with clear Value Area (VAH, VAL) and Point of Control (POC) levels

  • Automatically calculated 70% Value Area based on volume

  • Clean and adaptive visual design suitable for all chart types and timeframes

Comprehensive Trading Dashboard

  • Real-time balance, equity, spread, and P&L display

  • Session indicators for Asia, London, and New York

  • Built-in economic calendar alerts (high, medium, low impact)

  • Smart VWAP-based sentiment analysis

  • Live market clock, volume profile levels, and connection monitor

Professional Design & Performance

  • Optimized for speed – lightweight and efficient, with no lag

  • Dark theme interface for professional environments

  • Multi-timeframe support (M1–D1)

  • Automatic detection of trend alignment and supply/demand conditions

Common Use Cases

  • VWAP bounce or breakout trading

  • Value Area rotation and reversal setups

  • POC and VAH/VAL-based structure plays

  • Session-to-session momentum analysis

Technical Specifications

  • Works with Forex, Indices, Commodities, and Crypto

  • Default parameters (fully customizable):

    • Trend VWAP: 50 periods

    • Supply VWAP: 25 periods

    • Demand VWAP: 10 periods

    • Market Profile: 100-bar lookback, 30 levels

Compatible with MetaTrader 5 on any timeframe (M1–D1).

Included Resources

  • Three professional strategy templates:
    Triple Confluence, Value Area Extremes, Session Momentum

  • Strategy guide with detailed examples of VWAP-based setups

User Feedback

“The Market Profile and VWAP integration improved my execution accuracy significantly.”
— Professional Day Trader

“Very clean interface and reliable performance. Excellent for institutional-style analysis.”
— Trading Desk Manager

Summary

VWAP Scalping Pro combines VWAP precision, Market Profile structure, and a real-time trading dashboard in one cohesive system.
It’s designed for traders who value analytical clarity, consistent execution, and a professional-grade workspace.

Bring institutional-style VWAP analysis to your MT5 terminal.
Download VWAP Scalping Pro and elevate your trading workflow today.

Would you like me to make it SEO-optimized for the MQL5 Market (with keyword density and formatting) next? That version can help it rank higher in MQL5 search results.

おすすめのプロダクト
A Heatmap with a Volume Profile is like a thermal imager or x-ray machine. It will help you to estimate the relative distribution of volume during the price movement and to understand  the relationship between volume and price. Indicator Volume Profile "Volumos Maxima" is a powerful tool for analyzing this relationship. After simple experimentation with heatmap, you can find that each trading instrument has its own “ characteristic ” way of distributing volume. And this will help you to make a b
インディケータは現在のクオートを作成し、これを過去のものと比較して、これに基づいて価格変動予測を行います。インジケータには、目的の日付にすばやく移動するためのテキスト フィールドがあります。 オプション: シンボル - インジケーターが表示するシンボルの選択; SymbolPeriod - 指標がデータを取る期間の選択; IndicatorColor - インジケータの色; HorisontalShift - 指定されたバー数だけインディケータによって描画されたクオートのシフト; Inverse - true は引用符を逆にします。false - 元のビュー。 ChartVerticalShiftStep - チャートを垂直方向にシフトします (キーボードの上下矢印)。 次は日付を入力できるテキストフィールドの設定で、「Enter」を押すとすぐにジャンプできます。
The market is unfair if only because 10% of participants manage 90% of funds. An ordinary trader has slim changes to stand against these "vultures". This problem can be solved. You just need to be among these 10%, learn to predict their intentions and move with them. Volume is the only preemptive factor that faultlessly works on any timeframe and symbol. First, the volume appears and is accumulated, and only then the price moves. The price moves from one volume to another. Areas of volume accumu
このインジケーターは、離散ハートレー変換に基づいています。この変換を使用すると、財務時系列を処理するときにさまざまなアプローチを適用できます。このインジケーターの特徴は、その読み取り値がチャート上の1つのポイントではなく、インジケーター期間のすべてのポイントを参照していることです。 時系列を処理する場合、インジケーターを使用すると、時系列のさまざまな要素を選択できます。フィルタリングの最初の可能性は、このアプローチに基づいています。不要な高周波成分はすべて単に破棄されます。最初の図は、この方法の可能性を示しています。CutOffパラメーターを選択すると、元の時系列の詳細を選択できます(赤い線-主要な情報のみが残りますCutOff = 0、黄色-主要な最低周波数期間CutOff = 1 、青-最も高周波のノイズはすべて破棄されますCutOff = 4)。ただし、これが唯一の可能性ではありません。ノイズ成分は、追加のフィルタリングで抑制できます。 このインジケーターには両方のオプションが実装されています。そのパラメータは次のとおりです。 iPeriod-インジケーター期間 Shift-現
KT Volume Profile は、取引量の蓄積データをY軸上にヒストグラムとして表示するインジケーターです。指定された時間範囲や価格帯におけるトレーディングアクティビティを視覚的に把握することが可能です。 Volume Profile における POC(ポイント・オブ・コントロール) POC は、プロファイル全体の中で最も取引量が多かった価格レベルを示します。この価格帯はサポートやレジスタンスとして、また価格が方向転換前に再度試す重要なレベルとして使われることが多いです。 特徴 非常に簡単に使えます。チャート上で四角形をドラッグ&ドロップするだけで、リアルタイムでボリュームプロファイルが更新されます。 価格がPOCを越えたときにアラートを出すことが可能です。 ゼロから設計され、CPUとメモリの使用を最小限に抑えています。 入力パラメーター ボリュームソース:   ティックボリューム / 実際の取引量。 プロファイルの色:   ヒストグラムの表示色。 ボックスの幅:   四角形の横幅。 ボックスの色:   四角形の色。 POC を表示:   true/false POCの色:
Trade Like an Institution. Protect Like a Professional. Early Sniper Access: Limited Launch Offer! Get ready to elevate your trading precision. We are offering an exclusive, highly limited launch price for the first Dynamic Trend Sniper users. Our Unbeatable Launch Offer: First 10 Snipers Only: $69 (Full lifetime access + all v1.x updates) Standard Retail Price (After 10 Purchases): $129 Why Act Now? This is not just a discount; it's a strategic entry point. We are committed to rewarding
DRX Market Profile Master v4 — MetaTrader 5向け機関投資家レベルのMarket Profile Market ProfileおよびTime Price Opportunity(TPO)分析は、市場の本質的な構造を理解するための最も効果的な手法の一つです。 DRX Market Profile Master v4は、この手法をMetaTrader 5に完全に実装し、プロフェッショナルな取引プラットフォームに匹敵する機能を提供します。 このインジケーターは各セッションごとに、価格が受け入れられたゾーン(Value Area)、最も取引が集中した価格(Point of Control)、そして市場が迅速かつ一方向に通過したゾーン(Single Prints)を自動的に計算します。 これらの情報は、精度の高いエントリーおよびエグジット判断の基盤となります。   How does that work? セッションタイプと履歴表示 このインジケーターは、時間別、日次、週次、月次、およびカスタムの5種類のセッションタイプをサポートしています。最大20の履歴セ
The "MR Volume Profile 5" indicator is a charting tool that displays trading volume at different price levels rather than time intervals. A key concept in volume profile is the point of control (POC)—the price level with the highest volume traded during the session or time range. While tools like VWAP or OBV provide volume trends, the "MR Volume Profile 5" indicator offers granular detail about where the most market activity occurs at specific price levels. This makes it a more precise tool for
Was: $299  Now: $99  Supply Demand uses previous price action to identify potential imbalances between buyers and sellers. The key is to identify the better odds zones, not just the untouched ones. Blahtech Supply Demand indicator delivers functionality previously unavailable on any trading platform. This 4-in-1 indicator not only highlights the higher probability zones using a multi-criteria strength engine, but also combines it with multi-timeframe trend analysis, previously confirmed swings a
Market Profile Heat indicator  — is a classic Market Profile implementation that can show the price density over time, outlining the most important price levels, value area, and control value of a given trading session. This indicator can be attached to timeframes between M1 and D1 and will show the Market Profile for daily, weekly, monthly, or even intraday sessions. Lower timeframes offer higher precision. Higher timeframes are recommended for better visibility. It is also possible to use a fr
Efficient Market Profile Professional Market Profile analysis directly on your MetaTrader 5 charts. Efficient Market Profile allows traders to visualize market structure, fair value zones, and institutional price levels using the powerful Market Profile methodology . The indicator automatically builds TPO-based profiles for each trading session , helping you quickly identify where the market spent the most time and where important price levels are forming. All elements adjust dynamically to your
Fox Wave PSAR – PSAR Dashboard for Multiple Symbols and Timeframes Description: Fox Wave PSAR is a powerful indicator for MetaTrader 5 that allows you to monitor the Parabolic SAR (PSAR) across multiple symbols and timeframes directly in a clear and convenient dashboard. It is ideal for scalping, intraday, and long-term trading strategies. Key Features: Clear dashboard with a list of symbols and their current PSAR status. Supports any number of symbols and customizable suffixes (e.g., ".m"). Di
Volume Profile Pro Signals  精密な出来高分析と自動シグナル生成の統合。 機能概要 Volume Profile Pro Signals は、どの価格帯に実際の取引ボリュームが集中しているかをデータに基づきリアルタイムで可視化します。POC、VAH、VAL を強調表示し、HVN/LVN エリアも正確に識別します。これに基づき VAH/VAL のブレイクアウトをリアルタイムで検出し、ATR に基づく賢い SL/TP をプロットします。 プロファイルの解像度からアラート種別まで、すべての要素をトレードスタイルに合わせて細かく調整可能です。短期スキャルピングから複数日をまたぐポジショントレードまで対応します。 主な特徴 Price-by-Volume の視覚化:MT5 チャート上で Point of Control と Value Area を直接表示。 ブレイクアウトアラート:価格が VAH を上抜け、または VAL を下抜けた際に即時通知。 適応型リスクレベル:ATR に基づく自動 SL/TP 設定。 スマートフィルタ:EMA トレンドフィルタや POC 傾
Do you use volume in your reading of the market? Certainly many traders use it, and do not imagine operating without it. The Color Histogram Volume Set indicator allows the user to choose the value that he considers interesting to monitor. When you pass this you will have visual confirmation and if you want you will also have the audible alert that is given by the indicator. Of course, there are other ways to try to find a high volume, such as assessing whether the volume is above av
Breakout Boxes with Volume Pressure This indicator automates the identification of key consolidation zones (Supply and Demand) based on Market Pivots and Volatility (ATR). Unlike standard support/resistance tools, this indicator provides a unique   Volume Pressure Analysis   inside every box, giving you insight into the battle between Buyers and Sellers before a breakout occurs. Key Features Automated Supply & Demand Zones:   Automatically detects significant Pivot Highs and Lows to draw dyna
Atlantis Pro Indicator — ティック単位の市場分析とポートフォリオ戦略を両立 Atlantis Pro Indicator は、リアルタイムのティックデータを駆使して、重要な価格帯と高確率の反転ゾーンを高い精度で捉える多機能インジケーターです。市場のすべてのティックを連続的に解析し、買い/売り圧力の転換点を正確に見極め、チャート上に鮮明な Buy/Sell の矢印を即座に表示 — デフォルトで可視化され、すぐに行動可能です。 Atlantis Pro は あらゆる時間足・銘柄 に対応し、FX、株式、商品、指数、暗号資産など幅広く活用可能です。本当の強みは複数銘柄を 同時に監視・活用 できること。複数のシンボルで最適なエントリー・イグジットを同時に捉え、 分散ポートフォリオ を構築してリスクを分散し、安定した利益を目指せます。 単一のチャートや銘柄に縛られず、相関性のある・ない市場を横断してシグナルをキャッチすることで、自然なヘッジが効き、利益のブレを抑制。マルチ銘柄対応で、より精度の高いポートフォリオ収益を確保し、市場の変動にも揺らがない安定性を支えます。 スキャ
Was: $249  Now: $99   Market Profile defines a number of day types that can help the trader to determine market behaviour. A key feature is the Value Area, representing the range of price action where 70% of trading took place. Understanding the Value Area can give traders valuable insight into market direction and establish the higher odds trade. It is an excellent addition to any system you may be using. Inspired by Jim Dalton’s book “Mind Over Markets”, this indicator is designed to suit the
Rolling vwap atr market panel
Florian Alain Bernard Jean-paul Pierre Cuiset
Rolling VWAP + ATR Bands + Market Panel — powerful visual tool for scalping, extensions detection and intraday market structure analysis. Rolling VWAP + Panel Rolling VWAP + Panel is a professional MetaTrader 5 indicator designed to analyze market structure using a Rolling Volume Weighted Average Price (VWAP) combined with ATR-based volatility bands , a real-time market analysis panel , and an integrated candle countdown timer . This indicator provides a clear and structured view of price beha
FREE
Buyer Seller Arrows – 自信を持ってトレード! すべてのタイムフレーム(M1 から MN1 まで)で、買い手と売り手の力を直感的に分析できる革新的なツールです。色分けされたパーセンテージと矢印によって、 市場のダイナミクスを瞬時に把握 できます。 主な機能: 緑の上向き矢印 = 買い手優勢 赤の下向き矢印 = 売り手優勢 各タイムフレーム (M1, M5, M15, M30, H1, H4, D1, W1, MN1) における パーセンテージ強度 カラーコード による素早い識別(鮮やかな緑と赤) 動作原理: 買い圧力と売り圧力のバランス を追跡 EMA と SMA を用いて強度を計算 リアルタイムでトレンドの優勢 を表示 理想的なエントリーとエグジットポイント を特定するサポート トレーダーに選ばれる理由: 非常に分かりやすいビジュアル – 複雑なチャート不要、純粋な市場の強さを表示 迅速な意思決定 – スキャルピングやスイングトレードに最適 完全にカスタマイズ可能 – 自分のトレードスタイルに合わせてパラメータを調整 他のインジケーターとの
Daily & Composite Volume Profile   This is a professional-grade market profile tool designed for MetaTrader 5. It utilizes a   Dual-Profile System   to visualize supply, demand, and liquidity concentrations. Key Features Left Side: Daily Session Profiles Automatically identifies the start and end of every trading day. Generates a unique Volume Profile for each individual day. Allows you to see how value migrated from yesterday to today (e.g., Is today's volume higher or lower than yesterday?).
11 Modules Description & Final Analyzer Trading Guide 1. Reaction Engine 2.0 Purpose : Measures market pressure by analyzing tick movements, volume, and speed within a time window.   How it works : Calculates weighted price changes, considers tick velocity and volatility, and applies EMA smoothing.   Trading use : Strong positive values indicate buying pressure Strong negative values indicate selling pressure Use as confirmation for entry/exit signals 2. Flow Pattern Detector Purpose : Identifie
This Volume Delta Profile is an advanced MetaTrader 5 indicator that visualizes   volume delta (order flow imbalance)   using a volume profile-style histogram. It shows the difference between buying and selling pressure at specific price levels, helping traders identify supply and demand zones. This indicator provides a unique perspective on market dynamics by visualizing the imbalance between buying and selling pressure, offering insights beyond traditional volume analysis. Core Concept Positiv
This indicator allows you to enjoy the two most popular products for analyzing request volumes and market deals at a favorable price: Actual Depth of Market Chart Actual Tick Footprint Volume Chart This product combines the power of both indicators and is provided as a single file. The functionality of Actual COMBO Depth of Market AND Tick Volume Chart is fully identical to the original indicators. You will enjoy the power of these two products combined into the single super-indicator! Below is
Quantum Levels PRO — 価格の行き先を、到達する前に知る MT5 ノーリペイント価格ターゲットインジケーター | バージョン 3.10 インジケーターの90%が抱える問題: すでに起こったこと しか表示しません。移動平均、RSI、MACD——これらは過去のデータを分析し、値動きが終わった 後 に反応します。シグナルが出る頃には、最適なエントリーポイントは過ぎ去っています。 Quantum Levels PROは違います。 値動きがまだ進行中の段階で、価格が次に向かう具体的な水準——正確な価格ターゲットを算出します。旅が終わる前に目的地が見えます。これは後知恵ではなく、先見性です。 Quantum Levels PROの機能 あらゆる銘柄——株式、FX、暗号資産、コモディティ、指数——のスイング構造を分析し、4つの精密な価格ターゲットを算出します: UP Trend Target ——最大上昇水準。ロングの利確目標、またはショートの反転エントリー。 UP Correction Target ——最小上昇水準、保守的な上昇目標。ロングの部分決済ゾーン。 DOWN Tren
The MarketProfileTPO indicator for MetaTrader 5 is a powerful tool designed to bring the Market Profile concept, based on Time Price Opportunity (TPO) analysis , directly onto your main chart window. This indicator calculates and displays the price distribution over a specified period, highlighting key areas of market activity and concentration. It is particularly optimized for high-volatility instruments like NAS100, US30, and XAUUSD when used on the M1 (1-minute) timeframe, offering a detailed
メタトレーダー用ボリュームプロファイルインジケーターで、ボリューム分析の威力を実感してください! /   MT4バージョン ベーシックボリュームプロファイルは、取引の最適化を目指すマニュアルトレーダーのために特別に設計されたインジケーターです。ボリューム・プロファイル・インジケータは、市場の動きをより深く理解したい本格的なトレーダーにとって不可欠なツールです。当社の革新的なソリューションにより、取引量が価格にどのように分布しているかを明確かつ簡潔に視覚化することができます。これにより、支持線・抵抗線、集積・分配ゾーン、重要なコントロール・ポイントなど、主要な注目エリアを特定することができます。特定の日の取引量を表示する通常の出来高インジケーターとは異なり、ベーシック・ボリューム・プロファイルは特定の価格における取引量を表示します。 当社のインジケータは、直感的でカスタマイズ可能なインターフェイスを備えており、お客様の取引の好みに合わせてカスタマイズすることができます。 特徴 価格チャート上に出来高プロフィールを明確に表示。 出来高の多いエリアと少ないエリアを素早く識別。 取引ス
Description: The Volume Profile displays detailed informations of historical trading activities at certain price levels (Market Profile). Locate the areas with the best prices in the market and get an advantage over other market participants. Features: Customizable Market Profile Shows the "fair" Value Area with 70% of all Volume Shows critical low volume zones Shows VPOC, VAL and VAH Points integrated resource management to reduce the load while working with multiple charts Works on all timefr
Haven Volume Profileは、取引量の分布に基づいて重要な価格レベルを識別するための多機能なボリュームプロファイル分析インジケーターです。市場をより深く理解し、重要なエントリーポイントとエグジットポイントを特定したいプロのトレーダー向けに設計されています。 その他の製品 ->  こちら 主な機能: Point of Control (POC) 計算 - 最大の取引活動が行われるレベルで、最も流動性の高いレベルを特定するのに役立ちます Value Area(高い活動の領域)の定義とカスタマイズ可能な取引量の割合で、取引範囲をより正確に評価できます ティックボリュームと実際の取引量の両方に対応し、さまざまな市場タイプや取引戦略に対応しています 計算期間(日数)の柔軟な設定により、任意の時間枠にツールを適応させることができます ターミナルのライトテーマとダークテーマに自動的に適応し、ユーザーインターフェースの視覚的な体験を向上させます レベルの視覚化が明確で、スタイルや色をカスタマイズでき、グラフ分析と迅速な意思決定を支援します このインジケーターは、重要な価格レベルや統合ゾー
FREE
1.       Overview The Volume Pressure Histogram (VPH) is a custom indicator for MetaTrader 5 (MT5) that measures buying and selling pressure based on tick or real volume. It highlights extreme buying/selling moments and provides a smoothed signal line for trend detection. 2.       Indicator Components ·          Volume Pressure Histogram (Colored): o    Green: Extreme buying pressure o    Lime: Buying pressure o    Red: Extreme selling pressure o    Yellow: Selling pressure ·          Signal Li
Volume Analysis Trader looks at volume using a fixed average of volume. This averaging helps spot when volume is rising or declining. Also I have added volume spikes which are when volume suddenly is above the average. These help spot market reversals. This will hep a trader look for the following in their trading: Rising volume during a rally shows trend is strong. Falling volume on a rally shows trend is weakening. As a rule of thumb on daily charts if current volume is higher than yesterda
このプロダクトを購入した人は以下も購入しています
Azimuth Pro
Ottaviano De Cicco
5 (6)
発売プロモーション Azimuth Proは先着100名様限定で 299ドル でご提供します。最終価格は 499ドル となります。 リテールとインスティテューショナルのエントリーの違いはインジケーターではなく、ロケーションにあります。 多くのトレーダーは、モメンタムを追いかけたり、遅行シグナルに反応して、任意の価格レベルでエントリーします。機関投資家は、需給が実際にシフトする構造的なレベルに価格が到達するのを待ちます。 Azimuth Proはこれらのレベルを自動的にマッピングします:スイングアンカーVWAP、マルチタイムフレーム構造ライン、高確率ロケーションにのみ出現するABCパターン。 Azimuth Proは、構造分析とインテリジェントな自動化の両方を求めるプロフェッショナルトレーダー向けに構築されています。 Azimuthが外科的精度で市場構造をマッピングする一方、Azimuth Proはインテリジェンスレイヤーを追加します:トレーディングスタイルの自動検出、スマート設定された移動平均線、20年のデータでバックテストされた最適化パラメータ。その結果、お使いの銘柄と
OmniSync Projection
Antonio-alin Teculescu
5 (1)
Chronos Fractal Engine is an innovative price projection indicator for MetaTrader 5, designed to transform your technical analysis by intelligently identifying and projecting historical price patterns. Built upon an advanced correlation algorithm and the fractal principles of the market, this powerful tool visualizes potential future price movements, giving you a unique edge in your trading decisions. What is Chronos Fractal Engine? At its core, the Chronos Fractal Engine employs a sophisticat
RelicusRoad Pro: 定量的市場オペレーティングシステム 【期間限定】無制限アクセス 70% OFF - 2,000人超のトレーダーと共に なぜ多くのトレーダーは「完璧な」インジケーターを使っても失敗するのでしょうか? それは、文脈を無視して 単一の概念 だけでトレードしているからです。文脈のないシグナルは単なるギャンブルです。勝ち続けるには、 根拠の重なり(コンフルエンス) が必要です。 RelicusRoad Proは単なる矢印インジケーターではありません。完全な 定量的市場エコシステム です。独自のボラティリティモデリングを用いて、価格が推移する「適正価値の道(Fair Value Road)」をマッピングし、ノイズと真の構造的ブレイクを判別します。 推測はやめましょう。機関投資家レベルの「ロード・ロジック」でトレードを。 コアエンジン:「Road」アルゴリズム システムの中心となる Road Algo は、市場環境にリアルタイムで適応するダイナミックなボラティリティチャネルです。 安全ライン(平衡点) と、価格が数学的に反転しやすい 拡張レベル を投影します。 Si
ARIPoint is a powerful trading companion designed to generate high-probability entry signals with dynamic TP/SL/DP levels based on volatility. Built-in performance tracking shows win/loss stats, PP1/PP2 hits, and success rates all updated live. Key Features: Buy/Sell signals with adaptive volatility bands Real-time TP/SL/DP levels based on ATR Built-in MA Filter with optional ATR/StdDev volatility Performance stats panel (Success, Profit/Loss, PP1/PP2) Alerts via popup, sound, push, or email Cu
Ultimate SMC Indicator
Hicham Mahmoud Almoustafa
1 (1)
Ultimate SMC PRO – Smart Money Concepts Indicator (Order Blocks, FVG, Liquidity, BOS) for MetaTrader 5  Ultimate SMC PRO is a professional trading indicator designed to visualize Smart Money Concepts directly on the chart. The indicator combines several institutional trading tools in one system to help traders identify potential high-probability trading zones. ULTIMATE SMC INDICATOR — COMPLETE TRADING GUIDE +   SMC Bridge The indicator analyzes market structure, liquidity behavior an
AriX
Temirlan Kdyrkhan
1 (4)
AriX Indicator for MT5 A powerful trend-following and signal-evaluation tool AriX is a custom MT5 indicator that combines Moving Averages and ATR-based risk/reward logic to generate clear buy/sell signals. It visualizes dynamic SL/TP levels, evaluates past trade outcomes, and displays win/loss statistics in a clean on-chart panel. Key features include: Buy/Sell signals based on MA crossovers ATR-based SL/TP1/TP2/TP3 levels with visual lines and labels Signal outcome tracking with real-time stat
マーケットメーカーのためのツール。 Meravith は次の機能を提供します: すべての時間足を分析し、現在有効なトレンドを表示します。 強気と弱気の出来高が等しくなる流動性ゾーン(出来高均衡)を強調表示します。 異なる時間足のすべての流動性レベルをチャート上に直接表示します。 テキスト形式の市場分析を生成し、参考情報として表示します。 現在のトレンドに基づいて目標値、サポートレベル、ストップロスを計算します。 取引のリスクリワード比を算出します。 口座残高に基づいてポジションサイズを計算し、潜在的な利益を推定します。 また、市場に大きな変化があった場合には警告を表示します。 インジケーターの主要ライン: 強気/弱気の出来高エグゾーストライン ― 目標値として機能します。 市場のトレンドを示すライン。市場が強気か弱気かによって色が変わり、トレンドのサポートとして機能します。主にその色が市場センチメントを示します。 出来高均衡ライン(Eq)。Eq(Volume Equilibrium)ラインはシステムの中核です。これは買い手と売り手の出来高のバランスポイントを表します。市場の流動性を示し
まず第一に、この取引ツールはノンリペイント、ノンリドロー、ノンラグの指標であり、プロの取引に理想的ですことを強調する価値があります。 オンラインコース、ユーザーマニュアル、デモ。 スマートプライスアクションコンセプトインジケーターは、新米から経験豊富なトレーダーまで、非常 に強力なツールです。Inner Circle Trader AnalysisやSmart Money Concepts Trading Strategiesなど、20以上の有用な指標を1つに組み合わせています。このインジケーターはスマートマネーコンセプトに焦点を当て、大手機関の取引方法を提供し、彼らの動きを予測するのに役立ちます。 特に、流動性分析に優れており、機関がどのように取引しているかを理解しやすくしています。市場のトレンドを予測し、価格の動きを慎重に分析するのに優れています。機関の戦略とトレードを合わせることで、市場の動向についてより正確な予測ができます。このインジケーターは多目的であり、市場構造を分析し、重要な注文ブロックを特定し、さまざまなパターンを認識するのに優れています。 このインジケーター
ZIVA Signal Intelligence
Hassan Abdullah Hassan Al Balushi
ZIVA Signal Intelligence An Adaptive, Modular Market Intelligence System ZIVA Signal Intelligence is not positioned as a conventional trading indicator. It is a fully integrated, proprietary market intelligence system engineered to deliver structured, high-precision interpretation of price behavior within a controlled analytical environment. Developed through an independent architectural approach, ZIVA does not rely on, derive from, or replicate existing indicators. It represents a standalone
Ace Trend
Mikhail Sergeev
5 (3)
私たちはあなたにトレンド取引の世界でゲームのルールを変える革命的な指標を提示します。 指標は、パフォーマンスを再考し、前例のない高さにあなたの取引経験を高めるように設計されています。 私たちの指標は、競合他社とは一線を画す高度な機能のユニークな組み合わせを誇っています。 "実質の価格設定要因"の先端技術は最も困難で、揮発市況の最高の安定性を保障する。 不安定なパターン、壊れた指標に別れを告げ、意識的で制御された取引を歓迎します。 指標は単なる美しい絵ではありません! 指標は、トレーダーの側にオッズをシフトし、それによって利益を得る必要があります。 インジケータ信号(完全自動モード)に基づいて取引結果に慣れる: https://www.mql5.com/ja/signals/2339244 AceTrendは、rbtiバージョンによるトレンド指標のランキングで第一位にランクされています。AceTrend-取引における最大の収益性と制御。 私たちの指標は、歴史ではなく、現在の市場相場に基づいて収益性を強調しています。 革命に参加-あなたの取引経験の可能性のロックを解除! インジケーターは、
「 Dynamic Scalper System MT5 」インジケーターは、トレンド波の中でスキャルピング取引を行う手法のために設計されています。 主要通貨ペアと金でテスト済みで、他の取引商品との互換性があります。 トレンドに沿った短期的なポジションオープンのシグナルを提供し、追加の価格変動サポートも提供します。 インジケーターの原理 大きな矢印はトレンドの方向を決定します。 トレンド波の中では、小さな矢印の形でスキャルピングシグナルを生成するアルゴリズムが機能します。 赤い矢印は強気方向、青い矢印は弱気方向です。 トレンドの方向には敏感な価格変動ラインが描かれ、小さな矢印のシグナルと連動します。 シグナルは次のように機能します。適切なタイミングでラインが現れるとエントリーシグナルが形成され、ラインが開いている間はポジションが保持され、完了すると取引が終了します。 推奨される動作時間枠はM1~H4です。 矢印は現在のローソク足に形成され、次のローソク足が開いている場合は、前のローソク足の矢印は再描画されません。 入力パラメータ Trend Wave Period - トレ
Introduction to X3 Chart Pattern Scanner X3 Cherart Pattern Scanner is the non-repainting and non-lagging indicator detecting X3 chart patterns including Harmonic pattern, Elliott Wave pattern, X3 patterns, and Japanese Candlestick patterns. Historical patterns match with signal patterns. Hence, you can readily develop the solid trading strategy in your chart. More importantly, this superb pattern scanner can detect the optimal pattern of its kind. In addition, you can switch on and off individu
このインジケーターは実践的なトレードに最適な自動波動分析のインジケーターです! 場合... 注:   Tang Lun (Tang Zhong Shuo Zen) の命名規則の影響で、私は波のグレーディングに西洋の名前を使用することに慣れていません。基本的な波を ペン 、二次波のバンドを セグメント と名付けました。同時に、 セグメント にはトレンドの方向が指定されます (この命名方法は将来のノートで使用されます。最初に言っておきます)。ただし、アルゴリズムは曲がりくねった理論とはほとんど関係がないため、付けるべきではありません。これは、私の市場分析 によって要約された、絶えず変化する複雑な運用ルール を反映しています。 バンドは標準化され、人によって異なることがないよう定義されており、市場参入を厳密に分析する上で重要な役割を果たす人為的な干渉の描画方法が排除されています。 このインジケーターを使用することは、取引インターフェイスの美しさを改善することと同等であり、元の K ライン取引を放棄し、取引の新しいレベルに連れて行きます。また、宣伝の観点から顧客の認識も向上します。 イ
GEM Signal Pro GEM Signal Pro は、MetaTrader 5 向けのトレンドフォロー型インジケーターです。より明確なシグナル、より整理されたトレードセットアップ、そして実用的なリスク管理をチャート上で確認したいトレーダーのために設計されています。 単純な矢印だけを表示するのではなく、GEM Signal Pro はトレード全体の考え方を、より見やすく分かりやすい形で表示します。条件が確認されると、インジケーターはエントリー価格、ストップロス、利確目標をチャート上に表示し、トレードセットアップをより効率的に確認できるようにします。 動作の仕組み このインジケーターは、まず内部ロジックに基づいて有効なシードシグナルを検出します。 確認条件が満たされると、GEM Signal Pro はチャート上に完全なセットアップを表示します。これにより、トレーダーはトレード構造をより明確に把握し、手作業による分析を減らすことができます。 チャート上のトレードレベル 確認済みシグナルに対して、GEM Signal Pro は以下を表示できます。 エントリー価格 ストップロス テ
この位置が買いに適しているかどうかの判断をサポートします。 この位置が売りに適しているかどうかの判断をサポートします。 4つの指標が同時に底に達した場合は、反発のチャンスに注目してください。 4つの指標が同時に天井付近にある場合は、下落のチャンスに注目してください。 本システムは、中国の先進的なアルゴリズム技術と高度な数学モデリング体系に基づいて構築されています。 私は主に XAUUSD M5 でこの指標を使用しており、この時間足が最も良い結果を示します。 この指標のアルゴリズムと数式は非常に複雑なため、テスト時に動作が遅くなる場合があります。テストでは、リペイントの有無と遅れの有無を確認してください。正式版では実際の使用時により安定します。 この指標システムはリペイントせず、未来データも使用しません。ご購入前にご自身でテストしてご確認いただけます。 この指標には完全にカスタマイズ可能なアラートシステムが搭載されており、以下のリンクからご確認いただけます。 正式に使用する前に、完全な使用説明を十分にお読みください。 ご不明な点がございましたら、どうぞお早めにご連絡ください。できるだけ早
OrderFlow Absorption – MT5用プロフェッショナル・デルタ&アブソープションシグナルインジケーター OrderFlow Absorptionで本物のオーダーフロー分析の力を解き放ちましょう。MetaTrader 5向けの究極のデルタヒストグラム&アブソープションシグナルインジケーターです。あらゆる価格変動の裏側で何が起きているのかを知りたいトレーダーのために設計されており、市場を動かす隠れた買い/売り圧力や吸収イベントを明らかにします。 特徴 デルタヒストグラムの可視化:   買い圧力・売り圧力を色分けされたヒストグラムで即座に表示。 アブソープションシグナル検出:   高度なロジックで強気・弱気の吸収イベントを特定し、反転の兆しを早期に通知。 チャートマーカー:   吸収シグナルをチャート上に直接マークし、視覚的に分かりやすく表示。 ポップアップアラート:   新しい吸収シグナルが出現した際にリアルタイムで通知。 カスタマイズ可能な閾値:   弱いシグナルを除外し、高確率のセットアップに集中。 リソース管理:   大きなチャートでも高速に動作する効率的な計算。
MATADOR GOLD — XAUUSD M5 ( TimeFrame M5 ) Scalp Signals for MT5 Strategy Tester Visualization Video https://youtu.be/_cWbbyg2RSs Not every move deserves a signal. MATADOR GOLD was built for traders who prefer selective, structured, high-quality decision support over noisy, hyperactive signal tools. Designed specifically for Gold (XAUUSD / GOLD) on M5 , MATADOR helps you read short-term momentum with more discipline by combining trend logic, market-condition filters, momentum timing, spread pro
トレンドに沿ってトレードする際の主な難しさは、レベルを見つけることではなく、どこが実際に有効なエントリーポイントなのかを理解することにあります。 価格はしばしばレベルに反応しますが、動きが継続しないことが多く、その結果、誤ったエントリーや機会損失につながります。 Owl Smart Levels は単にレベルを表示するだけではなく 、市場構造とプルバックに基づいてゾーンを形成します。これにより、エントリーポイントを異なる視点で評価でき、一部の誤シグナルを回避できます。 Owl Smart Levels システムに含まれるもの Owl Smart Levels は単なるレベルの表示ではなく、各要素が連携する 完全なトレードモデル です。 内容は以下の通りです: Owl Smart Levels(インジケーター) トレンド方向、プルバックゾーン、事前定義されたエントリー・StopLoss・TakeProfitレベルを表示 システムガイド 実際のトレードでのシグナルの扱い方を解説:どの状況を考慮し、どれを回避し、どのようにトレードを管理するか トレード判断チェックリスト シグナルを迅
ARIScalp is a powerful trading companion designed to generate high-probability entry signals with dynamic TP/SL/DP levels based on volatility. Built-in performance tracking shows win/loss stats, PP1/PP2 hits, and success rates all updated live. Key Features: Buy/Sell signals with adaptive volatility bands Real-time TP/SL/DP levels based on ATR Built-in MA Filter with optional ATR/StdDev volatility Performance stats panel (Success, Profit/Loss, PP1/PP2) Alerts via popup, sound, push, or email Cus
Native Channels
BeeXXI Corporation
5 (1)
This indicator recognizes all support and resistance levels. A number of unique high-performance techniques have been applied, which made the existence of this indicator possible. All formed channels are naturally visible: horizontal linear linear parabolic cubic (Polynomial 3 degrees - Wave) This is due to a bundle of approximating channels. The formed channels form "standing waves" in a hierarchical sequence. Thus, all support and resistance levels are visible. All parameter management is i
このインジケーターは、市場で 関心が示されたゾーン をハイライトし、その後に 注文の蓄積ゾーン を表示します。 これは、大規模な**板情報(オーダーブック)**のように機能します。 これは、 巨大な資金 のためのインジケーターです。その性能は卓越しています。 市場にどんな関心が存在していても、 必ず目に見えるようになります 。 (これは 完全に再設計され、自動化されたバージョン です。もはや手動分析は必要ありません。) トランザクションスピード(取引速度) は新しい概念のインジケーターで、市場で大口注文が どこに・いつ 集中しているかを示し、それに基づいたチャンスを提供します。 トレンドの変化を 非常に早い段階 で察知することができます。 FXでは「出来高」と呼ばれているものは誤解されています。実際には、これは 時間あたりの価格変動量 です。したがって、正しい名称は トランザクションスピード です。 考え方・行動・分析の仕方すべてが問われます。 分析パラダイムの転換は非常に重要です。 このインジケーターは、FXにおける出来高の考え方を 根本から再定義 し、論理的な形で正確に活用する、
note: this indicator is for METATRADER4, if you want the version for METATRADER5 this is the link:  https://www.mql5.com/it/market/product/108106 TRENDMAESTRO ver 2.5 TRENDMAESTRO recognizes a new TREND from the start, he never makes mistakes. The certainty of identifying a new TREND is priceless. DESCRIPTION TRENDMAESTRO identifies a new TREND in the bud, this indicator examines the volatility, volumes and momentum to identify the moment in which there is an explosion of one or more of these da
Orderflow Scalp Pro v2.4   delivers institutional-grade trading intelligence through advanced volume analysis, dynamic VWAP calculations, real-time aggressive score monitoring, and precision arrow signals. This complete trading system transforms complex market data into clear, actionable signals for consistent profitability on 3-4 minute timeframes. Full Documentation: [Download PDF] Four Powerful Components in One System Volume Profile HeatMap with POC/VAH/VAL Transform your charts into inst
Weis Wave with Alert MT5
Trade The Volume Waves Single Member P.C.
4.94 (17)
Rental/Lifetime Package Options and Privileges  Rent Monthly Six Months   Yearly/Lifetime Weis Wave with Speed with Alert+Speed Index x x x Manual  x x x Quick Set up Video x x x Blog x x x Lifetime Updates x x x Setup and Training Material x x Discord Access Channel "The SI traders"          x Rectangle Break Alert Tool      x How to trade with it:    http://www.tradethevolumewaves.com   ** If you purchase please contact me to setup your  : Training Room and  complete manual access.  Wei
MetaForecast M5
Vahidreza Heidar Gholami
5 (3)
MetaForecastは、価格データのハーモニクスに基づいて、どんな市場の未来を予測し視覚化します。市場が常に予測可能ではありませんが、価格にパターンがある場合、MetaForecastは可能な限り正確な未来を予測できます。他の類似製品と比較して、MetaForecastは市場のトレンドを分析することでより正確な結果を生成することができます。 入力パラメータ Past size (過去のサイズ) MetaForecastが将来の予測を生成するために使用するバーの数を指定します。モデルは選択したバー上に描かれた黄色の線で表されます。 Future size (将来のサイズ) 予測すべき将来のバーの数を指定します。予測された将来は、ピンクの線で表示され、その上に青い回帰線が描かれます。 Degree (程度) この入力は、MetaForecastが市場で行う分析のレベルを決定します。 Degree 説明  0 Degree 0の場合、価格の全てのピークや谷、そして詳細をカバーするために、「Past size」の入力に大きな値を使用することが推奨されています。  1 (推奨) Degre
Rtc ML Ai | Predictor CORE MACHINE LEARNING ENGINE Adaptive ML Market Predictor – Multi-Bar Trend & Candle Forecast What This Indicator Does This indicator is a  real-time market prediction engine  designed to analyze price behavior and estimate  future market tendencies . Unlike conventional indicators, this system  does not rely on static parameters or historical curve-fitting , but adapts its internal state dynamically during live market operation. Instead of using static rules, the indic
SunSignal ML — AI Gold Signals with Multi-Timeframe Confluence SunSignal ML is an advanced AI-powered signal indicator purpose-built for XAUUSD gold trading. It combines a proprietary adaptive trend algorithm with six machine learning models trained on confirmed price pivots to produce high-confidence entry signals with multi-timeframe validation. The indicator runs efficiently on M1, M5 and M15 timeframes and is designed for traders who want precision entries guided by data rather than guesswor
Matreshka
Dimitr Trifonov
5 (2)
Matreshka self-testing and self-optimizing indicator: 1. Is an interpretation of the Elliott Wave Analysis Theory. 2. Based on the principle of the indicator type ZigZag, and the waves are based on the principle of interpretation of the theory of DeMark. 3. Filters waves in length and height. 4. Draws up to six levels of ZigZag at the same time, tracking waves of different orders. 5. Marks Pulsed and Recoil Waves. 6. Draws arrows to open positions 7. Draws three channels. 8. Notes support and re
Elliott Wave Trend was designed for the scientific wave counting. This tool focuses to get rid of the vagueness of the classic Elliott Wave Counting using the guideline from the template and pattern approach. In doing so, firstly Elliott Wave Trend offers the template for your wave counting. Secondly, it offers Wave Structural Score to assist to identify accurate wave formation. It offers both impulse wave Structural Score and corrective wave Structure Score. Structural Score is the rating to sh
もちろんです。以下は、提供いただいたテキストの日本語への翻訳です: MT4用の天文学指標をご紹介します:究極の天体トレーディングコンパニオン トレーディング体験を天空の高みに高める準備はできていますか?私たちの革命的なMT4用の天文学指標をご紹介します。この革新的なツールは、複雑なアルゴリズムの力を借りて、類まれなる天文学的洞察と精密な計算を提供します。 あなたの指先で宇宙の情報を:   宝のような天文学的データが明らかになる包括的なパネルをご覧ください。惑星の地理的/太陽中心座標、太陽と地球の距離、星の大きさ、伸び、星座、黄道座標および赤道座標、さらには水平座標まで、それぞれが綿密に計算され美しく表示されています。指標によって生成される垂直線は時間値に対応し、トレーディングの旅に宇宙の視点を提供します。 惑星のラインと関係:   グラフを飾る惑星のラインの魔法を体験し、スケールと角度をカスタマイズできます。直感的なコントロールパネルを介して各惑星のラインの表示を簡単に切り替えることができます。指定された時刻範囲内での合会、六分会、四分会、三分会、対会、逆行の指標で天体の関係の芸術を発
作者のその他のプロダクト
All-in-One Chart Patterns Professional Level: The Ultimate 36-Pattern Trading System All-in-One Chart Patterns Professional Level is a comprehensive 36-pattern indicator well known by retail traders, but significantly enhanced with superior accuracy through integrated news impact analysis and proper market profile positioning. This professional-grade trading tool transforms traditional pattern recognition by combining advanced algorithmic detection with real-time market intelligence.  CORE FEATU
FREE
Engulfx Pro – Advanced Breakout & News-Driven EA for MT5 Engulfx Pro is a powerful and intelligent Expert Advisor designed for traders who demand smart decision-making, precision entries, and dynamic risk control. This EA combines high-quality technical confirmations with market timing logic to trade breakouts effectively — while staying ahead of volatility caused by major news events. Whether you're a trend trader or a volatility hunter, Engulfx Pro adapts with two professional-grade strategi
FREE
Stop Loss Hunting: Market Manipulation Visualized This professional candlestick chart clearly highlights stop loss hunting zones —a common market manipulation tactic used by institutional players. Sharp downward wicks pierce below local support levels, triggering retail traders' stop losses before price reverses sharply in the opposite direction. Each event is marked with precision red arrows , showcasing engineered liquidity grabs designed to shake out weak positions before strong bullish moves
FREE
Key Marketing Elements:  Professional Positioning: Premium product language - "Ultimate Professional Trading System" Enterprise terminology - "institutional-quality," "professional-grade" Technical credibility - AI-powered, neural network technology Market compliance - MQL5 certified, fully compliant  Value Proposition Highlights: Triple strategy framework with clear explanations AI/Neural network technology as key differentiator Professional visual interface with specific details Comprehensive
FREE
RSI + Grid Distance Strategy with 200 EMA Filter Overview The RSI + Grid Distance Strategy integrates momentum and mean-reversion principles within a structured grid trading framework. By combining the Relative Strength Index (RSI) with dynamic grid levels and a 200-period Exponential Moving Average (EMA) filter, the system seeks to optimize trade timing, trend alignment, and overall position efficiency. Core Logic 1. RSI Signal Generation The algorithm utilizes a 17-period RSI , identifying b
RSI+EMA Grid & Dragonfly+EMA Grid System The RSI+EMA Grid & Dragonfly+EMA Grid System is a sophisticated Expert Advisor (EA) developed for traders who seek both consistency and adaptability in dynamic market conditions. Combining two proven strategies, this EA is built for precision entries, controlled risk, and intelligent position management. Strategy 1: RSI + EMA Grid System This strategy uses a combination of the Relative Strength Index (RSI) and Exponential Moving Averages (EMAs) to identi
Smart Money EQ H/L Scanner v2.0 – Advanced Institutional Market Structure Indicator for MT5 Overview The Smart Money EQ H/L Scanner v2.0 is a professional MT5 indicator built to identify Smart Money Concepts (SMC) in real time. It detects Equal Highs (EQH) and Equal Lows (EQL) patterns — zones that often indicate institutional liquidity targets — helping traders anticipate potential reversals and market manipulation areas. This tool combines price structure, volume profile, and economic event d
--------------------------------------------------------------------------------------------------------------------------------------------------------------------------------------------------------------------------------------------------------------------------------------------------------------  MARKET PROFILE PRO - Professional Volume Analysis & Smart Trading Dashboard Transform Your Trading with Institutional-Grade Market Profile Analysis Market Profile Pro brings Wall Street's most pow
ICT Breaker Block EA - Professional Order Block Trading System  Trade Like The Institutions The ICT Breaker Block EA is a sophisticated automated trading system based on the powerful Inner Circle Trader (ICT) methodology. This EA identifies institutional order blocks, detects when they are broken (becoming "breaker blocks"), and enters trades when price returns to test these levels.  What This EA Does Core Strategy The EA automatically: Detects Order Blocks - Identifies consolidation zones where
LIQUIDITY VOID EA          Professional MetaTrader 5 Expert Advisor PRODUCT OVERVIEW The Liquidity Void EA is a sophisticated automated trading system designed for MetaTrader 5 that capitalizes on liquidity gaps in the market. Based on institutional trading concepts, this
SMC STRATEGY SCALPER PRO - EXPERT ADVISOR ========================================== PROFESSIONAL TRADING SOLUTION FOR MT5 OVERVIEW -------- SMC Strategy Scalper Pro is an advanced automated trading system built on Smart Money Concepts (SMC) methodology. This Expert Advisor combines institutional trading strategies with cutting-edge algorithmic execution to identify and capitalize on high-probability market structures. Designed for serious traders who demand precision, reliability, and prof
Skyliner
Domantas Juodenis
Skyliner EA - The Professional Smart Money Trading System Hello, traders! I am Skyliner , the ultimate multi-market Expert Advisor built on institutional Smart Money Concepts and designed to trade like the professionals do. Unlike other EAs that focus on a single instrument, I am a versatile, all-market powerhouse capable of delivering precision trades across Forex majors, precious metals, and stock indices. My specialty? Smart Money trading using BOS (Break of Structure), FVG (Fair Value Gaps),
Revolution Scalper X v2.0 - Expert Advisor Description Revolution Scalper X is a sophisticated multi-asset scalping Expert Advisor (EA) for MetaTrader 5 that combines advanced risk management, flexible trading strategies, and comprehensive monitoring capabilities through dual on-chart dashboards. Key Features: Multi-Asset Trading Capabilities: Dual Mode Operation : Can operate in single-pair mode (current chart symbol) or multi-asset mode Asset Categories : Supports Forex, Cryptocurrency, and Me
Alliance EA – Smart Money & Swing Trading Expert Advisor for MT5 Alliance EA is a professional MetaTrader 5 Expert Advisor built around Swing Trading and Smart Money Concept (SMC) strategies. It is designed for traders who want a structured, rule-based, and disciplined automated trading system rather than risky scalping or martingale approaches. Alliance EA focuses on high-probability setups , institutional price behavior, and capital protection—making it suitable for both new and experienced t
Induciment Pinbar Signal – Professional Supply & Demand Trading System IT-Pinbar SD is a professional Expert Advisor built on institutional supply & demand concepts , inducement detection, and pinbar confirmation. It is designed to trade where smart money operates , not where retail traders chase price. The EA automatically identifies high-quality supply and demand zones , filters them by strength, and waits for liquidity grabs (false breakouts) before entering. Optional pinbar confirmation ensu
ORB Strategy X (For people who can contact me directly 75% with updates if i do them, discount will be for a month) This Strategy Was Banned. Now It's Back. The Opening Range Breakout is not new. Institutional desks have traded it for decades. When it started appearing in automated form on retail platforms, something interesting happened — brokers began quietly restricting accounts that ran it consistently. Requote storms. Artificial slippage on breakout candles. Platform-level execution delays
PHANTOM SNAP EA  v3.0          Advanced CRT + TBS Automated Trading System               MetaTrader 5 | Multi-Symbol | Netting  OVERVIEW Phantom Snap EA is a professional algorithmic trading system built on two of the most pow
OPEN RANGE BREAKOUT  PRO WHAT IS OPEN RANGE BREAKOUT PRO? Open Range Breakout Pro is a fully-featured, all-in-one trading indicator built exclusively for MetaTrader 5. It automatically identifies the Opening Range — the high and low formed during the first configurable minutes of a trading session — and then detects, visualises, and alerts you to high-probability breakout opportunities the moment price escapes that range. Beyond the core strategy, the indicator ships with a professional dual-
フィルタ:
220072256
4726
220072256 2025.09.07 17:24 
 

ユーザーは評価に対して何もコメントを残しませんでした

レビューに返信