 MetaTrader 5
 エキスパート
 インディケータ
 ライブラリ
ライブラリ ユーティリティ
 ウィジェット
 ルール
ルール
YouTubeにあるマーケットチュートリアルビデオをご覧ください
ロボットや指標を購入する
仮想ホスティングで
EAを実行
EAを実行
ロボットや指標を購入前にテストする
マーケットで収入を得る
販売のためにプロダクトをプレゼンテーションする方法

「Pipwise Smart Daily Levels」は購入できなくなりました。
以前にこの製品を購入された方は、残りのアクティベーションがある限り、引き続きこの製品を制限なく使用し、新しいコピーをインストールできます。
- MetaTrader 4ターミナルを開きます。
- 設定でMQL5.communityのアカウント情報を入力します([ツール]>[オプション]>[コミュニティ])。
- [マーケット]タブを開き、[購入済み]タブに移動します。
- 製品名の右側にある[インストール]ボタンをクリックします。
詳しくは、ドキュメントをご覧ください。
他のMetaTrader 4アプリをご確認ください

Scalping Robot Pro is a professional trading system designed specifically for fast and precise scalping on XAUUSD using the M1 timeframe. The system is built to capture short term market movements with accurate execution and controlled risk management. It focuses on real time price behavior, momentum shifts, short term volatility, and selective grid based trade management techniques to identify high probability trading opportunities in the gold market. Scalping Robot Pro is optimized for tra

プロップしっかり準備完了! ( SETFILEをダウンロード ) ローンチプロモーション: 現在の価格で残りわずかです! 最終価格: 990ドル EA を 1 つ無料で入手 (2 取引アカウント用) -> 購入後に連絡してください Ultimate Combo Deal -> click here JOIN PUBLIC GROUP: Click here Live Signal LATEST MANUAL
ゴールドリーパーへようこそ! 非常に成功した Goldtrade Pro を基にして構築されたこの EA は、複数の時間枠で同時に実行できるように設計されており、取引頻度を非常に保守的なものから非常に不安定なものまで設定するオプションがあります。 EA は複数の確認アルゴリズムを使用して最適なエントリー価格を見つけ、内部で複数の戦略を実行して取引のリスクを分散します。 すべての取引にはストップロスとテイクプロフィットがありますが、リスクを最小限に抑え、各取引の可能性を最大化するために、トレーリングストップロスとトレーリングテイプロフィットも使用します。 こ

Real Trading Account LIVE SIGNAL VT MARKETS: https://www.mql5.com/en/signals/2363526 Join SmiteFX Algos MQL5 Public Chat : https://www.mql5.com/en/messages/03e4dab0b20bdd01
Fortune is an automated breakout Expert Advisor for MetaTrader 4 & 5, developed primarily for XAUUSD. The EA identifies potential breakout and breakdown zones based on recent market structure, then manages each trade according to the risk percentage set by the user. Every position is opened with predefined Stop Loss and

ローンチプロモーション: 現在の価格で入手可能な限定数のコピー 最終価格: 990$ NEW: 無料で EA を 1 つゲット! (2取引口座の場合) Ultimate Combo Deal -> click here
LIVE RESULTS: https://www.mql5.com/en/signals/1949810 JOIN PUBLIC GROUP: Click here Set Files
DayTrade Pro アルゴリズムへようこそ! 何年にもわたって市場を研究し、さまざまな戦略をプログラミングしてきた結果、優れた取引システムに必要なすべてを備えたアルゴリズムを見つけました。 ブローカーに依存しない スプレッド インディペンデント MT4、MT5、TDS2、および複数のブローカーで、実際の変数スプレッドテストを使用して非常に安定したバックテストを簡単に示します 何百もの異なる設定はすべて、テストで有益な結果をもたらします (もちろん、私は最高のものを選択しました!) 非常に堅牢なシステム -> 設定は交換可能であるため、USDJPY か

M1 SNIPER は使いやすいトレーディングインジケーターシステムです。M1時間足向けに設計された矢印インジケーターです。M1時間足でのスキャルピングのためのスタンドアロンシステムとして、また既存のトレーディングシステムの一部としても使用できます。このトレーディングシステムはM1時間足での取引に特化して設計されていますが、他の時間足でも使用できます。元々、この手法はXAUUSDとBTCUSDの取引用に設計しましたが、他の市場においても役立つと考えています。 インジケーターのシグナルは、トレンドの方向と逆方向に取引できます。インジケーターのシグナルを利用して両方向に取引するのに役立つ特別な取引テクニックをご紹介します。この手法は、特別な動的なサポートとレジスタンスの価格帯を利用することに基づいています。 ご購入後、M1 SNIPER矢印インジケーターをすぐにダウンロードできます。さらに、M1 SNIPERツールのすべてのユーザーに、以下のスクリーンショットに表示されているApollo Dynamic SRインジケーターを無料で提供しています。この2つのインジケーターを組み合わせることで
Expert Advisor は、不採算ポジションを回復するために設計されたシステムです。 著者のアルゴリズムは、負けポジションをロックし、それを多くの別々の部分に分割し、それぞれを別々に決済します。簡単なセットアップ、ドローダウンの場合のローンチ遅延、ロック、他の Expert Advisor の無効化、トレンド フィルタリングによる平均化、負けポジションの部分決済が 1 つのツールに組み込まれています。 グループ全体でのみ注文をクローズするグリッド戦略とは対照的に、より低い預金負荷で損失を減らすことができ、損失をより安全に処理できるようにするのは、部分的に損失をクローズすることです。 注文が復元される方法: 1 EA は、選択した商品の他のウィンドウを閉じて、不採算の EA をオフにします (オプション)。 2 EA は、処理されたすべての注文のテイクプロフィットとストップロスのレベルをリセットし、対応する識別子を持つ保留中の注文を削除します。 3 EA は、利益を利用して不採算注文の一部をカバーし、総ポジション量を減らすために、すべての処理された採算性のある注文をクローズします

Xyron Edge is a Professional breakout Expert Advisor (EA) designed to trade market structures by utilizing swing high and swing low levels.
The EA places pending orders above resistance areas and below support areas to capture breakout movements while maintaining controlled risk management. ---------
EA Setting & Preset : EA Input Settings Guide Live Signal : https://www.mql5.com/en/signals/2385451
--------- Key Features Fully automated trading Dynamic support and resistance detection Pen

Scalping Index Pro is a professional trading system designed specifically for fast and precise scalping on US30 and DE40 using the M1 timeframe . The system has been developed specifically for the unique behavior of major stock indices, focusing on short term price movements, rapid momentum changes, market volatility, and selective grid based trade management techniques to identify high probability trading opportunities . Scalping Index Pro is optimized for traders who prefer dynamic tra

Kenni Trades Gold Breakout is an automated trading system developed specifically for Gold on MetaTrader 4 hedging accounts. The EA monitors gold price action for potential breakout opportunities and automatically manages entries, pending orders, position sizing, and exits. Its multi-strategy approach is designed to adapt to different market conditions while maintaining built-in risk controls. Live Motoring MT5 Version
Timeframe: Daily Trading Symbol: XAUUSD Minimum Deposit: $1000 Key Feature

Quantum King EA — あらゆるトレーダーのために洗練されたインテリジェントパワー
IMPORTANT! After the purchase please send me a private message to receive the installation manual and the setup instructions.
発売記念特別価格 ライブ信号: ここをクリック
MT5バージョン: こちらをクリック
クォンタムキングチャンネル: ここをクリック
***Quantum King MT4 を購入すると、Quantum StarMan を無料で入手できます!*** 詳細についてはプライベートでお問い合わせください!
ルール 正確さと規律をもって取引を行ってください。
クォンタムキング EA 構造化グリッドの強さと適応型マーチンゲールのインテリジェンスを 1 つのシームレスなシステムに統合しました。M5 上の AUDCAD 用に設計されており、安定した制御された成長を望む初心者とプロフェッショナルの両

Trade Manager EAへようこそ。これは、取引をより直感的、正確、そして効率的にするために設計された究極の リスク管理ツール です。これは単なるオーダー実行ツールではなく、包括的な取引計画、ポジション管理、リスク管理のためのソリューションです。初心者から上級者、迅速な実行を必要とするスキャルパーまで、Trade Manager EAはあらゆるニーズに対応し、為替、指数、商品、暗号通貨などさまざまな市場で柔軟に対応します。 Trade Manager EAを使用すると、複雑な計算が過去のものになります。市場を分析し、エントリーポイント、ストップロス、テイクプロフィットのレベルをチャート上のラインでマークし、リスクを設定するだけで、Trade Managerが最適なポジションサイズを即座に計算し、SLとTPをピップ、ポイント、口座通貨でリアルタイムに表示します。すべての取引が簡単かつ効果的に管理されます。 主な機能: ポジションサイズ計算機 :定義されたリスクに基づいて取引サイズを瞬時に決定します。 簡単な取引計画 :エントリー、ストップロス、テイクプロフィットを設定するためのド

Expert Advisor Sailing Gold is a fully automated Expert Advisor designed exclusively for trading Gold (XAUUSD) on MetaTrader 4. The EA combines momentum analysis, volatility-based market modeling, and an advanced scalping algorithm to identify high-probability trading opportunities while applying intelligent position management for consistent execution and disciplined risk control. To improve trade quality, Sailing Gold includes an optional Moving Average (MA) trend filter, enabling the EA to tr

Neuro Poseidon is a new indicator by Daria Rezueva. It combines precise trading signals with adaptive TP/SL levels - creating best possible trades as a result! Message me and get Neuro Poseidon Assistant as a gift to automize your trading process!
What makes it stand out?
1. Proven profitability on all assets and timeframes
2. Only confirmed BUY and SELL signals present on the chart
3. Adaptive TP & SL levels generated by the software for each trade
4. Easy to understand - suitable for all

Gann Made Easy は、ミスター・ギャンの理論を使用した取引の最良の原則に基づいた、プロフェッショナルで使いやすい外国為替取引システムです。 W・D・ガン。このインジケーターは、ストップロスとテイクプロフィットレベルを含む正確な買いと売りのシグナルを提供します。 PUSH通知を利用して外出先でも取引可能です。 ご購入後、取引方法の説明と優れた追加インジケーターを無料で入手するには、私にご連絡ください! おそらく、ギャンの取引手法についてはすでに何度も聞いたことがあるでしょう。通常、ギャンの理論は初心者のトレーダーだけでなく、すでにある程度の取引経験がある人にとっても非常に複雑なものです。なぜなら、ギャンの取引手法は理論的にはそれほど簡単に適用できるものではないからです。私はその知識を磨き、最良の原則を私の外国為替インジケーターに組み込むために数年を費やしました。 このインジケーターは非常に簡単に適用できます。必要なのは、それをチャートに添付し、簡単な取引推奨事項に従うだけです。このインジケーターは常に市場分析の仕事を行い、取引の機会を探します。適切なエントリーポイントを検出す

We proudly present our cutting-edge robot, the Big Forex Players EA designed to maximize your trading potential, minimize emotional trading, and make smarter decisions powered by cutting-edge technology. The whole system in this EA took us many months to build, and then we spent a lot of time testing it. This unique EA includes three distinct strategies that can be used independently or in together. The robot receives the positions of the biggest Banks (positions are sent from our database t

MetaTrader 4向け 高機能トレードコピーソフト MetaTrader 4 用の、高速・安定・高機能なトレードコピーソフトです。 COPYLOT は、 MetaTrader 4 と MetaTrader 5 間でFX取引をコピーでき、さまざまな口座タイプや運用スタイルに合わせて柔軟に同期できます。 COPYLOT MT4版の対応コピー方式: MetaTrader 4 → MetaTrader 4 MetaTrader 5 Hedge → MetaTrader 4 MetaTrader 5 Netting → MetaTrader 4 MT5版 詳細説明 + DEMO + PDF 購入方法 インストール方法 ログファイルの取得方法 テストと最適化の方法 Expforexの全製品 MetaTrader 5版 を使えば、 MetaTrader 5 → MetaTrader 5 および MetaTrader 4 → MetaTrader 5 のコピーにも対応します: COPYLOT CLIENT for MT5 COPYLOT は、2台、3台、さらには10台規模のターミナル環境でも

DayTrader PRO MT5: https://www.mql5.com/en/market/product/186222 DayTrader PROは、ジョン・エリュース(John Ehlers)のラグuerreフィルターと強力な自動最適化エンジンを組み合わせた、高度なトレーディング・インジケーターです。固定されたパラメーターを使用するのではなく、直近の市場状況に基づいて最適な設定を自動的に検索するため、手動による絶え間ない調整をすることなく、変化する市場のボラティリティに適応できます。 本インジケーターは、明確な「買い(BUY)」および「売り(SELL)」シグナルを生成し、現在の市場ボラティリティから算出された適応型のストップロス(Stop Loss)およびテイクプロフィット(Take Profit)レベルを表示します。トレンド、効率レシオ(Efficiency Ratio)、ボラティリティ、およびローソク足フィルターが内蔵されており、精度の低いセットアップを排除し、シグナルの精度を向上させます。 リアルタイム・パフォーマンスパネルには、現在最適化されている設定、プロフィッ

MULTI SNIPER EA は、MT4プラットフォームで約90%の精度を誇る高精度自動取引システムです。
この収益性の高いスキャルピングEAは、現在市場で最も安定したシステムの一つです。 No grid! No martingale!
このMQL5ウェブサイトでのみ提供されるオリジナル製品です。 テストと取引用の EA Set_files をダウンロードします 。 GBPAUD Set_file GBPCAD Set_file - 複利法とスキャルピングテクニックを実装しています。 - システムは市場のボラティリティに応じて動的SLを自動的に設定します。 - EAはデフォルトで自動(ロット計算)リスク管理機能を備えており、固定ロットオプションも利用可能です。 - 取引エントリー感度パラメータを調整可能。 - 週末の取引ギャップを回避。 - 1分単位の高精度な動作時間フィルター。 - スプレッド表示機能搭載。 - ロボットには損益分岐点機能があります。 - 口座レバレッジ:1:30~1:2000の範囲で設定可能。 - 最も推奨される通貨ペアはGBPCADとGBPAUD

SR Liquidity は、市場の流動性が集中し、価格が最も強く反応する「隠れたゾーン」を可視化するために設計されたトレーディング指標です。こうした流動性の高いエリアは強力なサポート(支持)およびレジスタンス(抵抗)レベルとして機能し、市場が反転する可能性が最も高いポイントを明確に示してくれます。 単なる一般的なサポートラインやレジスタンスラインを描画するのではなく、「SR Liquidity」は実際の価格変動を分析し、売りと買いの圧力が集中するゾーンを特定します。これらは、市場の真の動きを牽引する「流動性のプール(溜まり場)」そのものです。それらをチャート上に直接可視化することで、価格が実際に反応する前に、その動きを予測することが可能になります。つまり、このインジケーターは価格の方向性が変わる可能性を予測するのです。生のプライスアクションを、市場の重要な水準(転換点となり得るポイント)を示す、明確で実用的なロードマップへと変換してくれます。 このインジケーターは、FX、株価指数、貴金属、仮想通貨など、あらゆる銘柄や時間足で使用可能です。 ご購入後、取引手順や無料の優れた追加インジケ

Local Trade Copier EA MT4 による、驚くほど高速な取引コピーを体験してください。1分で簡単にセットアップできるこの取引コピー機は、同じWindowsコンピュータまたはWindows VPS上の複数のMetaTrader端末間で取引をコピーすることができ、0.5秒未満の高速コピースピードを実現します。
初心者であろうとプロのトレーダーであろうと、 Local Trade Copier EA MT4 には、あなたの特定のニーズに合わせてカスタマイズするための幅広いオプションが用意されています。これは、利益の可能性を高めたい人にとって究極のソリューションです。 今すぐ試してみて、これが市場で最も速くて簡単なトレードコピー機である理由を理解してください。 ヒント: デモアカウントで Local Trade Copier EA MT4 デモバージョンをダウンロードして試すことができます: ここ ダウンロードした無料のデモ ファイルを MT4 >> ファイル >> データ フォルダを開く >> MQL4 >> Experts フォルダに貼り付けて、ターミナルを再起動しま

この製品は 2026 年の市場向けに更新され、最新の MT5 ビルドに最適化されています。 価格更新のお知らせ:
Smart Trend Trading System は現在 $99 で提供されています。
次の 30 件の購入 後、価格は $199 に上がります。 特別オファー: Smart Trend Trading System を購入後、私にプライベートメッセージを送ることで、 Smart Universal EA を無料 で受け取り、Smart Trend のシグナルを自動売買に変えることができます。 Smart Trend Trading System は、リペイントなし、再描画なし、遅延なしの完全なトレーディングシステムです。よりクリーンなシグナル、より明確なトレンド方向、そしてより整理された取引方法を求めるトレーダー向けに作られています。 Online course , manual and [download presets] . このシステムは、トレンド検出、反転ゾーン、Smart Cloud、トレーリングストップロジック、サポートとレジスタンス、ローソク足の色分け

ほとんどのエキスパートアドバイザーがバックテストのパフォーマンスは完璧でも、実際の取引では効果的でない理由について考えたことはありますか?
最もありそうな答えは過学習です。多くのEAは利用可能な過去のデータに完璧に適応するように作成されていますが、構築されたモデルに一般化能力がないため、将来を予測することができません。 一部の開発者は、過学習の存在を知らないか、知っていても防止する方法を持っていません。他の人はそれをバックテスト結果を美化するためのツールとして利用し、統計的な有意性を考慮せずに数十の入力パラメータを追加し、取引戦略を過去のデータに過度に合わせ、自分の EA が将来において同様のパフォーマンスを達成できると他の人に納得させようとします。 もし興味があって、過学習についてより深く理解したい場合は、こちらの私の記事を参照してください。 Avoiding Over-fitting in Trading Strategy (Part 1): Identifying the Signs and Causes Avoiding Over-fitting in Trading St

Real Trading Account LIVE SIGNAL 100K REAL: https://www.mql5.com/en/signals/2388151 Real Trading Account LIVE SIGNAL VT MARKETS: https://www.mql5.com/en/signals/2378166
Join SmiteFX Algos MQL5 Public Chat : https://www.mql5.com/en/messages/03e4dab0b20bdd01
Fortress is an automated breakout Expert Advisor for MetaTrader 4 & 5, developed primarily for XAUUSD. The EA utilizes multiple confirmation algorithms and internal strategies to identify optimal breakout points at key support and res

Dynamic Forex28 Navigator - 次世代の Forex 取引ツール。 現在 49% オフ。
Dynamic Forex28 Navigator は、長年人気のインジケーターを進化させたもので、3 つの機能を 1 つにまとめています。 Advanced Currency Strength28 インジケーター (レビュー 695 件) + Advanced Currency IMPULSE with ALERT (レビュー 520 件) + CS28 コンボ シグナル (ボーナス)。
インジケーターの詳細 https://www.mql5.com/en/blogs/post/758844
次世代の Strength インジケーターが提供するもの オリジナルで気に入っていたすべての機能が、新機能と精度の向上によって強化されました。
主な機能: 独自の通貨強度計算式。 すべての時間枠でスムーズかつ正確な強度ライン。 トレンドの特定と正確なエントリーに最適です。
ダイナミックマーケットフィボナッチレベル (マーケットフィボナッチ)。 このインジケーターに固有

EA Gold Stuffは、金取引のために特別に設計されたExpert Advisorです。 この作業は、ゴールドスタッフインジケーターを使用した注文の開始に基づいているため、アドバイザーはトレンドに従うことを意味する"トレンドフォロー"戦略に従って動作します。
重要! 指示とボーナスを得るために購入後すぐに私に連絡してください! トレンド スキャナーの強力なサポートを利用して、無料のインジケーターを入手し、プライバシーを守ります。あーみー! リアルタイムの結果はここで見ることができます
パラメータ
新しいシリーズを開く-新しいシリーズの注文の開始をオン/オフします。 開始ロット-開始ロット。 トレードバイ-Expert Advisorが購入できるようにします。 トレード売り-Expert Advisorが売ることを許可します。 ヘッジを使用する-機能が有効になっている場合、アドバイザーは買いと売りの両方の方向を取引し、機能が無効になっている場合、アドバイザーは一方向 マネー Manadgementを使用-オン/自動ロット計算の使用をオフにします。 オートロットオー

Trend Radar — Expert Advisor for MetaTrader 4 Overview Trend Radar is an Expert Advisor (EA) for MetaTrader 4 that opens trades based on a proprietary price-channel analysis model, filtered by slope angle and corridor width. The EA combines clear signal logic with flexible risk management and full control over every stage of trade management — from entry to trailing stop. How It Works Channel analysis. The EA builds a price channel from the last SignalBarCount bars and determines its overall dir

割引は 24 時間後に終了します — 次の価格は$ 69 ZORYK — MetaTrader 4専用 XAUUSDシグナル・トレードプランニングシステム
このような経験はありませんか。
ゴールドを分析し、エントリーを待ち、ようやくポジションを持った直後に価格が逆方向へ動く。
早すぎる決済をしてしまったり、Stop Lossを動かしたり、数秒迷っている間にチャンスを逃したりする。
その後、相場は自分が最初に予想していた方向へ進み、目標へ到達する。
問題は常に方向判断ではありません。
本当の問題は、明確な計画がなかったことです。
どこでエントリーすべきか。
どこでトレードの前提が無効になるのか。
近い利益を確保すべきか、より大きな値動きを待つべきか。
現在のsetupが本当に強いのか、それとも無理にトレードを探しているだけなのか。
ゴールドは非常に速く動きます。
正しい分析でも、明確なプランがなければ数秒で悪い判断に変わることがあります。
ZORYKは、その問題を解決するために開発されました。
ZORYKとは
ZORYKは、MetaTrader 4とXAU

取引 ごとのリスクの 計算、新規注文 の 簡単 な 設置、部分的 な 決済機能 を 持 つ 注文管理、 7 種類 のトレーリングストップなど 、便利 な 機能 を 備 えています 。
追加の資料と説明書
インストール手順 - アプリケーションの手順 - デモアカウント用アプリケーションの試用版
ライン機能 チャート上にオープニングライン、ストップロス、テイクプロフィットを表示します。この機能により、新規注文を簡単に設定することができ、注文を出す前にその特徴を確認することができます。 リスク計算 リスク計算機能は、設定されたリスクとストップロス注文のサイズを考慮して、新規注文のボリュームを計算します。ストップロスの大きさを自由に設定できると同時に、設定したリスクを守ることができます。 Lot calc ボタン - リスク 計算 を 有効 / 無効 にします 。 Risk フィールドでは 、必要 なリスクの 値 を 0 から 100 までのパーセンテージまたは 預金通貨 で 設定 します 。 設定」 タブで 、 リスク 計算 の 種類 を 選択 します :「 $ 通貨」、「 % 残

XGen Scalper MT4 - プロフェッショナル自動取引システム
XGen Scalperは、高度なアルゴリズム構造と実証済みのテクニカル分析を組み合わせ、あらゆる市場で一貫した結果を提供する最先端のエキスパートアドバイザーです。この強力な取引システムは、外国為替ペア、金や銀などの貴金属、暗号通貨、商品指数で問題なく動作します。
高度なアルゴリズム技術
独自の波動スキャンアルゴリズムは、市場データをリアルタイムで処理し、手動の投資家が見逃しがちな、可能性の高い取引機会を特定します。このシステムは、変化する市場の状況に絶えず適応し、トレンド、レンジ、ボラティリティの高い環境でも効果的に機能します。
ユニバーサルな互換性
特定のペア向けに設計された従来の EA とは異なり、XGen はすべての商品で優れたパフォーマンスを発揮します。
プロフェッショナルなコントロールパネル
リアルタイムの口座指標、詳細な取引統計、システムステータスを表示する洗練されたインターフェースで、取引パフォーマンスを監視します。統合された波形視覚化により、システムが市場の状況をどのように解釈し

The product will copy all telegram signal to MT4 ( which you are member ) , also it can work as remote copier. Easy to set up, copy order instant, can work with almost signal formats, image signal, s upport to translate other language to English Work with all type of channel or group, even channel have "Restrict Saving Content", work with multi channel, multi MT5 Work as remote copier: with signal have ticket number, it will copy exactly via ticket number. Support to backtest signal. How to

Vortex - 未来への投資
Vortex Gold EAはメタトレーダープラットフォーム上で金(XAU/USD)を取引するために特別に作られたエキスパートアドバイザーです。独自の指標と作者の秘密のアルゴリズムを用いて構築されたこのEAは、金市場の有益な動きを捉えるように設計された包括的な取引戦略を採用しています。その戦略の主要な構成要素には、CCIやパラボリックインジケーターなどの古典的なインジケーターが含まれており、これらは理想的なエントリーポイントとエグジットポイントを正確に知らせるために連動します。Vortex Gold EAの核心は、高度なニューラルネットワークと機械学習テクノロジーです。これらのアルゴリズムは、過去のデータとリアルタイムのデータの両方を継続的に分析し、EAがより高い精度で進化する市場トレンドに適応し対応することを可能にします。ディープラーニングを活用することで、Vortex Gold EAはパターンを認識し、指標パラメーターを自動的に調整し、時間の経過とともにパフォーマンスを向上させます。Vortex Gold EAは、独自の指標、機械学習、適応可能な取

Cross Sided Scalp は、内蔵された相関マトリックスのサポートによる高精度なエントリーを活用することを目指した、日中のトレンドフォローシステムです。 Live Signal が利用可能です!現在の価格は値上げされます。期間限定価格 75 USD。
グリッドなし、マーチンゲールなし。すべての取引は独立してエントリーされます
固定ストップロスに対応し、仮想ダイナミックトレーリングストップシステムを搭載
カスタマイズ可能なマトリックスパネルと正確なロットサイズ設定
推奨設定 チャート: EURUSD, GBPUSD
時間足: H1
パラメータ 通貨相関ペア - マトリックスにペアを追加 サフィックス自動検出 - 有効または無効
固定ロットサイズ - 固定ロットサイズ 自動ロット - この口座通貨の金額ごとに0.01ロット 最大スプレッド - ポジションを開く際に許可する最大スプレッドを設定 固定ストップロス - ストップロス設定
Magic Number - 各注文のMagic Number ポジションコメント
取引パネルの外観

Market Reversal Alerts EAは、同名のインジケーター(ここで入手可能)を利用しており、市場構造の変化に基づいて取引されます。
EAはデフォルトで、インジケーターによって市場反転アラートが送信されるたびに取引を行い、EA設定で設定した条件とフィルターに基づいてそれらのアラートを取引します。
価格が現在のトレンド方向に移動するとサポート長方形が描画され、価格が急激に反転すると取引され、市場構造のシフトまたは反転の再テストが通知されます。詳細はインジケーターページをご覧ください。
この説明でカバーするには設定と可能性が多すぎるため、このブログ投稿には、すべての設定とそれらすべてを詳細に説明するビデオが記載されたブログ投稿があります。 https://www.mql5.com/en/blogs/post/745502
上記の投稿を読んでビデオを見ると、EAがいかに強力であるかがわかります。
あなたが始めるためのいくつかの良いセットファイルとこのブログ投稿で利用可能な戦略。 https://www.mql5.com/en/blogs/post/745984

KURAMA GOLD SIGNAL PRO(MT4版)— 7層フィルター・自動TP/SL・品質スコア・サイン履歴保存搭載 XAUUSD完全トレードシステム
リアルタイムでリペイントしません。サインが出た瞬間、矢印・エントリー・TP・SLはその場で固定され、後から動きません。あなたがトレードするのは、この「リアルタイムで出たサイン」です。さらにv7.20では、実際に通知されたサインを自動保存し、再起動後もそのまま復元します。
購入者限定特典 買い切りライセンスをご購入いただいた方に、AI Zone Radar($59相当)+完全PDFマニュアルを無料プレゼント。本体価格に$59相当の特典が付いてきます。購入後にMQL5でメッセージをお送りください。 AI Zone Radar: https://www.mql5.com/en/market/product/175834
ゴールドトレーダーのコミュニティで実際に使用され、精度と使いやすさで高く評価されています。
あな

プロモーションを開始します! 449ドルで残りわずかです! 次の価格: 599ドル 最終価格: 999ドル EA を 1 つ無料で入手 (2 取引アカウント用) -> 購入後に連絡してください Ultimate Combo Deal -> click here
New live signal: https://www.mql5.com/en/signals/2084890 Live Signal high risk : https://www.mql5.com/en/signals/2242498
Live Signal Set Prop Firm Set JOIN PUBLIC GROUP: Click here Parameter overview
Gold Trade Pro はゴールド取引 EA の仲間入りですが、大きな違いが 1 つあります。それは、これが本物の取引戦略であるということです。 「実際の取引戦略」とは何を意味しますか? おそらくお気づきかと思いますが、市場に出回っているほぼすべてのゴールド EA は単純なグリッド/マーチンゲール

ONE OF THE FEW ROBOTS WITH A SIGNAL HISTORY OF MORE THAN 3 YEARS AND AMONG THE TOP 10. LINK TO MY ROBOTS AND SIGNAL PRESETS: In my profile there is a link to download the PRESETS that I use in my SIGNALS, you can download and Backtest for free, there are explanations in the my WebSite. https://www.mql5.com/en/users/tec_daniel LINK TO OTHER ROBOT VERSIONS: MT4: https://www.mql5.com/en/market/product/97963 MT5: https://www.mql5.com/en/market/product/97962 SOME EXAMPLES OF SIGNALS ON “mql5.

通貨強さウィザードは、取引を成功させるためのオールインワン ソリューションを提供する非常に強力な指標です。このインジケーターは、複数の時間枠のすべての通貨のデータを使用して、このまたはその外国為替ペアのパワーを計算します。このデータは、使いやすい通貨インデックスと通貨パワーラインの形式で表され、特定の通貨のパワーを確認するために使用できます。 必要なのは、取引したいチャートにインジケーターを接続することだけです。インジケーターは、取引する通貨の実際の強さを示します。このインジケーターは、トレンドに合わせて取引するときに有利に利用できる売買高の圧力の極値も示します。このインジケーターには、フィボナッチに基づく可能なターゲットも表示されます。 このインジケーターは、PUSH 通知を含むあらゆるタイプのアラートを提供します。 購入後ご連絡下さい。私の取引のヒントをあなたと共有し、素晴らしいボーナスインジケーターを無料で提供します! 幸せで有益な取引をお祈りします。

Mirror EAは、単純移動平均線(SMA)と相対力指数(RSI)を組み合わせたSmaSRS196インジケーターに基づき、96期間の最適化フレームワークを用いて取引を実行する自動取引システムです。このEAは、SMAでトレンドの方向を確認し、RSIでモメンタムの強さや買われすぎ・売られすぎの状態を検出することで、市場状況を継続的に分析し、高確率の取引機会を特定します。インジケーターが赤色の場合はMAの下で売り、緑色の場合はMAの上で買います。
この戦略は、ポジションを開始する前にトレンドとモメンタムの整合性を要求することで、誤ったシグナルを減らすように設計されています。設定可能なパラメーターにより、さまざまな金融商品と時間枠に合わせて最適化しながら、実行の一貫性を維持できます。このEAはあらゆる通貨ペアと時間枠に適していますが、M15時間枠のxauusdのような強いトレンドのある銘柄で特に優れたパフォーマンスを発揮します。これはマーチンゲール/グリッドEAです。 リアルタイムの結果はここで確認できます。 個人ボーナスを獲得するには、購入後すぐにご連絡ください。 設定・マニュアルはこ

Trend Sniper X は、トレーダーがトレンドの方向性と潜在的な反転ポイントを明確かつ正確に特定できるように設計された、MetaTrader 5 用のマルチタイムフレーム・トレンドフォロー指標です。 MT5版はこちら: https://www.mql5.com/en/market/product/181101 価格情報: 現在の価格はプロモーション価格であり、今後のアップデートや新機能の追加に伴い変更される場合があります。 Code2Profit チャンネル マルチタイムフレーム分析で市場をマスターしよう! Trend Sniper Xで勝率を最大化する方法:ルールとセッションのコツ 技術仕様 プラットフォーム MetaTrader 5 インジケータータイプ マルチタイムフレーム・トレンドインジケーター 動作タイムフレーム すべてのチャート時間足(上位足M1~MN1を独立して選択可能) 主要対象銘柄 為替(Forex)、ゴールド(XAUUSD)、その他のCFD 推奨口座 すべての口座タイプ ビジュアル表示 トレンドカラーローソク足(買い/売り/弱い/変化)+ 買い/売りシグナル

現在30%オフ 初心者にもエキスパートトレーダーにも最適なソリューション このインジケーターは独自の機能と新しい公式を多数内蔵しており、ユニークで高品質かつ手頃な取引ツールです。このアップデートでは、2つの時間枠ゾーンを表示できるようになります。より長いTFだけでなく、チャートTFとより長いTF(ネストゾーンを表示)の両方を表示できます。すべてのSupply Demandトレーダーの皆さんのお気に召すはずです。:)
重要情報の公開 Advanced Supply Demandの可能性を最大化するには、 https://www.mql5.com/ja/blogs/post/720245 にアクセスしてください。 エントリーまたはターゲットの正確なトリガーポイントを正確に特定できれば取引がどのように改善されるか想像してみてください。新しい基盤となるアルゴリズムに基づいて構築されているため、買い手と売り手の間の潜在的な不均衡をさらに簡単に特定できます。これは、最も強い需要と供給のゾーンと、過去のパフォーマンス(古いゾーンを表示)がグラフィカルに表現されるためです。これらの機能は、最適な

現在のプロモーション: 残り 1 個 549$ 最終価格: 999$ NEW: Choose 1 EA for free! (for 2 trade account numbers) プロモーション ブログ で「 究極の EA コンボ パッケージ」 をチェックしてください 。
LIVE SIGNAL
Bitcoin Scalp Pro は市場で唯一の取引システムです。 サポートとレジスタンスレベルのブレイクアウトを取引することにより、ビットコイン市場のボラティリティを悪用することに完全に焦点を当てています. EA の焦点は安全性にあります。これは、極端に低いドローダウンと取引の非常に優れたリスク/報酬比につながります。 EA は、ビットコインの実際の価格に基づいて、ストップロス、テイクプロフィット、トレーリングSL だけでなく、エントリーとロットサイズも計算する「スマート適応パラメーター システム」を内部で使用します。 つまり、ビットコインが 6000 または 30000 で取引されている場合、すべてのパラメーターの値が異なります。
EA は 2022 年 6 月以降、実

アップデート — 2025年12月 2024年11月末、Aurumは正式に販売開始されました。
それ以来、ニュースフィルターや追加の防御条件、複雑な制限なしで、実際の相場環境にて継続的に稼働してきましたが、安定して利益を維持してきました。 Live Signal (launch April 14, 2026)
この1年間のリアル運用により、トレーディングシステムとしての信頼性が明確に証明されました。
そしてその実績と統計データを基に、2025年12月に大規模アップデートを実施しました:
プレミアムパネルを全面刷新、すべての画面解像度に最適化 取引保護システムを大幅に強化 Forex Factoryを基にした高性能ニュースフィルターを追加 シグナル精度を向上させる2つの追加フィルター 最適化の強化、動作速度と安定性の向上 損失後に安全に回復するRecovery機能を搭載 プレミアムスタイルの新しいチャートテーマを採用
AURUMについて
Aurum — ゴールド(XAU/USD)専用プレミアム自動売買EA
Aurumはゴールド市場において、安定性と安全性を重視して開発されたプロ

- Real price is 300$ - Limited Discount (It is 49$) - Only 1 purchase is 49$. - Lifetime update free Welcome, Bitcoin Expert opens automatically trade with Highly profit, Fixed Stop loss. No Martingale, No Grid, No Scam Bitcoin is a cryptocurrency, a peer-to-peer digital currency that operates independently of a central governing authority . Bitcoin enables direct transactions between users, secured by cryptographic technology and recorded on a transparent and immutable ledger without centra

BTMM State Engine Pro by G-Labs — Beat The Market Maker indicator for MetaTrader 4. Asian session range, London and New York kill zones, level progression (L1/L2/L3), peak formation detection (PFH/PFL), entry signals, and a multi-pair scanner from one chart.
Stop scanning charts one pair at a time. The State Engine tracks the BTMM daily cycle automatically — Asian box, room boundaries, level blocks, peak formations, and filtered entries — while the scanner dashboard shows level, peak status,

Prop Firm Sniper MT4 is a professional market structure indicator that automatically identifies high-probability BUY and SELL opportunities using BOS and CHoCH analysis.
Recommended Timeframes: For backtesting, use the indicator on M5 or M15 for Gold (XAUUSD), and M15 or H1 for more volatile Forex pairs such as GBPUSD, USDJPY, EURGBP , and similar markets.
CONTACT ME AFTER PURCHASE TO CLAIM YOUR FREE BONUSES!
Prop Firm Sniper is a professional market structure indicator designed t

Trade Panelは多機能なトレーディングアシスタントです。アプリには手動取引用の50以上のトレーディング機能が搭載されており、ほとんどの取引作業を自動化することができます。 アプリの説明書+ビデオガイド: https://www.mql5.com/en/blogs/post/756482 デモ口座用アプリの試用版: https://www.mql5.com/en/blogs/post/750865 アプリのインストール方法: https://www.mql5.com/en/blogs/post/756239 アプリをビジュアルモードでテストする方法: https://www.mql5.com/en/blogs/post/770277 VPSのMetaTraderにアプリをインストールする方法: https://www.mql5.com/en/blogs/post/770190 取引。 ワンクリックで取引操作を行うことができます: リスクを自動計算して指値注文やポジションを開く。 複数の注文やポジションをワンクリックで開く。 注文のグリッドを開く。 保留中の注文やポジションをグルー

CRT Candle Range Theory HTF MT4. Ultimate CRT Indicator: Advanced ICT Concepts and Malaysian SnR Trading System Master the Market Maker's Footprints with the Most Advanced Candle Range Theory Indicator Unlock the true power of Smart Money Concepts (SMC) and trade precisely like the institutions with the Ultimate CRT Indicator . Built exclusively for serious traders, this indicator automates the highly effective Candle Range Theory (CRT) , a core pillar of ICT Concepts (Inner Circle Trader

プロモーションを開始: 399ドルで1部のみ入手可能 最終価格: 2000ドル この EA の販売数は限られています
市場で最も先進的な「ミーンリバース」取引ロボットである Luna AI Pro EA を使用して 、人工知能の力を解き放ち、取引を前例のない高みに引き上げましょう。 経験豊富なトレーダーと初心者の両方に対応するように設計されたこの最先端の AI 駆動システムには、取引戦略を最適化し、利益を最大化するための幅広い機能が装備されています。 Luna AI Pro を使用して、取引戦略の可能性を最大限に引き出します。 トレーディングの未来を受け入れ、高度な人工知能があなたの投資の旅に革命を起こしましょう。 今すぐ AI のパワーを体験し、世界中で成功したトレーダーの仲間入りをしましょう。
この EA が他と異なる理由: OneChartSetup -> 1 つの単一チャートからすべてのペアを実行 個別のパフォーマンス モニター: 各ペアのパフォーマンスが良くない場合はリスクが自動的に削減され、再び収益が上がる場合はリスクが再び増加します。 マーチンゲール法、グリッド法、

EAブラックドラゴンはブラックドラゴンインジケーターで動作します。エキスパートアドバイザーはインジケーターの色で取引を開始し、注文のネットワークを構築したり、ストップロスで作業したりすることができます。
実際の作業の監視、およびその他の開発については、https:// www.mql5.com/en/users/mechanic/sellerを参照してください 。
ここですべての設定を見つけることができます!推奨事項
通貨ペアEURUSDGBPUSD 時間枠M15 推奨保証金1000ドルまたはセント 推奨設定デフォルト設定入力パラメータ 初期ロット-初期ロット; ロット乗数-後続の注文のロット乗数。 自動ロット-自動ロット計算を有効/無効にします。 自動ロットサイズ-自動ロットが有効になっている場合にアドバイザーがロットを使用するデポジットの金額。 距離-注文間の距離。 最大ロット-アドバイザーが開くことができる最大ロット。 利益を得る-利益を得る; ストップロス-ポイントでストップロス。 トレイルスタート-トレーリングストップがアクティブ化されたポイントでの利益。

TelegramからMT4へ: 究極のシグナルコピーソリューション Telegram to MT4 は、DLLを必要とせず、TelegramのチャンネルやチャットからMetaTrader 4プラットフォームに取引シグナルを直接コピーできる最先端のユーティリティです。この堅牢なソリューションは、比類のない精度とカスタマイズオプションにより、シグナルのシームレスな実行を保証し、時間を節約し、効率性を向上させます。 [ Instructions and DEMO ] 主な特徴 直接的なTelegram API統合 電話番号とセキュアコードで認証します。 ユーザーフレンドリーな EXE ブリッジを使用して、チャット ID を簡単に取得および管理します。 複数のチャネル/チャットを追加、削除、更新して、同時に信号をコピーします。 高度なフィルターによる信号解析 カスタム例外語 (例: 「レポート」、「概要」) を含む不要な信号をスキップします。 柔軟な SL および TP 形式 (価格、ピップ、ポイント) をサポートします。 シグナルが価格ではなくポイントを指定する場合、エントリ ポイントを自動

One Gold EA をご紹介します。これは、Meta Trader プラットフォーム上の洗練された金取引ロボットで、高度な市場分析でトレーダーを支援するために開発されました。当社の独自のテクノロジーは、ニューラル ネットワークとデータ駆動型アルゴリズムを活用して、過去およびリアルタイムの金市場データを分析し、意思決定に役立つ洞察を提供します。従来の手動戦略とは異なり、One Gold EA は最小限の介入で動作し、取引プロセスを合理化し、関連するリスクの削減を目指しています。高度なニューラル プラグインの使用によりロボットの分析機能が強化されますが、他の取引ツールと同様に、One Gold EA は利益を保証するものではないことに留意することが重要です。ただし、より情報に基づいたデータに裏打ちされた洞察を提供することで、取引パフォーマンスを向上させる可能性を考慮して設計されています。One Gold EA は、金市場を継続的に監視して、人間のトレーダーが見つけるのが難しいパターンや傾向を検出します。このシステムはさまざまな市場状況に適応できるため、特に金取引のような非常に不安定な環

単純なドラッグアンドドロップEAでMetatrader4をPythonに接続するためのドキュメント。 完全にテストされた、高速で効率的な完全なエンドツーエンドソリューション!
Pytraderエコシステムは、PythonスクリプトとMT4またはMT4EAで構成されています。 さらに、ライセンス供与にはインジケーターが使用されます。 PythonスクリプトとEAの間の通信は、ソケットに基づいています。 EAはサーバーであり、Pythonスクリプトはクライアントです。 それは常にquery(関数/ pythonスクリプト)とoutput(データ/サーバー)です。 EAは、Pythonスクリプトが実行されているのと同じコンピューターで実行する必要はありません。 Githubリンクには、Pythonスクリプト、EA、完全なドキュメント、および関数の呼び出し方法を示すPytraderサンプルスクリプトがあります。 質問については、不和チャンネルもあります。 デモ(ライセンスインジケーターなし)でも全機能がありますが、機器の数は限られています (EURUSD、AUDCHF、NZDCHF、GBP

Exorcist Bot is a multi-currency, multi-functional advisor that works on any time frame and in any market conditions. - The robot’s operation is based on an averaging system with a non-geometric progression of constructing a trading grid. - Built-in protection systems: special filters, spread control, internal trading time limitation. - Construction of a trading network taking into account important internal levels. - Ability to customize the aggressiveness of trading. - Working with pending

FullScalping は、あらゆる市場で 継続的なスキャルピングエントリー を生成するように特別に設計された 再描画なし、後方描画なし のインジケーターです。絶え間ないアクションを求める積極的なトレーダーに最適です!
独占情報とアップデートを入手するには、チャンネルに参加してください: https://www.mql5.com/en/channels/forexnewadvisor
ほぼすべてのローソク足 でシグナルを出し、トレンドを確認するか、重要なリトレースメントをシグナルします。常にあなたを導くレーダーのようなものです。
どのように機能しますか?非常にシンプルです: 赤い矢印 売り 取引に入る。 青い矢印 買い 取引に入る。 常に一般的なトレンドの方向に取引し、 取引ごとに15〜20ピップ を積極的にターゲットにし、急激な市場の反転の前に素早く退出します。
シグナルは 継続的 なので、取引機会が尽きることはありません。目標は以下を使用して 集中的なスキャルピング を実行することです: 高ロット 低スプレッド(左下隅に表示) 最後のトレンド変化の近くに配置された
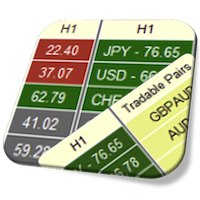
Currency Strength Meter is the easiest way to identify strong and weak currencies. This indicator shows the relative strength of 8 major currencies + Gold: AUD, CAD, CHF, EUR, GBP, JPY, NZD, USD, XAU. Gold symbol can be changed to other symbols like XAG, XAU etc.
By default the strength value is normalised to the range from 0 to 100 for RSI algorithm: The value above 60 means strong currency; The value below 40 means weak currency;
This indicator needs the data of all 28 major currency pairs a

この製品は 2026 年の市場向けに更新され、最新の MT5 ビルドに最適化されています。 価格更新のお知らせ:
Atomic Analyst は現在 $99 で提供されています。
次の 30 件の購入 後、価格は $199 に上がります。 特別オファー: Atomic Analyst を購入後、私にプライベートメッセージを送ることで、 Smart Universal EA を無料 で受け取り、Atomic Analyst のシグナルを自動売買に変えることができます。 Atomic Analyst は、リペイントなし、再描画なし、遅延なしの Price Action トレーディングインジケーターで、手動取引、シグナルの明確化、EA 自動化のために設計されています。 User manual: settings, inputs and strategy. & User Manual PDF . 価格行動、強さ、モメンタム、マルチタイムフレーム方向、高度なフィルターを分析し、トレーダーがノイズを減らし、弱いセットアップを避け、より構造化された取引判断を行えるようにします。 こ

EA Spectr is an automated professional multi-currency expert advisor that designed for long-term profitable trading. The EA continuously controls price movements and makes accurate trades based on market patterns, trend and technical indicators. The Ea contains a flexible news filter, high spread protection, separate time and days trading filters and allows to work with automatic and fixed trading lots. Each Ea trade is covered by stop loss and take profit levels. The EA does not use grid, mart

Scalper Inside PRO は日中トレンドの分析を助け、エントリー前にトレードを組み立てられるインジケーターです。中核となるのは、相場をより正確に読むための3つの専用ストラテジー。シグナルが出た瞬間に方向を自動で判断し、主要な価格帯を計算するので、想定エントリーポイント、予想ストップロス、複数の利確レベルを前もって確認できます。詳細なパフォーマンス統計が、各銘柄とストラテジーが過去にどう機能したかを示し、今の相場に合った資産選びを助けます。単体のスキャルピングツールとしても、あなたのシステムの一部としても、自作 EA のベースとしても使えます。MetaTrader 4 プラットフォームで動作します。 インジケーターはエントリー、3つの利確レベル - TP1、TP2、TP3、そして任意のストップロスをチャート上に直接表示します。自作の矢印インジケーターを接続し、その統計と収益性を検証することも可能です。 ご購入後は直接ご連絡ください。専用のボーナス add-ons、実トレードでの活用に関する追加情報、そしてご自身のトレードシステムや EA への正しい接続のサポートをお渡しします

高い成功率で Indirection Break Out Signal を検出します。 価格は8月15日までに119$に値上がりします Market Structure Break Out (MSB) の紹介 , このインジケーターは MT4およびMT5プラットフォーム 向けに設計された高度なツールで、トレーダーが価格構造の視点から市場の動きを把握できるよう支援します。矢印とアラートを使用して、主要な トレーディングシグナル を識別・強調表示し、 トレンド方向 および 逆方向 (反転シグナル)の両方に対応します。 際立った機能の一つは、 未突破の供給・需要ゾーンを描画する 能力であり、トレーダーに重要な価格エリアへの明確な洞察を提供します。さらに、 ライブバックテスト機能 により、ユーザーはチャート上で直接インジケーターの過去のパフォーマンスを確認でき、シグナルへの透明性と自信を提供します。 受け取り方法は?
ここをクリックしてEAをダウンロード 。このEAは、すでにMarket Structure Break Outインジケーターを購入済みの場合にのみ動作します。 無料のMarke

Mountain Gold is a fully automated EA designed to trade GOLD . It is based on machine learning cluster analysis and genetic algorithms. EA contains self-adaptive market algorithm, which uses price action patterns and standard trading indicators. Expert showed stable results on XAUUSD in 2011-2020 period. No dangerous methods of money managment used. Suitable for any broker conditions.
Advantages Easy to configure Suitable for beginners and professionals It can work with any financial inst

Angle Iindicator - ターは、方向転換とトレンド確認のためのインジケーターです。
価格の動きを分析し、チャート上のピークとトラフを特定することで、反転ポイントを検出します。
トレンド方向をサポートします。
あらゆる金融商品と時間枠で使用できます。
内部パラメーターは既に設定済みです。インジケーターをチャートに配置し、「乗数」パラメーターを希望の結果に合わせて設定するだけで使用できます。
インジケーターは現在のローソク足上に矢印を生成します。ローソク足の形成中は、矢印が点滅することがあります。ローソク足が確定しても、矢印は過去の履歴には再描画されません。
方向転換のアラートが提供されます。
単独で使用することも、トレーディングシステムと組み合わせて使用することもできます。
インジケーターを正しく使用するには、「乗数」パラメーターを設定する必要があります。
インジケーターの結果は、チャート上で反転角度がどのように生成されるかによって異なります。
「乗数」パラメーターは連続するローソク足の構造を決定し、反転ポイントの頻度を決定します。 0.1から100

BUY 1 and GET 1 FREE - Promotion!
Buy Infinity Trader EA with a huge –60% discount and GET 1 FREE EA by your choice! Promo Price: $217
(Regular Price: $547 — You Save $330!) After purchase contact me to get your GIFT EA! You can also contact me to get the list of available GIFT EAs! Infinity Trader EA Live Results: https://www.mql5.com/en/signals/2290275 Infinity Trader EA seamlessly integrates the strengths of Chat GPT and Gemini AI, providing unparalleled market insights and in-depth funda

Game Change EAは、Game Changerインジケーターをベースにしたトレンドフォロー型の取引システムです。赤いドットが形成されると自動的に売り、トレンドの終了を示す黄色のXが表示されるまで売り方向に進みます。買い取引にも同じロジックが適用されます。青いドットが表示されるとEAは買いを開始し、黄色のXが検出されるとすぐに買いサイクルを終了します。
このEAはあらゆる通貨ペアとあらゆる時間枠に適していますが、M15時間枠のxauusdなどの強いトレンド銘柄で特に優れたパフォーマンスを発揮します。 リアルタイムの結果はここで確認できます。 個人ボーナスを獲得するには、購入後すぐにご連絡ください。 設定・マニュアルはこちら 設定 Open new series – true/false - 新たな一連の注文の始まり。
Trade Buy - EAが購入できるようにする
Trade Sell - EAの販売を許可する
Support manual orders – true/false – EAが手動注文を制御できるようにする
Use hedge - EAが買いと売りの両方

PRO ADVANCED MULTI SCALPING EA は、完全自動のマルチペア取引システムで、非常に安全で着実な成長を遂げています。
この収益性の高いスキャルピングEAは、現在市場で最も安定したシステムの一つです。月間約60~90回の取引で運用可能です。
テストと取引用のEA設定ファイルをダウンロードしてください: USDCHF Set_file GBPCHF Set_file GBPCAD Set_file GBPAUD Set_file EURCHF Set_file EURCAD Set_file EURAUD Set_file AUDCAD Set_file
EAの特徴: - 調整可能なボラティリティ - 適応型ストップロス - 固定ストップロスオプション - システムは安全で、グリッドやマーチンゲール法などの危険な手法は使用していません。各注文には、アカウント保護のための独自のストップロスが設定されています。 - このEAは非常に使いやすく、FXのプロと初心者の両方が使用できます。 - ロボットがすべてを自動的に実行します。必要なのは、適切なリスク(デフォルト