MA Revolution is upgraded version of standard Moving Average. With the current upgrade moving average line got more sensitive with different market conditions. It gets more flexible by decreasing default period step by step while market is sharp and incrasing period back to default period step by step while market is normal again.
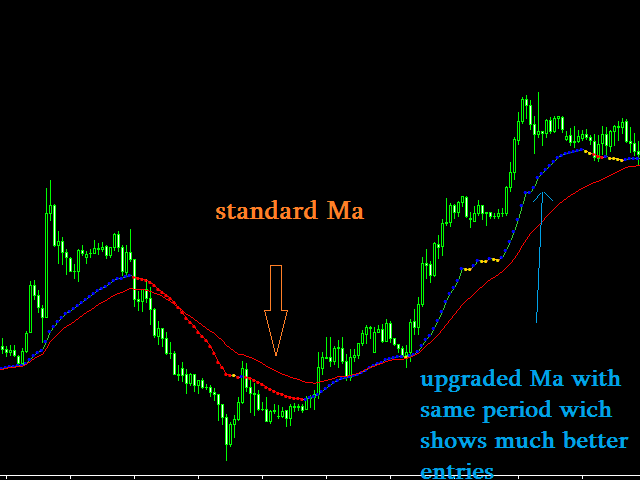
testing of the idea shows that this upgraded version gives much more acuracy for detecting market direction, changes in direction are shown much early than standard Ma shows with one frozen period.
Period change is linked to Volatility detection indicator line. When volatility indicator is rising, the period of Ma is decreasing until volatility is in up mode and the period is increasing back to normal when volatility line is decreasing.
MA revolution contains next input parameters:
MaPeriodStart - default period of Ma which should decrease when market is volatile.
MaPeriodEnd - minimum period till where decreasing is possible.
MaPeriodStep - period point by what default period will be decreased step by step till the End Period.
MaMode -
MaPrice -
VolTF - Volatility indicator timeframe according which to change Ma Period (VolTF should be Higher than timeframe you wish to use for Ma Revolution)
VolPeriod - Period of Volatility Indicator.
How to use: If you wish to use MA Revolution on M5-M15-M30 timeframes, VolTF (timeframe of Volatility indicator) should be used H1 or H4 It should be always higher than timeframe used for MA Revolution to appear.
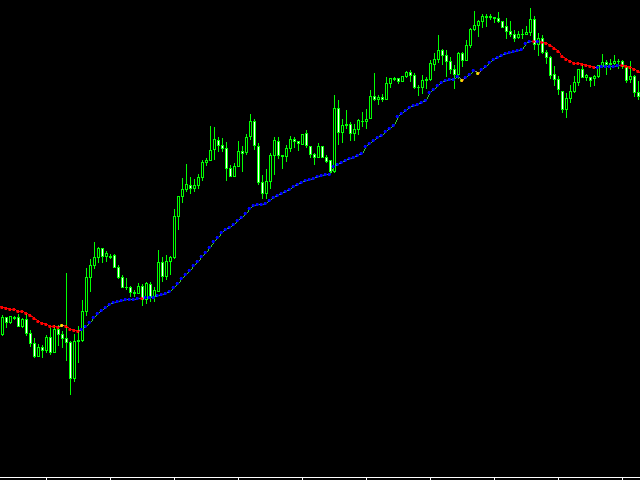
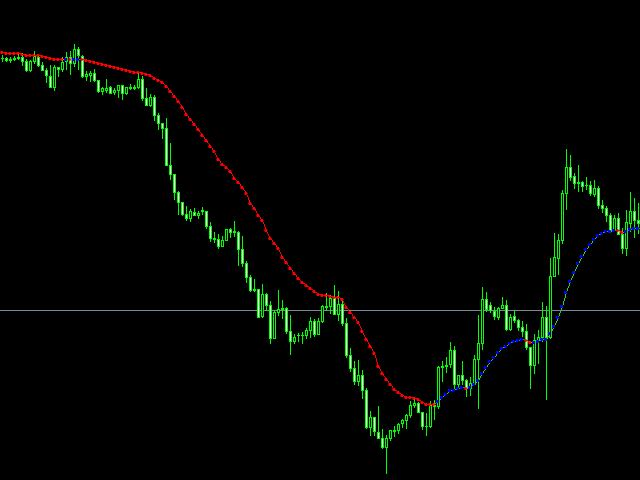
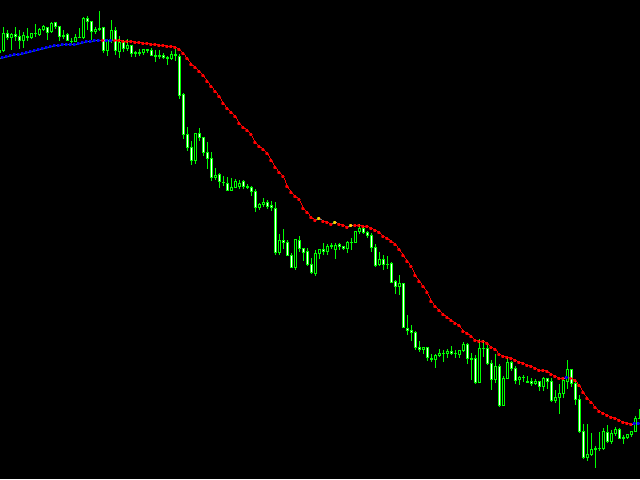
MA revolution line changes color to Green when the line is going up and candle is over the line.
MA Revolution line changes color to Red when the line is going down and candle is lower the line.
MA Revolution line changes color to Yellow when the line is going down but candle is over the line or the line is going up but candle is lower the line.

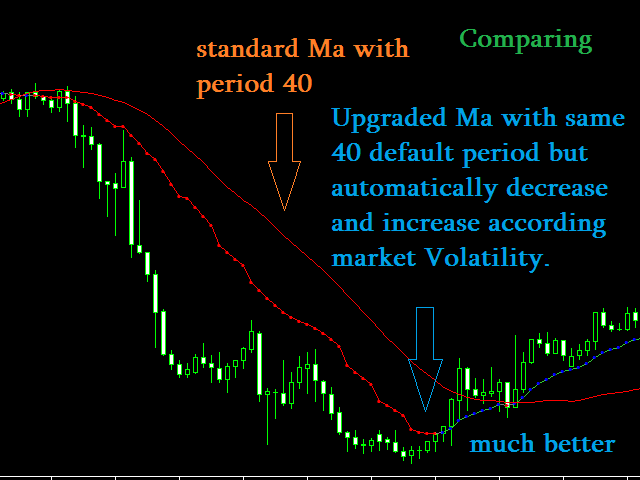


much more responsive