Order Book

Combinalo con Delta Footprint Chart per un quadro completo del profilo del volume di mercato:

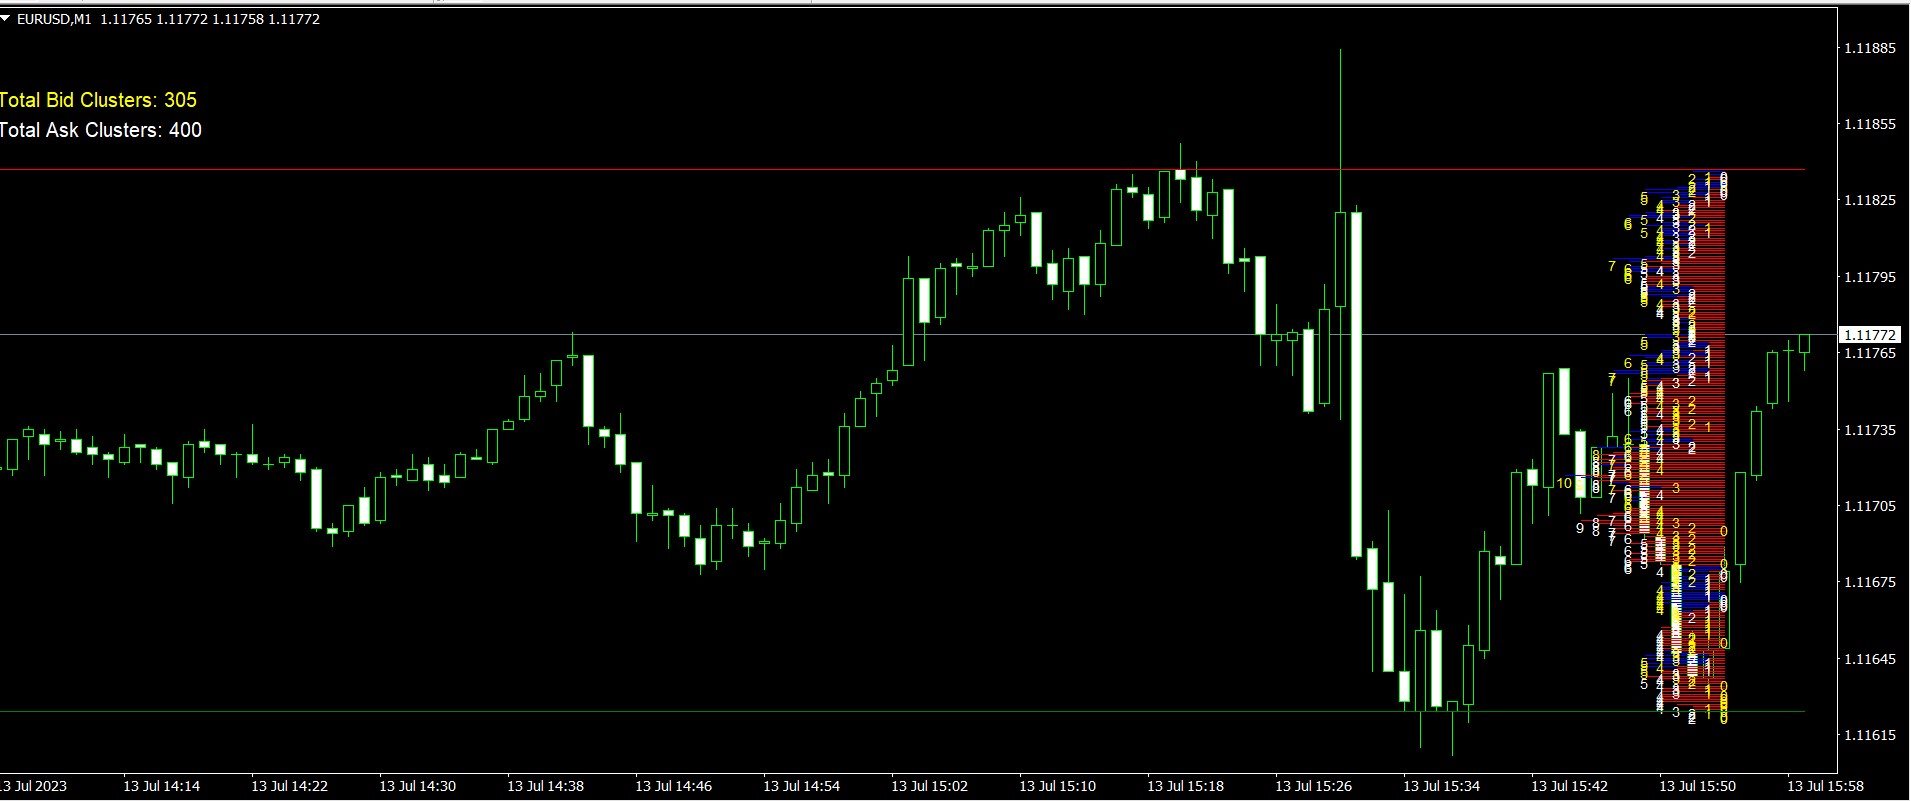
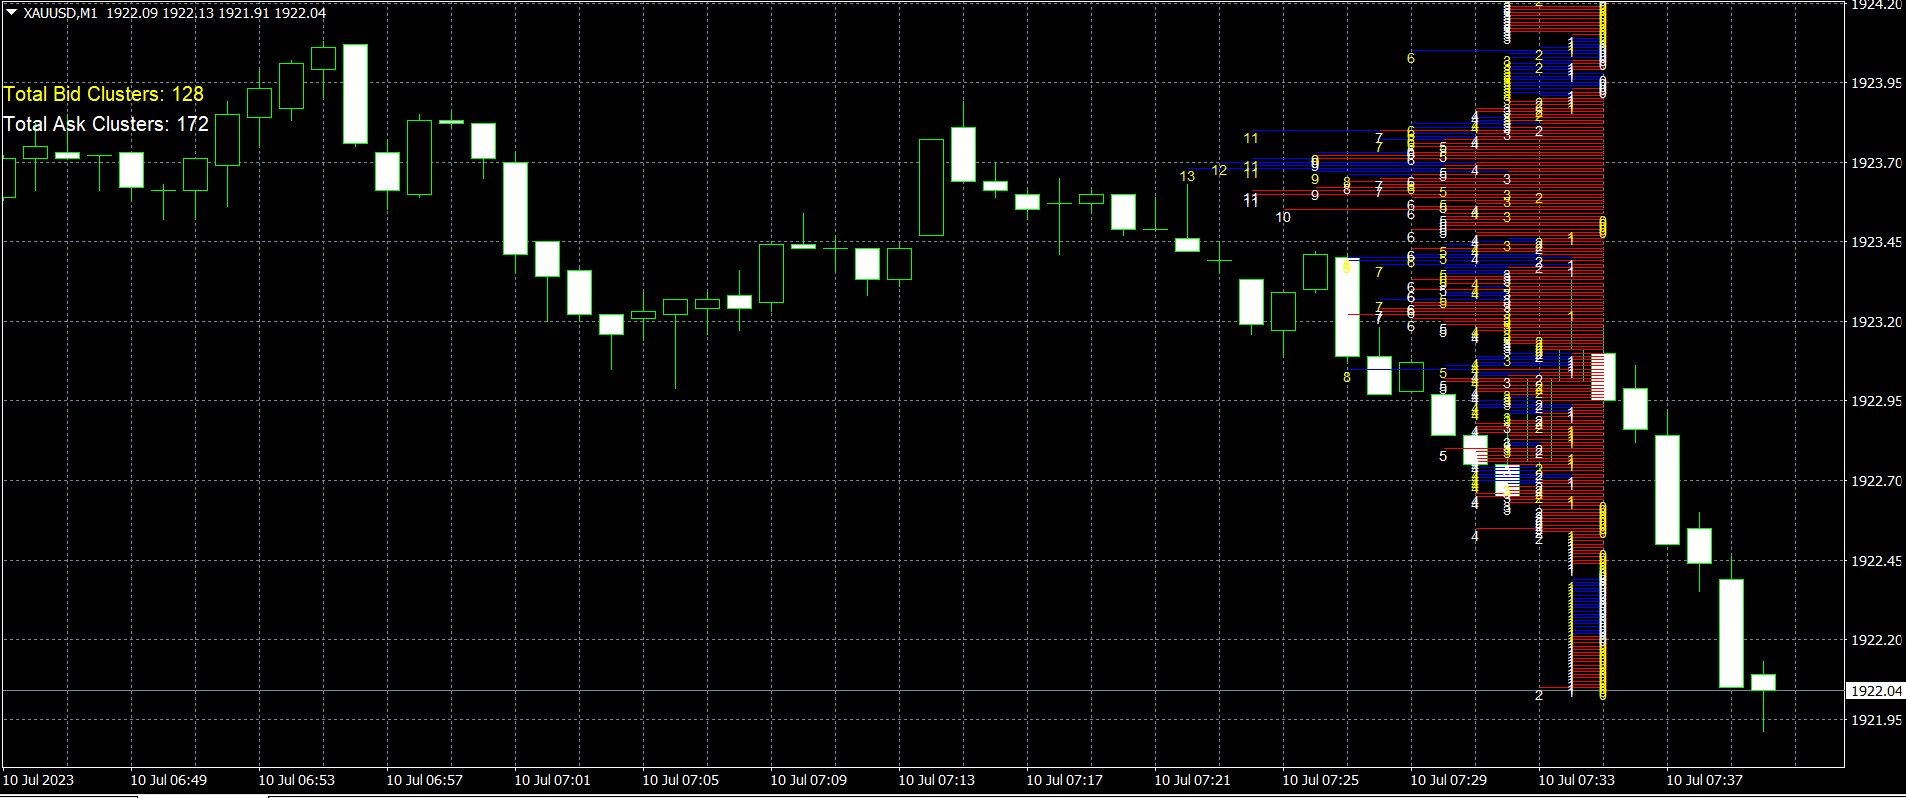
L'indicatore "Order Book" visualizza un istogramma sul grafico dei prezzi che rappresenta i cluster di volume bid e ask.

  L'indicatore analizza i dati storici sui prezzi e calcola i cluster di volume bid e ask per ogni livello di prezzo all'interno di un numero specificato di barre. I cluster del volume bid sono mostrati in blu, mentre i cluster del volume ask sono mostrati in rosso.

L'indicatore fornisce informazioni sulla distribuzione dei volumi bid e ask a diversi livelli di prezzo. I trader possono utilizzare queste informazioni per identificare aree di elevata attività di trading e potenziali livelli di supporto/resistenza. Le barre dell'istogramma rappresentano il numero di cluster bid e ask a ciascun livello di prezzo, fornendo una rappresentazione visiva della liquidità del mercato.

Oltre alle barre dell'istogramma, l'indicatore mostra anche etichette di testo che mostrano il numero totale di cluster bid e ask nel periodo analizzato. Queste etichette vengono aggiornate in tempo reale man mano che diventano disponibili nuovi dati sui prezzi.
Prodotti consigliati
BoxChart MT4
Evgeny Shevtsov
4.4 (5)
The market is unfair if only because 10% of participants manage 90% of funds. An ordinary trader has slim changes to stand against these "vultures". This problem can be solved. You just need to be among these 10%, learn to predict their intentions and move with them. Volume is the only preemptive factor that faultlessly works on any timeframe and symbol. First, the volume appears and is accumulated, and only then the price moves. The price moves from one volume to another. Areas of volume accumu
Volume Profile Sniper v11. 1 è uno strumento completo per l'analisi di mercato Un approccio professionale al trading Volume Profile Sniper v11.1 integra più di 15 filtri chiave in un unico indicatore, fornendo segnali chiari basati su una valutazione completa della situazione del mercato. Caratteristiche principali Analisi dello squilibrio di volume-l'algoritmo calcola la percentuale di acquirenti e venditori in ciascuna candela, segnalando la predominanza di una delle parti (soglia configurab
Volume Delta Scanner MT4
Mariusz Franciszek Szczepanczyk
Scanner delta di volume MT4 Volume Delta Scanner è un indicatore di mercato in tempo reale per MetaTrader 4 che monitora simultaneamente più simboli e intervalli temporali da un unico pannello. Invece di passare manualmente da un grafico all'altro, si ottiene una panoramica immediata della pressione di acquisto e vendita sull'intera watchlist in un colpo d'occhio. L'indicatore si basa sulla logica del Volume Delta: calcola la differenza tra pressione di acquisto e di vendita in base alla stru
Blahtech Market Profile
Blahtech Limited
4.53 (15)
Was: $249  Now: $99   Market Profile defines a number of day types that can help the trader to determine market behaviour. A key feature is the Value Area, representing the range of price action where 70% of trading took place. Understanding the Value Area can give traders valuable insight into market direction and establish the higher odds trade. It is an excellent addition to any system you may be using. Blahtech Limited presents their Market Profile indicator for the MetaTrader community. Ins
L'indicatore costruisce le quotazioni attuali, che possono essere confrontate con quelle storiche e su questa base fanno una previsione del movimento dei prezzi. L'indicatore ha un campo di testo per una rapida navigazione fino alla data desiderata. Opzioni: Simbolo - selezione del simbolo che visualizzerà l'indicatore; SymbolPeriod - selezione del periodo da cui l'indicatore prenderà i dati; IndicatorColor - colore dell'indicatore; HorisontalShift - spostamento delle virgolette disegnate d
MR Volume Profile 4
Sergey Khramchenkov
The "MR Volume Profile 4" indicator is a charting tool that displays trading volume at different price levels rather than time intervals. A key concept in volume profile is the point of control (POC)—the price level with the highest volume traded during the session or time range. While tools like VWAP or OBV provide volume trends, the "MR Volume Profile 4" indicator offers granular detail about where the most market activity occurs at specific price levels. This makes it a more precise tool for
VPO Profile MT4
Kyra Nickaline Watson-gordon
5 (2)
Definition : VPO is a Volume Price Opportunity. Instead of using bars or candles with an Open, High, Low, and Close price, each "bar" in a Market Profile is represented by horizontal bars against the price It is called Market Profile terminology. In other words volume-price-opportunity (VPO) profiles are histograms of how many volumes were traded at each price within the span of the profile. By using a VPO chart, you are able to analyze the amount of trading activity, based on volume, for each
Un indicatore tecnico che calcola le sue letture sui volumi di scambio. Sotto forma di istogramma, mostra l'accumulo della forza del movimento dello strumento di trading. Dispone di sistemi di calcolo indipendenti per le direzioni rialziste e ribassiste. Funziona su qualsiasi strumento di trading e intervallo di tempo. Può integrare qualsiasi sistema di trading. L'indicatore non ridisegna i suoi valori, i segnali appaiono sulla candela corrente. È facile da usare e non carica il grafico, non ric
Market Dynamics
Thomas Bradley Butler
Market Dynamics è per lo scalping delle tendenze. Il blu è comprare e il rosso è vendere. Le linee sono aree di consolidamento dei prezzi e le normali candele da bar non sono decise. Il prezzo si consoliderà tra le linee di supporto e resistenza e quindi si verificherà un breakout dell'azione dei prezzi fuori dalle aree. Pic aree per scalpare sopra o sotto e seguire le tendenze principali o scambi giornalieri per scalpi.
Daily Candle Predictor è un indicatore che prevede il prezzo di chiusura di una candela. L'indicatore è destinato principalmente all'uso sui grafici D1. Questo indicatore è adatto sia per il trading forex tradizionale che per il trading di opzioni binarie. L'indicatore può essere utilizzato come sistema di trading autonomo o può fungere da aggiunta al sistema di trading esistente. Questo indicatore analizza la candela corrente, calcolando alcuni fattori di forza all'interno del corpo della cande
VolumeProfile
Robert Hess
3.8 (5)
Descption: The Volume Profile displays detailed informations of historical trading activities at certain price levels (Market Profile). So you can locate the areas with the best prices in the market and get an advantage about other market participants. Features: Customizable Volume Profile / Market Profile Shows the "fair" Value Area with 70% of all Volume Shows critical low volume zones Shows VPOC, VAL and VAH Points Works on all timeframes Also available for MT5 ( https://www.mql5.com/en/mark
Questo indicatore è progettato per determinare l'ora della maggiore attività di trading in un giorno. Dopo questo calcolo, l'indicatore crea i livelli di trading più significativi. Il confronto di questi livelli con l'effettiva azione dei prezzi può fornire informazioni sulla forza e sulla direzione delle tendenze del mercato. Caratteristiche dell'indicatore Il periodo di tempo deve essere inferiore a D1. Tempi consigliati: M15, M30 e H1. I tempi sopra H1 possono dare un quadro molto approssim
Blahtech Supply Demand
Blahtech Limited
4.58 (36)
Was: $299  Now: $99   Supply Demand uses previous price action to identify potential imbalances between buyers and sellers. The key is to identify the better odds zones, not just the untouched ones. Blahtech Supply Demand indicator delivers functionality previously unavailable on any trading platform. This 4-in-1 indicator not only highlights the higher probability zones using a multi-criteria strength engine, but also combines it with multi-timeframe trend analysis, previously confirmed swings
Italian Questo indicatore funge da assistente avanzato per l'analisi dei grafici per i trader che amano operare con i Pattern Grafici (Chart Patterns). È progettato per ridurre il carico dell'analisi visiva e aumentare la precisione nell'ottenere profitti. Caratteristiche principali di questo indicatore dal punto di vista dell'utilizzo pratico: 1. Rilevamento automatico dei pattern (Automated Pattern Detection) Risparmia tempo e riduce le distorsioni (Bias): Non è necessario tracciare manualment
VN Trade Panel II
Vyacheslav Nekipelov
4 (1)
The new version of the trading panel, which now has the ability to separately close Buy and Sell orders, display targets for all orders on the chart, as well as the ability to use the panel to trade with brokers working on the FIFO rule. Also, the new version adds option buttons for separate management of open orders. It has a convenient visualized interface and intuitive control without a lot of additional tabs to which traders have to be distracted and switch their attention. Thanks to this,
Support and Resistance Zones MultiTimeframe
Mohamed Gamal Abdelnasser Yous Hashesh
A powerful indicator that highlights key market zones and helps traders identify potential opportunities across multiple timeframes. Designed for clarity and efficiency, it provides real-time alerts to keep you informed of important price levels. Key Features: Works on multiple timeframes: M1, M5, M15, M30, H1, H4, D1, W1, MN1. Customizable zone colors for each timeframe. Real-time alerts and notifications when price reaches significant zones. Automatically manages chart objects to keep your wo
Unlike standard Volume Profiles that aggregate tick volume by price level, this indicator counts the number of candles that fall within each level's range. The profile accumulates data only from the moment of launch and categorizes it into Buy and Sell by analyzing the direction of every tick. It does not repaint. The indicator identifies horizontal levels where the price covers the "greatest distance with the fewest actions" (on average per candle). Initially, when first attached to the chart,
Introduction It is common practice for professional trades to hide their stop loss / take profit from their brokers. Either from keeping their strategy to the themselves or from the fear that their broker works against them. Using this indicator, the stop loss / take profit points will be drawn on the product chart using the bid price. So, you can see exactly when the price is hit and close it manually.  Usage Once attached to the chart, the indicator scans the open orders to attach lines for t
Il WaveTrend Oscillator MT4 è un potente indicatore di trading progettato per migliorare la tua analisi di mercato identificando cambiamenti di momentum e potenziali inversioni di tendenza. Ideale per trader di tutti i livelli, questo strumento offre preziose intuizioni sulle condizioni di ipercomprato e ipervenduto in vari mercati, tra cui forex, criptovalute e materie prime. Con la sua capacità di generare segnali di acquisto e vendita accurati, il WaveTrend Oscillator MT4 consente ai trader d
EZZ Zig Zag MT4
Paulo Rocha
5 (1)
EZZ Elite Zig Zag is an indicator for the MetaTrader 4 terminal. This indicator traces the peak of the trend based on the market reversal, thus showing various opportunities in the financial market. EZZ Elite Zig Zag is a visual tool, intuitive, and easy to understand and use.  Test it Yourself by Downloading it for Free. Author Paulo Rocha all rights reserved
VR Grid
Vladimir Pastushak
5 (3)
L'indicatore Griglia VR è progettato per creare una griglia grafica con impostazioni definite dall'utente. A differenza della griglia standard , VR Grid viene utilizzata per costruire livelli circolari . A seconda della scelta dell'utente, il passaggio tra i livelli rotondi può essere arbitrario. Inoltre, a differenza di altri indicatori e utilità, VR Grid mantiene la posizione della griglia anche quando cambia l'intervallo di tempo o si riavvia il terminale. È possibile ottenere impostazioni, f
FREE
This multicurrency indicator is the Lite version of the Cosmic Diviner Reversal Zone Pro indicator. The indicator is based on original formulas for analyzing the volatility and price movement strength. This allows determining the overbought and oversold states of instruments with great flexibility, as well as setting custom levels for opening buy or sell orders when the overbought or oversold values of the instruments reach a user-defined percentage. A huge advantage of Reversal Zone Lite is the
Simply The Best Pro
Szymon Palczynski
5 (1)
This indicator displays the histogram and arrows on chart. When Simple The Best Pro are placed on a chart, they identify the trend.  The color of may be blue or red. The blue color stands for upside moves and the red color stands for downside trends. The indicator offers to set Stop Loss (SL) and  Take Profit (TP)  setting. The default value is ATR. Indicator has automatic optimization. The STB is a unique indicator that shows the tendency (button Bars) of a particular signals. The STB tells us
Force Price Power
Jesus Daniel Quiroga
Force Price Power is a very powerful indicator that provides valuable and useful information about the real force of the price, dynamically averaging the volume of operations that are taking place in the market. This indicator is special to identify the dynamic force of the price. The zero distance (either up from zero or down from zero) would indicate the degree of strength and power, whether bearish or bullish.
An indicator of patterns #24, #25, #26 and #27 ("Head and Shoulders", "Complex Head and Shoulders") from Encyclopedia of Chart Patterns by Thomas N. Bulkowski. Parameters: Alerts - show alert when an arrow appears   Push - send a push notification when an arrow appears (requires configuration in the terminal) PeriodBars - indicator period K - an additional parameter that influences the accuracy of pattern shape recognition. The smaller the value is, the smoother the row of peaks/valleys should
Quantum Volume Point of Control Indicator
QUANTUM TRADING SOFTWARE LIMITED
5 (1)
The Quantum VPOC indicator has been developed to expand the two dimensional study of volume and price, to a three dimensional one which embraces time. The volume/price/time relationship then provides real insight to the inner workings of the market and the heartbeat of sentiment and risk which drives the price action accordingly. The Quantum VPOC indicator displays several key pieces of information on the chart as follows: Volume Profile - this appears as a histogram of volume on the vertical pr
GND Tail Candle
Nguyen Dang Giang
A tall upper shadow occurs when the price moves during the period, but goes back down, which is a bearish signal. A tall lower shadow forms when bears push the price down, but bulls pull it back up, which leaves a long line or shadow. This is considered a bullish signal. Some technical analysts believe a tall or long shadow means the stock will turn or reverse. Some believe a short or lower shadow means a price rise is coming. In other words, a tall upper shadow means a downturn is coming, while
This indicator is a conventional analytical tool for tick volumes changes. It calculates tick volumes for buys and sells separately, and their delta on every bar, and displays volumes by price clusters (cells) within a specified bar (usually the latest one). The algorithm used internally is the same as in the indicator VolumeDelta , but results are shown as cumulative volume delta bars (candlesticks). Analogous indicator for MetaTrader 5 exists - VolumeDeltaBars . This is a limited substitution
TWO PAIRS SQUARE HEDGE METER INDICATOR Try this brilliant 2 pairs square indicator It draws a square wave of the relation between your two inputs symbols when square wave indicates -1 then it is very great opportunity to SELL pair1 and BUY Pair2 when square wave indicates +1 then it is very great opportunity to BUY pair1 and SELL Pair2 the inputs are : 2 pairs of symbols         then index value : i use 20 for M30 charts ( you can try other values : 40/50 for M15 , : 30 for M30 , : 10 for H1 ,
Trend Deviation
VLADISLAV AKINDINOV
Trend indicator with calculation of dynamic levels and signaling their intersection. Description of input parameters: StepTF = true; - Calculation of the indicator by closing the bar (true) or by each tick (false) BarsCount = 300; - Number of settlement bars Price = PRICE_CLOSE; - Type of price used TimeFrame = PERIOD_CURRENT; - Estimated timeframe TrendPeriod = 9; - Trend calculation period TrendDeviations = 4.9; - coefficient of deviation PeriodTrendSmooth = 1; - Trend smoothing perio
Gli utenti di questo prodotto hanno anche acquistato
Neuro Poseidon MT4
Daria Rezueva
4.95 (37)
Neuro Poseidon is a new indicator by Daria Rezueva. It combines precise trading signals with adaptive TP/SL levels - creating best possible trades as a result! Message me and get  Neuro Poseidon Assistant  as a gift to automize your trading process! What makes it stand out? 1. Proven profitability on all assets and timeframes 2. Only confirmed BUY and SELL signals present on the chart 3. Adaptive TP & SL levels generated by the software for each trade 4. Easy to understand - suitable for all
Gann Made Easy
Oleg Rodin
4.84 (165)
Gann Made Easy è un sistema di trading Forex professionale e facile da usare che si basa sui migliori principi del trading utilizzando la teoria di mr. WD Gann. L'indicatore fornisce segnali ACQUISTA e VENDI accurati, inclusi i livelli di Stop Loss e Take Profit. Puoi fare trading anche in movimento utilizzando le notifiche PUSH. CONTATTAMI DOPO L'ACQUISTO PER RICEVERE GRATUITAMENTE LE ISTRUZIONI DI TRADING E OTTIMI INDICATORI EXTRA! Probabilmente hai già sentito parlare molte volte dei metodi d
Trend Catcher ind
Ramil Minniakhmetov
5 (3)
INDICATORE TREND CATCHER L'indicatore Trend Catcher analizza i movimenti dei prezzi di mercato, utilizzando una combinazione di indicatori di analisi del trend proprietari dell'autore e personalizzati. Identifica la vera direzione del mercato filtrando il rumore a breve termine e concentrandosi sulla forza del momentum sottostante, sull'espansione della volatilità e sul comportamento della struttura dei prezzi. Utilizza inoltre una combinazione di indicatori personalizzati di smoothing e filtr
Dynamic Forex28 Navigator
Bernhard Schweigert
4.43 (7)
Dynamic Forex28 Navigator - Lo strumento di trading Forex di nuova generazione. ATTUALMENTE SCONTATO DEL 49%. Dynamic Forex28 Navigator è l'evoluzione dei nostri indicatori popolari di lunga data, che combinano la potenza di tre in uno: Advanced Currency Strength28 Indicator (695 recensioni) + Advanced Currency IMPULSE con ALERT (520 recensioni) + CS28 Combo Signals (Bonus). Dettagli sull'indicatore https://www.mql5.com/en/blogs/post/758844 Cosa offre l'indicatore di forza di nuova generazione?
M1 Sniper
Oleg Rodin
5 (24)
M1 SNIPER è un sistema di indicatori di trading facile da usare. Si tratta di un indicatore a freccia progettato per l'intervallo temporale M1. L'indicatore può essere utilizzato come sistema autonomo per lo scalping sull'intervallo temporale M1 e come parte del tuo sistema di trading esistente. Sebbene questo sistema di trading sia stato progettato specificamente per il trading sull'intervallo temporale M1, può comunque essere utilizzato anche con altri intervalli temporali. Inizialmente ho pro
MetaBands M4
Vahidreza Heidar Gholami
3.5 (6)
MetaBands uses powerful and unique algorithms to draw channels and detect trends so that it can provide traders with potential points for entering and exiting trades. It’s a channel indicator plus a powerful trend indicator. It includes different types of channels which can be merged to create new channels simply by using the input parameters. MetaBands uses all types of alerts to notify users about market events. Features Supports most of the channel algorithms Powerful trend detection algorith
Advanced Supply Demand
Bernhard Schweigert
4.91 (300)
Speciale Trading- SCONTO DEL 30% La soluzione migliore per qualsiasi trader principiante o esperto! Questo indicatore è uno strumento di trading unico, di alta qualità e conveniente, perché abbiamo incorporato una serie di funzionalità proprietarie e una nuova formula. Con questo aggiornamento, potrai visualizzare doppie zone di timeframe. Non solo potrai visualizzare un TF più alto, ma anche entrambi, il TF del grafico e il TF più alto: MOSTRA ZONE ANNIDATE. Tutti i trader che operano con Of
Scalper Inside PRO
Alexey Minkov
4.68 (69)
Scalper Inside PRO Scalper Inside PRO is an intraday trend and scalping indicator that uses exclusive built-in algorithms to evaluate market direction and key target levels. The indicator automatically calculates entry and exit points and several profit target levels, and it shows detailed performance statistics, so you can see how different instruments and strategies behaved on historical data. This helps you select instruments that fit current market conditions. You can also connect your own a
Genesis Matrix Pro is a professional multi-timeframe trend detection indicator designed to help traders identify high-quality market alignment with clarity and structure. It combines 12 different technical indicators into one visual alignment matrix, allowing traders to quickly see when market conditions are bullish, bearish, or neutral. A signal is generated only when the selected strategies are aligned, helping reduce noise and improve decision-making. PLEASE CONTACT ME AFTER PURCHASE TO GET
L'indicatore Quadrato di Gann è uno strumento potente di analisi di mercato basato sull'articolo "Formula Matematica per le Previsioni di Mercato" scritto da W.D. Gann. Questo strumento utilizza concetti matematici e teorie di Gann per effettuare un'analisi precisa del mercato. Utilizza i quadrati di 144, 90, 52 e anche il quadrato di 9. Inoltre, integra il metodo del  per il quadrato di 9 e la sua relazione con canali e modelli stellari di quel quadrato. Manuale Utente e Applicazione: Prima di
Breakout Arrows Mt4
Michael Oko Oboh
5 (1)
Trend Breakout Arrows Indicator The Trend Breakout Arrows Indicator is a momentum-based signal tool designed to identify potential bullish and bearish breakout opportunities. It displays clear arrow signals directly on the price chart, helping traders quickly recognize possible trend changes and continuation setups. Up Arrow (Buy Signal) A magenta up arrow appears below a candle when bullish momentum begins to strengthen. This signal indicates that buying pressure may be overtaking selling press
Neo Wave PRO
Nikolay Raykov
5 (1)
Price & Time Market Structure Indicator A professional market structure tool that analyzes waves through both price and time — not price alone. Main Description NeoWave PRO is a professional market structure indicator for MetaTrader 4 designed for traders who want to move beyond traditional one-dimensional wave tools such as ZigZag, swing indicators, and basic high/low systems. Most wave indicators analyze only one thing: Price. But a real market wave is not only a price movement. A true wave de
Questo prodotto è stato aggiornato per il mercato 2026 e ottimizzato per le ultime build di MT5. AVVISO DI AGGIORNAMENTO PREZZO: Smart Trend Trading System è attualmente disponibile a $99 . Il prezzo aumenterà a $199 dopo i prossimi 30 acquisti . OFFERTA SPECIALE: Dopo aver acquistato Smart Trend Trading System, inviami un messaggio privato per ricevere Smart Universal EA GRATIS e trasformare i tuoi segnali Smart Trend in operazioni automatiche. Smart Trend Trading System è un sistema di tradin
BTMM State Engine Pro is a MetaTrader 4 indicator for traders who use the Beat The Market Maker approach: Asian session context, kill zone timing, level progression, peak formation detection, and a multi-pair scanner from a single chart. It combines cycle state logic with a built-in scanner dashboard so you do not need the same tool on many charts at once. What it does Draws the Asian session range; session times can follow broker server offset or be set in inputs. Tracks level progression (L
IQ FX Gann Levels a precision trading indicator based on W.D. Gann’s square root methods . It plots real-time, non-repainting support and resistance levels to help traders confidently spot intraday and scalping opportunities with high accuracy. William Delbert Gann (W.D. Gann) was an exceptional market analyst, whose trading technique was based on a complex blend of mathematics, geometry, astrology, and ancient mathematics which proved to be extremely accurate. Setup & Guide:  Download  MT5 Ver
PRO Renko System
Oleg Rodin
5 (30)
PRO Renko System è un sistema di trading altamente accurato appositamente progettato per il trading di grafici RENKO. Questo è un sistema universale che può essere applicato a vari strumenti di trading. Il sistema neutralizza efficacemente il cosiddetto rumore di mercato che consente di accedere a segnali di inversione accurati. L'indicatore è molto facile da usare e ha un solo parametro responsabile della generazione del segnale. Puoi facilmente adattare lo strumento a qualsiasi strumento di
GOLD Impulse with Alert
Bernhard Schweigert
4.67 (12)
Questo indicatore è una super combinazione dei nostri 2 prodotti Advanced Currency IMPULSE with ALERT  +   Currency Strength Exotics . Funziona per tutti i time frame e mostra graficamente l'impulso di forza o debolezza per le 8 valute principali più un simbolo! Questo indicatore è specializzato nel mostrare l'accelerazione della forza delle valute per qualsiasi simbolo come oro, coppie esotiche, materie prime, indici o futures. Primo nel suo genere, qualsiasi simbolo può essere aggiunto all
ATTUALMENTE SCONTATO DEL 40% La soluzione migliore per ogni principiante o trader esperto! Questo indicatore è uno strumento di trading unico, di alta qualità e conveniente perché abbiamo incorporato una serie di caratteristiche proprietarie e una nuova formula. Con un solo grafico è possibile leggere la forza delle valute per 28 coppie Forex! Immaginate come migliorerà il vostro trading perché sarete in grado di individuare l'esatto punto di innesco di una nuova tendenza o di un'opportunità
The indicator scans for Dinapoli thrust pattern in multiple timeframes for the all markets filtered and shows the results on Dashboard. Key Features Dashboard can be used for all markets It can scan for thrust pattern on MN1, W1, D1, H4, H1, M30, M15 ,M5, M1 timeframes Ability to choose number of bars required above/below displaced moving average to define thrust Parameters UseMarketWatch: Set true to copy all symbols available in market watch MarketWatchCount : Set the number of symbols that
Enigmera
Ivan Stefanov
5 (8)
ENIGMERA: Il cuore del mercato Importante: La demo di MQL5.com funziona nel Strategy Tester e potrebbe non riflettere completamente le funzionalità di Enigmera. Consulta la descrizione, gli screenshot e il video per maggiori dettagli. Non esitare a inviarmi un messaggio se hai domande! Il codice dell'indicatore è stato completamente riscritto. La versione 3.0 aggiunge nuove funzionalità e corregge i bug accumulati dall'inizio dell'indicatore. Introduzione Questo indicatore e sistema di trading
Questo indicatore è un indicatore per l'analisi automatica delle onde perfetto per il trading pratico! Caso... Nota:   non sono abituato a usare nomi occidentali per la classificazione delle onde a causa dell'influenza della convenzione di denominazione di Tang Lun (Tang Zhong Shuo Zen), ho chiamato l'onda base come   penna   e la banda dell'onda secondaria come   segmento   At allo stesso tempo, il segmento ha la direzione del trend. La denominazione   è principalmente segmento di trend   (que
Introduction Harmonic Patterns are best used to predict potential turning point. Traditionally, Harmonic Pattern was identified manually connecting peaks and troughs points in the chart. Manual harmonic pattern detection is painfully tedious and not suitable for everyone. You are often exposed under subjective pattern identification with manual pattern detection. To avoid these limitations, Harmonic Pattern Plus was designed to automate your harmonic pattern detection process. The functionality
Current event:  https://c.mql5.com/1/326/A2SR2025_NoMusic.gif R. Cos'è l'A2SR ?   * È un indicatore tecnico leader (nessuna riverniciatura, nessun ritardo). -- Guida : -- su https://www.mql5.com/en/blogs/post/734748/page4#comment_16532516 -- e https://www.mql5.com/en/users/yohana/blog A2SR ha una tecnica speciale per determinare i livelli di supporto (domanda) e resistenza (offerta). A differenza del modo ordinario che abbiamo visto in rete, A2SR ha un concetto originale nel determinare i li
KT Alpha Hunter Arrows MT4
KEENBASE SOFTWARE SOLUTIONS
La maggior parte degli indicatori a frecce ti dà un segnale e poi ti lascia capire da solo tutto il resto. KT Alpha Hunter Arrows ti offre un piano di trading completo. Ogni freccia di segnale viene visualizzata con un piano già tracciato: linea di ingresso, stop loss, quattro livelli di take profit e un verdetto edge in tempo reale che ti indica se quel simbolo e quel timeframe meritano di essere tradati in quel momento. Il pacchetto include un Trade Manager EA che gestisce l’esecuzione dopo il
Market Structure Patterns MT4
Samuel Manoel De Souza
5 (18)
Market Structure Patterns   è un indicatore basato sui   Smart Money Concepts   che mostra gli   elementi SMC/ICT   che possono portare le tue decisioni di trading a un livello superiore. Approfitta di   alert ,   notifiche push   e   email   per essere avvisato quando si forma un elemento sul grafico, il prezzo supera un livello e/o entra in una zona. Gli sviluppatori possono accedere ai valori degli elementi dell’indicatore utilizzando le   variabili globali , consentendo l’automazione delle d
PZ ABCD Retracement
PZ TRADING SLU
4 (5)
Identify precise entry and exit points with AB=CD patterns This indicator finds AB=CD retracement patterns. The AB=CD Retracement pattern is a 4-point price structure where the initial price segment is partially retraced and followed by an equidistant move from the completion of the pullback, and is the basic foundation for all harmonic patterns. [ Installation Guide | Update Guide | Troubleshooting | FAQ | All Products   ] Customizable pattern sizes Customizable AC and BD ratios Customizable b
Trend Lines PRO
Roman Podpora
5 (1)
LINEE DI TENDENZA PRO       Aiuta a capire dove il mercato sta realmente cambiando direzione. L'indicatore mostra reali inversioni di tendenza e punti in cui i principali attori rientrano. Vedi  Linee BOS   Cambiamenti di tendenza e livelli chiave su timeframe più ampi, senza impostazioni complesse o rumore inutile. I segnali non vengono ridisegnati e rimangono sul grafico dopo la chiusura della barra. VERSIONE MT 5     -      Svela il suo massimo potenziale se abbinato all'indicatore   RFI LEVE
The Propfolio Master Suite is the ultimate all-in-one analytical workstation for professional traders. Combining the power of the Beat The Market Maker (BTMM) methodology, Smart Money Concepts (SND/Liquidity), and Advanced Volume Profile, this suite replaces multiple different indicators with one optimized engine. Monitor up to 14 pairs simultaneously from a single chart, instantly identify market cycles, and seamlessly map institutional footprints with the click of a button. The Command Center
Legacy of Gann
Pavel Zamoshnikov
4.83 (12)
The indicator very accurately determines the levels of the possible end of the trend and profit fixing. The method of determining levels is based on the ideas of W.D.Gann, using an algorithm developed by his follower Kirill Borovsky. Extremely high reliability of reaching levels (according to K. Borovsky  - 80-90%) Indispensable for any trading strategy – every trader needs to determine the exit point from the market! Precisely determines targets on any timeframes and any instruments (forex, met
RFI levels PRO
Roman Podpora
5 (1)
L'indicatore mostra accuratamente i punti di inversione e le zone di ritorno dei prezzi in cui il       Principali attori   . Vedi dove si formano le nuove tendenze e prendi decisioni con la massima precisione, mantenendo il controllo su ogni operazione. VERSION MT5     -     Rivela il suo massimo potenziale se combinato con l'indicatore   TREND LINES PRO Cosa mostra l'indicatore: Strutture di inversione e livelli di inversione con attivazione all'inizio di un nuovo trend. Visualizzazione dei l
Altri dall’autore
Black Gold M1
Thomas Bradley Butler
OPTIMIZE BEFORE BACKTEST AND USE Trade crude oil with this EA.  No EA turns hundreds into millions in a year or 2, This is a lie if presented this way.  Black Gold trades Brent Crude on 1 min charts.  It uses RSI, moving averages and directional indicators.  Try it out, load it onto the tester if you have the history and ability to trade Brent crude.    Adjust and optimize to get the most out of the expert advisor
ForexReversal
Thomas Bradley Butler
4 (1)
La pazienza è la chiave per uno scalping senza stress. Scambia le frecce quando vedi che supera la media mobile di 200 e fai una tendenza allargando o dall'ultimo punto di oscillazione senza alcun filtro per la media mobile. Bello per intervalli di tempo di 1 minuto, catturando lo slancio delle mosse intraday. Prendi 20 pip con facilità o rimani più a lungo per le tendenze più grandi, utilizzando i trailing stop. Guarda gli esempi nelle foto di operazioni davvero grandi da questo indicatore. I
NeuroScalper
Thomas Bradley Butler
5 (1)
Aggiornare! Le frecce sono state aggiunte ai livelli 100 e 200. Questo indicatore è accurato per l'accesso agli estremi e ai supporti per le posizioni di acquisto principalmente per intervalli di tempo di 1 minuto. È possibile utilizzare altri intervalli di tempo, ma i livelli sono diversi. È un oscillatore migliore e si confronta con gli altri per vedere la differenza. Commercio diurno utilizzando concetti di rete neuro. Questo indicatore utilizza forme elementari di reti neuronali per genera
VolumeDayTrader
Thomas Bradley Butler
DAYTRADING solo per AZIONI (CFD). Il trading richiede lavoro. Non ci sono scorciatoie o indicatori che ti diranno tutte le entrate e le uscite. Il profitto viene dallo stato d'animo. Gli indicatori sono strumenti da utilizzare insieme alla gestione del denaro e alla psicologia del successo. Trova gli squilibri nel profilo del volume. Squilibri di volume dei prezzi commerciali. Molti squilibri si verificano in chiusura e apertura e notizie. Guarda gli acquirenti rispetto ai venditori nelle azi
GoldBuyBackScalper
Thomas Bradley Butler
4 (1)
Questo indicatore è per XAU/USD, solo grafici a 1 minuto. Ogni coppia ha caratteristiche e movimenti di prezzo unici. Scambia inversioni a forma di V con questo indicatore. Acquisti del cuoio capelluto utilizzando i trailing stop ed evita le notizie in quanto sono più estremi e possono causare vendite improvvise. Allega un intervallo di tempo di 1 minuto nel backtest e guarda gli acquisti di inversione. L'indicatore non ridipinge né ricalcola mai. COMMERCIO SOLO DURANTE L'ORARIO ATTIVO
TrueSupplyandDemand
Thomas Bradley Butler
This is based on short term strength or weakness and not on moving averages.  Moving averages are used for filter only. Trade supply and demand with arrows. Supply and demand breakouts and strength of the buyers or sellers .  Don't trade buy arrow to sell arrow.  Trade the strength with trendlines or moving averages and use stops.  The arrow can have some strong moves.  Trade on all time frames.  Try it out in the back tester. The pips can be made with this indicator, follow the arrows and make
ScalpingMaster
Thomas Bradley Butler
Master scalping with this indicator.  Trade on any time frame for scalps on buy or sells.  Follow trends using a 200 moving average and stops and targets.  Use with your own system.  This indicator can give pips if following it correctly.  Stick to rules and pick up pips daily.  Use as entries in a trend, scalp for a few pips or exit on opposite signal.  Best to follow higher time frame trends. Indicator doesn't repaint or recalculate. Rules: Don't trade overnight, only trade during active sessi
DayTradeKing
Thomas Bradley Butler
This indicator is good for small time frames like 1 and 5 minutes and made for day trading. The indicator never repaints or recalculates. The indicator works is for trading swing points in day trading, following bulls or bears.  Its a simple to use, non cluttered indicator with a high success rate.  This indicator works well to capture ranges.  All indicators come with limitations and no indicator or system is always accurate. Use money management for long term trading success.   Place in backte
DTKGold
Thomas Bradley Butler
This is the DayTradeKing for gold on a 1 minute time frame.  It is a different calculation for the range. Use a 200 period moving average as a filter.  Always use stops and avoid news, wait for more conformation.  This looks to capture intraday ranges. Put it in the back tester on 1 minute to see the price action and how it works. Trade with trend Use filter Use stops Alerts are added for pop ups and sound. 
SuperArrowScalper
Thomas Bradley Butler
Trade trends with the Super Scalper Use on all time frames and assets it is  designed for scalping trends. Works good on small time frames for day trading.  The arrows are easy to follow.  This is a simple no repaint/no recalculate arrow indicator to follow trends with.  Use in conjunction with your own system or use moving averages.  Always use stops just below or above the last swing point or your own money management system The indicator comes with push notifications, sound alerts and email
Levels Trading
Thomas Bradley Butler
This indicator is a simple stripped down version of any advanced support and resistance indicator.  All the support and resistance indicators work from a number of bars that have developed over time. Get rid of clutter and confusing levels.  Find levels according to a number of bars. Look at days, session, numbers of hours, periods of consolidation.  Watch levels develop and use as breakout points, or areas of buyers and sellers.  Features and things to consider This indicator is for a frame of
ForexReversalEA
Thomas Bradley Butler
https://www.mql5.com/en/market/product/57345 Questo EA si basa sull'indicatore Forex Reversal. Se preferisci scambiare manualmente il sistema, scarica l'indicatore e provalo. L'EA seguirà la tendenza e aprirà le posizioni di conseguenza. I risultati mostrano guadagni stabili con un drawdown inferiore, ma sperimentali nel back tester, nell'ottimizzatore e nei time frame per vedere cosa funziona. Tutti i risultati mostrati sono ipotetici. Nota: questa non è una martingala o una griglia. l'indic
HFTHacker
Thomas Bradley Butler
QUESTA È TORNATA ALLA VERSIONE SEMPLICE SENZA RECUPERO A CAUSA DELLA COMPLESSITÀ E DELLA CONFUSIONE PER GLI UTENTI NELL'OTTIMIZZAZIONE OTTIMIZZA EA PRIMA DI TESTARE E UTILIZZARE. ACQUISTA SOLO SE HAI OTTIMIZZATO. Questo è per i trader che sanno come ottimizzare e vogliono essere redditizi in base ai propri meriti. IMPOSTI I TUOI PARAMETRI DI RISCHIO. Alto tasso di vincita con stop per le negoziazioni che non funzionano se lo desideri. Riduci il rischio per la longevità. Questo funziona su tutt
MarketMaker
Thomas Bradley Butler
Automatizza il commercio della domanda e dell'offerta. Fare un mercato. Questo EA è stato realizzato e ispirato dal popolare indicatore di domanda e offerta che tutti vendono e imitano. L'EA continua a fare trading e copertura, creando un mercato. Può essere negoziato anche su conti non di copertura. È necessario valutare i rischi e utilizzare i tempi, le dimensioni dei lotti, le capacità di copertura. L'ho scambiato per circa un mese in totale a intermittenza e su più coppie contemporaneamen
Top Trader
Thomas Bradley Butler
Top Trader Indicator This is an arrow reversal indicator. This is with deviations and arrows.  Trade a blue arrow for buy and trade a red arrow for sell.  Change the time period and the deviations of the bands.  This is similar to others but these arrows don't repaint.  Load in back tester and study which periods and deviations work the best.  It works on all time frames.  15 min to 1 hr would give good results for take profits.  Try according to your own risk management.
Quant Bot
Thomas Bradley Butler
Quant Bot è per il trading di tendenza sull'intervallo di un'ora per EUR/USD. Non esiste un file impostato, ma se vengono utilizzate altre coppie, potrebbe essere necessaria l'ottimizzazione. Informazioni sul bot: Utilizza la generazione genetica e utilizza l'ATR per il commercio. Il periodo di camminata in avanti è stato utilizzato per prevenire l'adattamento della curva L'EA utilizza gli stop su ogni operazione. La gestione del denaro è un aumento con la % del saldo Il periodo di ritorno è
Crypto Net
Thomas Bradley Butler
I tempi del broker saranno diversi da quelli in cui è stata costruita la strategia. Crypto Net è per il trading di BTCUSD . Usa l'evoluzione genetica per evolvere la strategia. Questa tendenza degli scambi EA che segue gli indicatori si trovano ATR e Ichimoku. Questo è stato costruito e ha superato una serie di solidi test tra cui Monte Carlo e Walk Forward. Ingressi: Percentuale di conto che rappresenta il rischio minimo. Numero massimo di lotti Tempi per smettere di fare trading Nient'a
PropTrader
Thomas Bradley Butler
*OTTIMIZZA EA PRIMA DELL'USO* Strategia di trading Forex ottimizzata per EUR/USD Raggiungere una ricchezza sostanziale entro un anno o due con un Expert Advisor (EA) è un'affermazione non realistica. Il backtesting e il trading reale si concentrano sulla coppia di valute EUR/USD. Informazioni su questa strategia: Ciò rappresenta l’iterazione iniziale della nostra strategia, con il potenziale per ulteriori progressi. Testato rigorosamente con dati di qualità al 100%, è esente da errori MT4. L
Down Under
Thomas Bradley Butler
Down Under scambia la coppia AUD/USD in un intervallo di tempo di 1 ora. Questo EA scambia ATR e OHLC. È formattato per questa coppia in questo intervallo di tempo. Il compounding viene utilizzato con un min. dimensione del lotto e un max. dimensione del lotto. La percentuale dei saldi è composta da operazioni vincenti. Poiché il saldo oscilla, così fa la dimensione del lotto. Impostazioni: mm rischio % mm lotti lotti massimi Non c'è nient'altro da cambiare. Questo non ha capacità di marti
Cable Trader
Thomas Bradley Butler
GBP/USD 1hr Questo EA scambia slancio e sessioni. Questo ha una componente di lotto fissa e continuerà a modificare il TP man mano che si sviluppa. Impostazioni: Dimensione del lotto Non c'è nient'altro da cambiare. Questo non ha capacità di martingala o copertura. L'unica altra caratteristica da cambiare è se stai negoziando, CFD su GBP/USD. Modificalo con il decimale sulla piattaforma del broker. Dichiarazione di non responsabilità sui rischi I futures, le opzioni e il trading di va
Euclidean
Thomas Bradley Butler
Euclidea è un algoritmo di trading unico che ho inventato 8 anni fa. Questo EA fa parte di questo sistema. Funziona come un sistema chiuso. L'EA avvierà un acquisto quando il grado dell'angolo è corretto per catturare una tendenza. Lo stop loss è del 10% dall'angolo. È così semplice. Ingressi: % del saldo in lotti 1 micro lotto per $ 1.000 Volume lotti superiori = la quantità massima di lotti Livello di profitto = il valore predefinito è 50 pip Come e cose da considerare: Lo stop loss è inte
Pip Scalper
Thomas Bradley Butler
UN INDICATORE PER TUTTI Pip Scalper è per le tendenze dello scalping. Rimani nelle tendenze più a lungo con questo indicatore. Funziona su tutti i tempi e le risorse. Raccogli pip giornalieri con questo strumento. Usa la media mobile 200 per filtrare le operazioni. Si consigliano tempi più brevi. Utilizzare per il day trading. Informazioni e modalità di utilizzo: Pips Scalper si basa sul trend trading a lungo termine. Acquista in blu Vendi su Rosso Usa 200 medie mobili come filtro e fai tra
Evolved Trends
Thomas Bradley Butler
OTTIMIZZARE PRIMA DEL TEST E UTILIZZARE PER TROVARE I MIGLIORI INPUT Ehi, commercianti! Vuoi un Expert Advisor all'avanguardia per la tua piattaforma MT4? Non guardare oltre le tendenze evolute! Questo potente algoritmo di trading, creato con la tecnologia di apprendimento automatico, si concentra sul trading di GBP/USD su intervalli di tempo di 1 ora. Ma ehi, sentiti libero di sperimentare altre risorse e intervalli di tempo per l'ottimizzazione! Basta personalizzare gli input in modo che cor
Combine Winner
Thomas Bradley Butler
Trade any Forex combine out there.  Many prop firms offer challenge or instant funding combines.  The biggest problem is controlling the loss.  With this indicator you can get a visual system that can limit loss and teach discipline.  This uses the MACD and the strategy is scalping.  You can determine the risk and reward.  Visually follow small trends for scalps.  Trade during active sessions.  It's just a simple system to instill discipline while limiting loss and scalping pips with the paramet
Holy Grail Arrow
Thomas Bradley Butler
Holy Grail arrow is for scalping.  The period you use will determine the trend.  You can try different time frames and periods to see what works best for your strategy.  Filters can be applied like a moving average or trendlines.  The 1 minute works good for scalps and always trade during active periods and avoid consolidation times.  Using other indicators to determine trends is recommended but this can also be a free flowing scalping system alone with tp and sl. Inputs: Period = trend period
Twenty Eight Forex Pairs
Thomas Bradley Butler
OPTIMIZE EA BEFORE TEST AND USE No EA turns hundreds into millions in a year or 2.  This is a lie if presented this way. Trade Twenty Eight Forex Pairs.  Use this EA to trade the pairs and time frames with tp and sl according to risk.  This comes with advanced money management built in.  It has break evens and take profits on 50% with sl and tp accordingly.  1 hour recommended but try on others for intraday or swing trading.
Fulltrend
Thomas Bradley Butler
Improve trading with this indicator.  Find areas of buys or sells in Fibonacci retracement areas.  Fulltrend is for scalping and making swing trades.  Fib levels are added for take profits and stop losses. This works on any time frame and can be used by itself or together with other systems and indicators for filters. The indicator doesn't repaint.  Alerts are added and can be true or false.  No need to sit glued to the computer, just set on charts and listen or the alerts to come.  Take a posi
Scalping Code
Thomas Bradley Butler
Scalping Code is for trend scalping.  It is simple to use and is profitable.  It can work on any time frame and any asset.  This indicator can be used on it's own or together with another system.  The arrow does not repaint or recalculate.   The rules are as follows:   A blue arrow above the moving average is a buy. An exit for the buy above the moving average is a red arrow or target. A red arrow below the moving average is a sell. An exit for the red below the moving average is a blue arrow
Order Flow Volume
Thomas Bradley Butler
OPTIMIZE BEFORE BACKTEST AND USE FOR A YEAR TO FIND BEST VALUES Order Flow is unique in that is trades the volume.  It was built on EUR/USD and is optimized from  11/11/2021 to 10/24/2022 on 1 hour charts.  Optimization inputs for money management are used.  This EA uses strict money management, it is not a get rich quick martingale or EA without a sl. Trading is about risk management, not gambling.   Run on EUR/USD 1 hour chart or if you want to find other assets and time frames to optimize th
AI Signal
Thomas Bradley Butler
AI Signal is an indicator that is a ready to made scalping system that doesn't repaint Instructions: Load indicator.  Use arrows as entries in trends and stay out of sideways markets.  Trade with the larger trend and trade only active volatile hours Buy blue arrow above yellow and exit at red arrow or at discretion.  Sell red arrow below yellow and exit at blue arrow  or at discretion.  Easy to follow and is based on trends.  The indicator works on all time frames and assets. Use at your own d
Filtro:
Nessuna recensione
Rispondi alla recensione