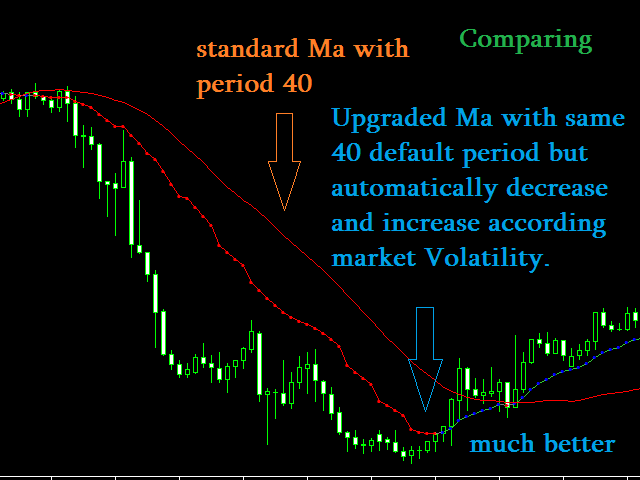
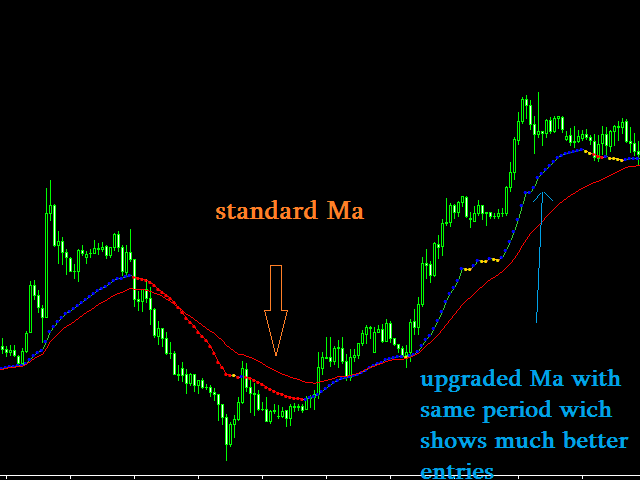
MA Revolution es una versión mejorada de la Media Móvil estándar. Con la actualización actual, la línea de media móvil es más sensible a las diferentes condiciones del mercado. Se hace más flexible disminuyendo el periodo por defecto paso a paso mientras el mercado está agudo e incrementando el periodo de vuelta al periodo por defecto paso a paso mientras el mercado está normal de nuevo.
La prueba de laidea muestraque estaversión mejoradada mucha más precisiónpara detectarla direccióndel mercado ,los cambios en la dirección se muestran muchoantesde lo quemuestra Ma estándarcon un período congelado.
Elcambio deperiodoestá vinculado ala línea del indicador dedetección devolatilidad.Cuando elindicador devolatilidadse eleva, el periodo deMa disminuyehasta que la volatilidadse eleva y el periodovuelve a lanormalidad cuandola línea devolatilidaddisminuye.
La revolución MA contiene los siguientes parámetros de entrada:
MaPeriodStart-período por defecto deMa que debedisminuir cuandoel mercado es volátil.
MaPeriodEnd - periodo mínimo hasta el cuales posible disminuir.
MaPeriodStep - punto del periodo en el cualel periodo por defecto serádisminuido paso a paso hasta el periodo final.
MaMode -
MaPrice - Precio
VolTF -Periodo detiempo del indicador de volatilidadsegún el cualse cambiaráel PeriodoMa (VolTF debe ser mayorque el periodo de tiempoque desea utilizar paraMa Revolution)
VolPeriod - Periodo del indicador de volatilidad.
Cómo utilizarlo: Si desea utilizarMA Revolution en los marcos de tiempo M5-M15-M30, VolTF (marco de tiempodelindicador de Volatilidad) debe ser utilizado H1 o H4 Siempredebe ser mayorque el marco de tiempoutilizado para que aparezcaMA Revolution .
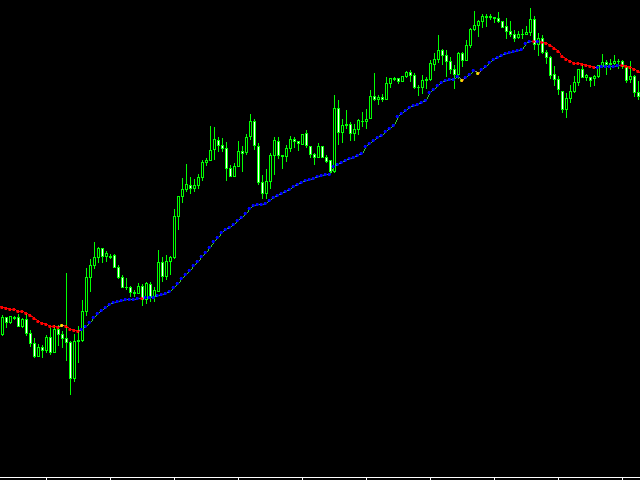
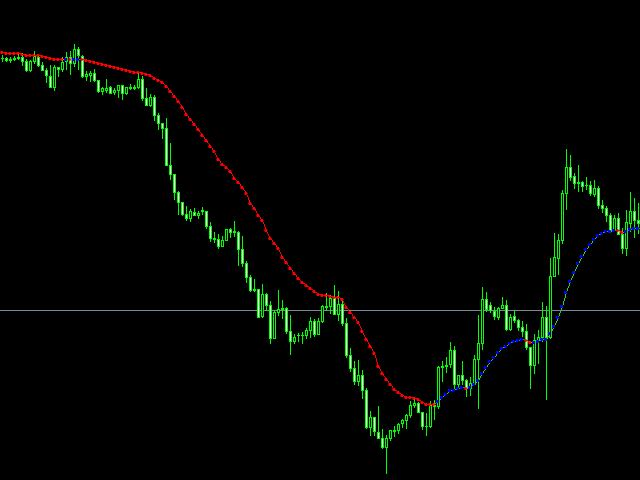
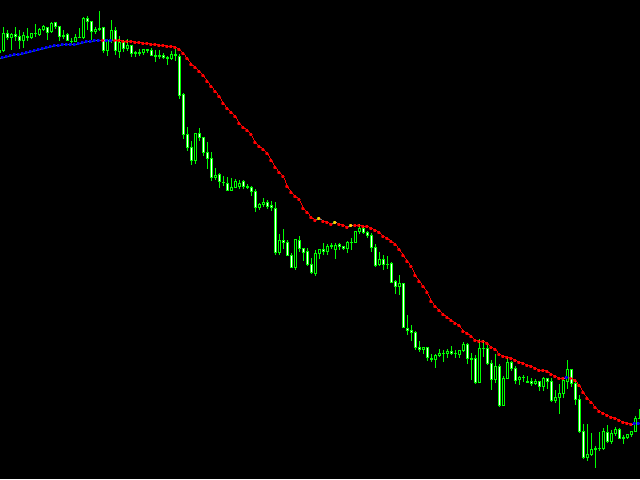
La líneaMA Revolutioncambia de color a Verde cuando la línea está subiendo yla vela está sobre la línea.
La líneaMA Revolutioncambia de color a Rojo cuando la línea está bajando yla vela está por debajo de la línea.
La líneaMA Revolutioncambia de color a Amarillo cuando la línea está bajando perolavelaestá sobre la línea o la línea está subiendo pero lavela está por debajo de la línea.


much more responsive