Time and Price Line
- Indicatori
- Versione: 2.2
- Aggiornato: 20 dicembre 2023
- Attivazioni: 5
Displays the local time with the time difference you set.
(It does not correspond to the time difference in 30-minute increments.)
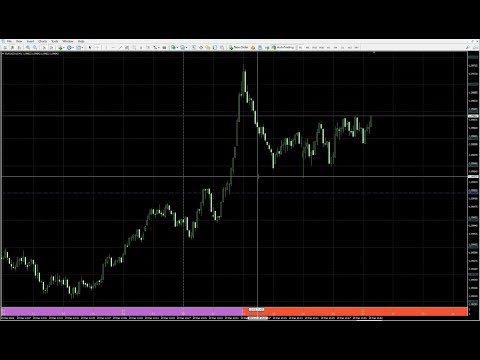
It also displays a price line with a good price, such as 100.000 .100 or .200.
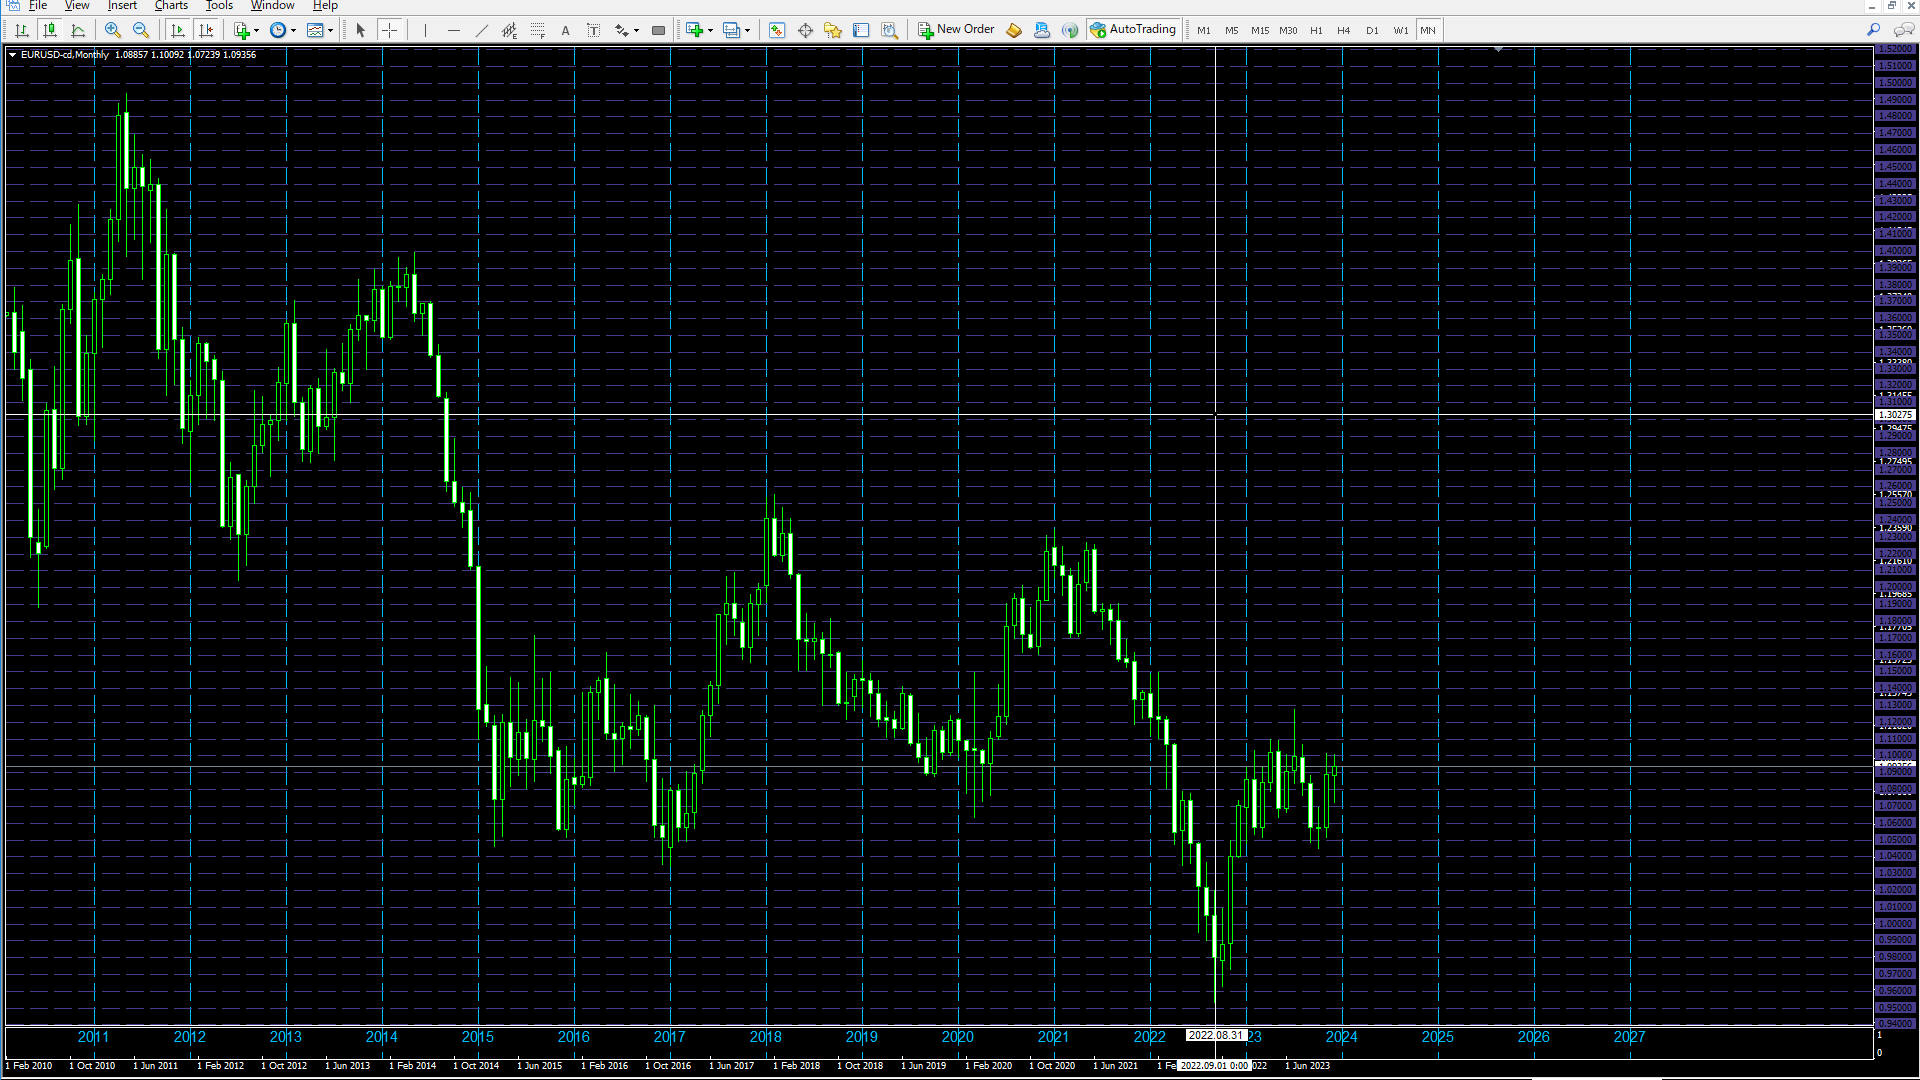
The standard gridlines are displayed with the time and price by MT4, but they are very confusing as they become the broker's time and are displayed at the halfway point along with the price.
It hides them and displays gridlines at user-defined time differences and prices in easy-to-understand positions.
The system is implemented to run lightly so as not to overload other EAs and discretionary trading.
The following features are available
- Two-column display for easy viewing
The two-column display, with the hours and minutes separated, prevents text from being crushed even when the display is reduced in size.
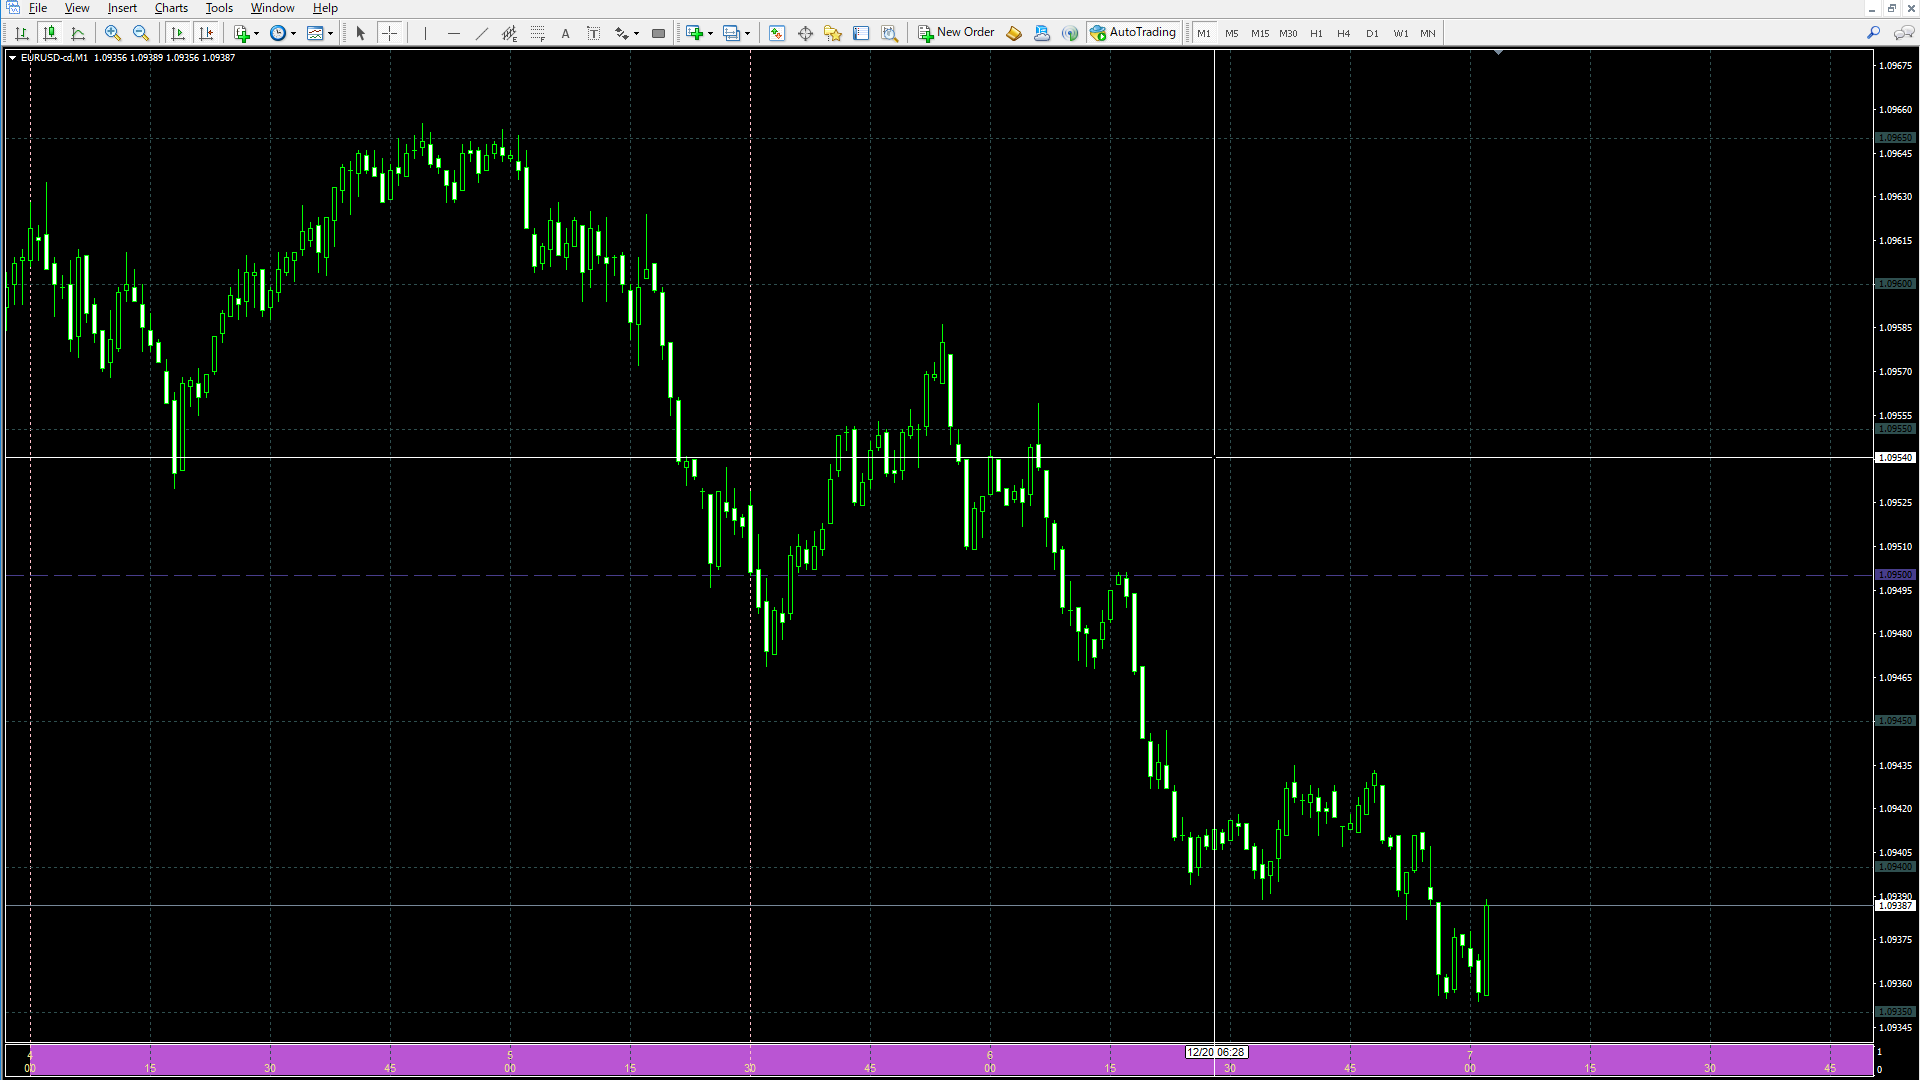
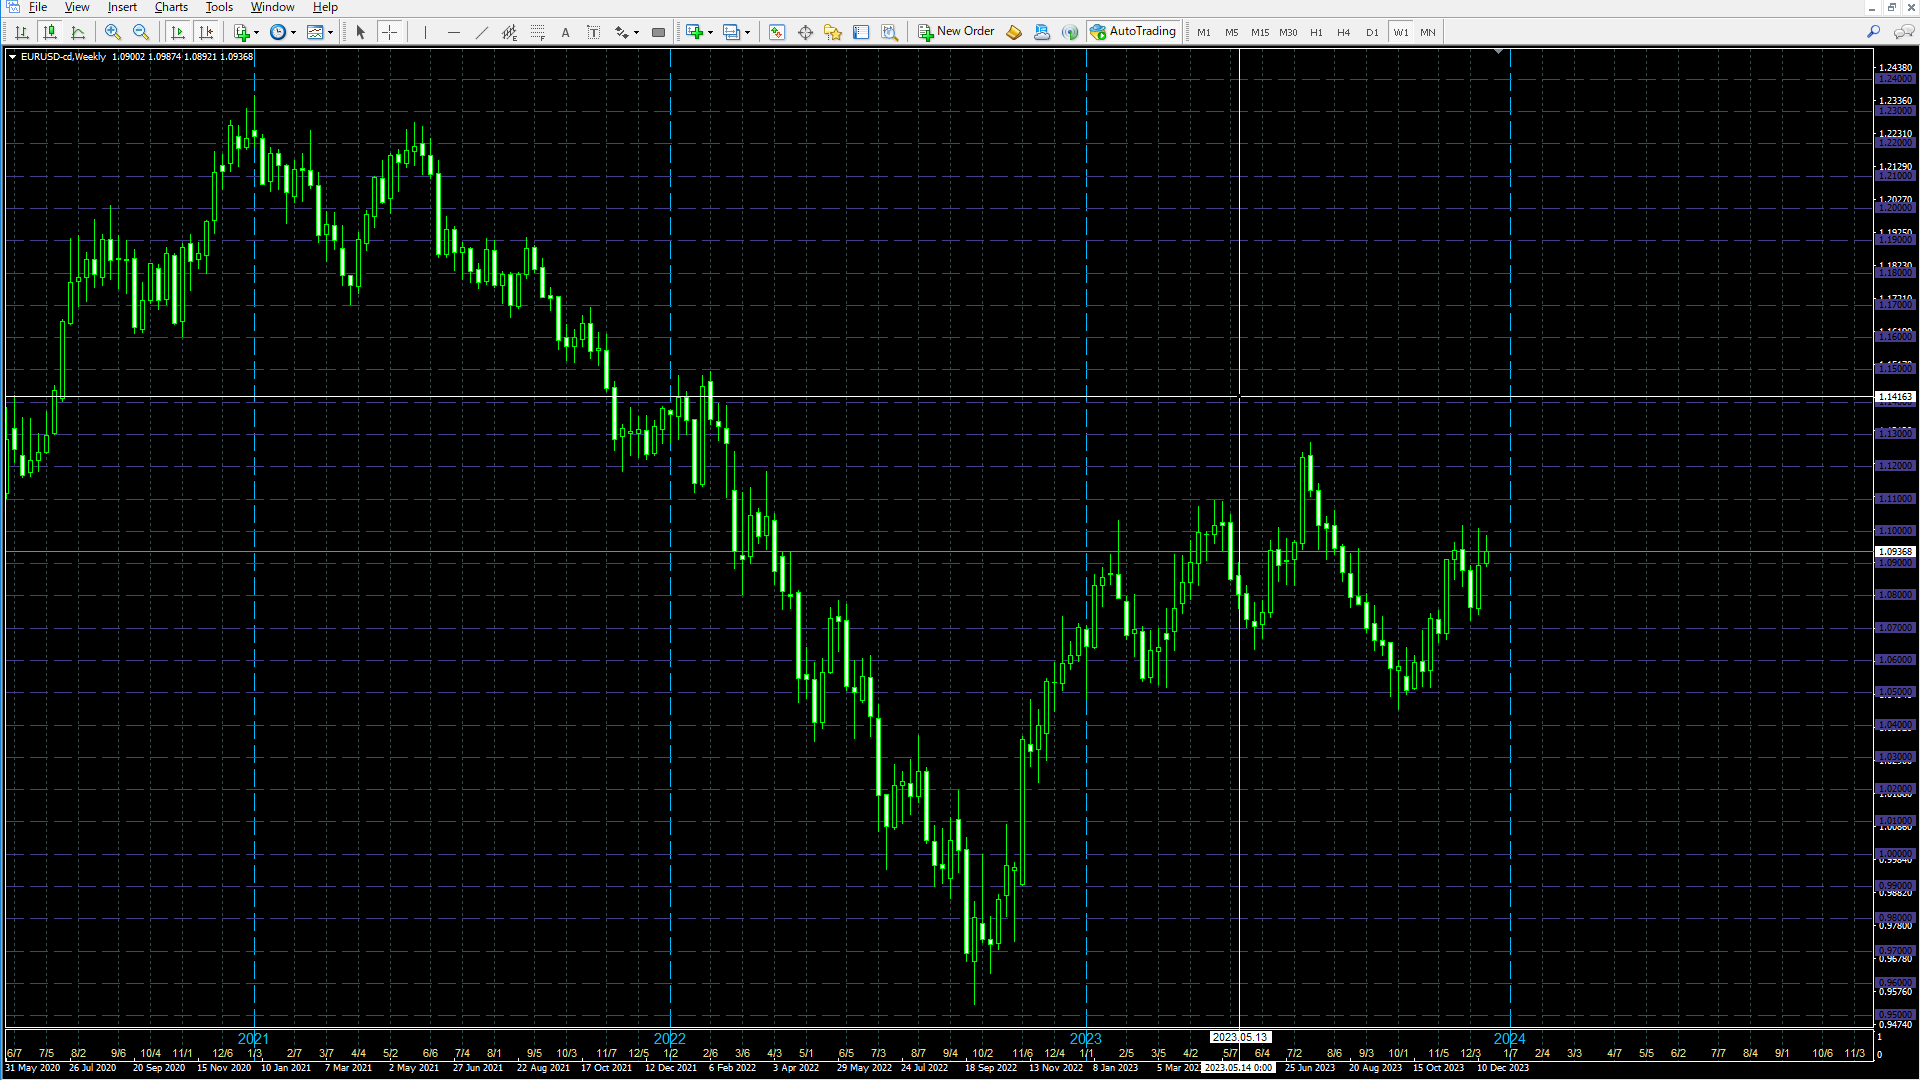
- The time line can also display future time.(Saturday and Sunday lines are not shown)
Future time lines are also displayed, making it easy to keep track of time transitions.
- Display lines at specified special times.
Lines can be displayed at special daily times, such as the middle price and London Fix.
Up to 6 lines can be specified and will be displayed daily.
To hide the line, set the number to 2400; to display the line at 24:00, set the number to 0.
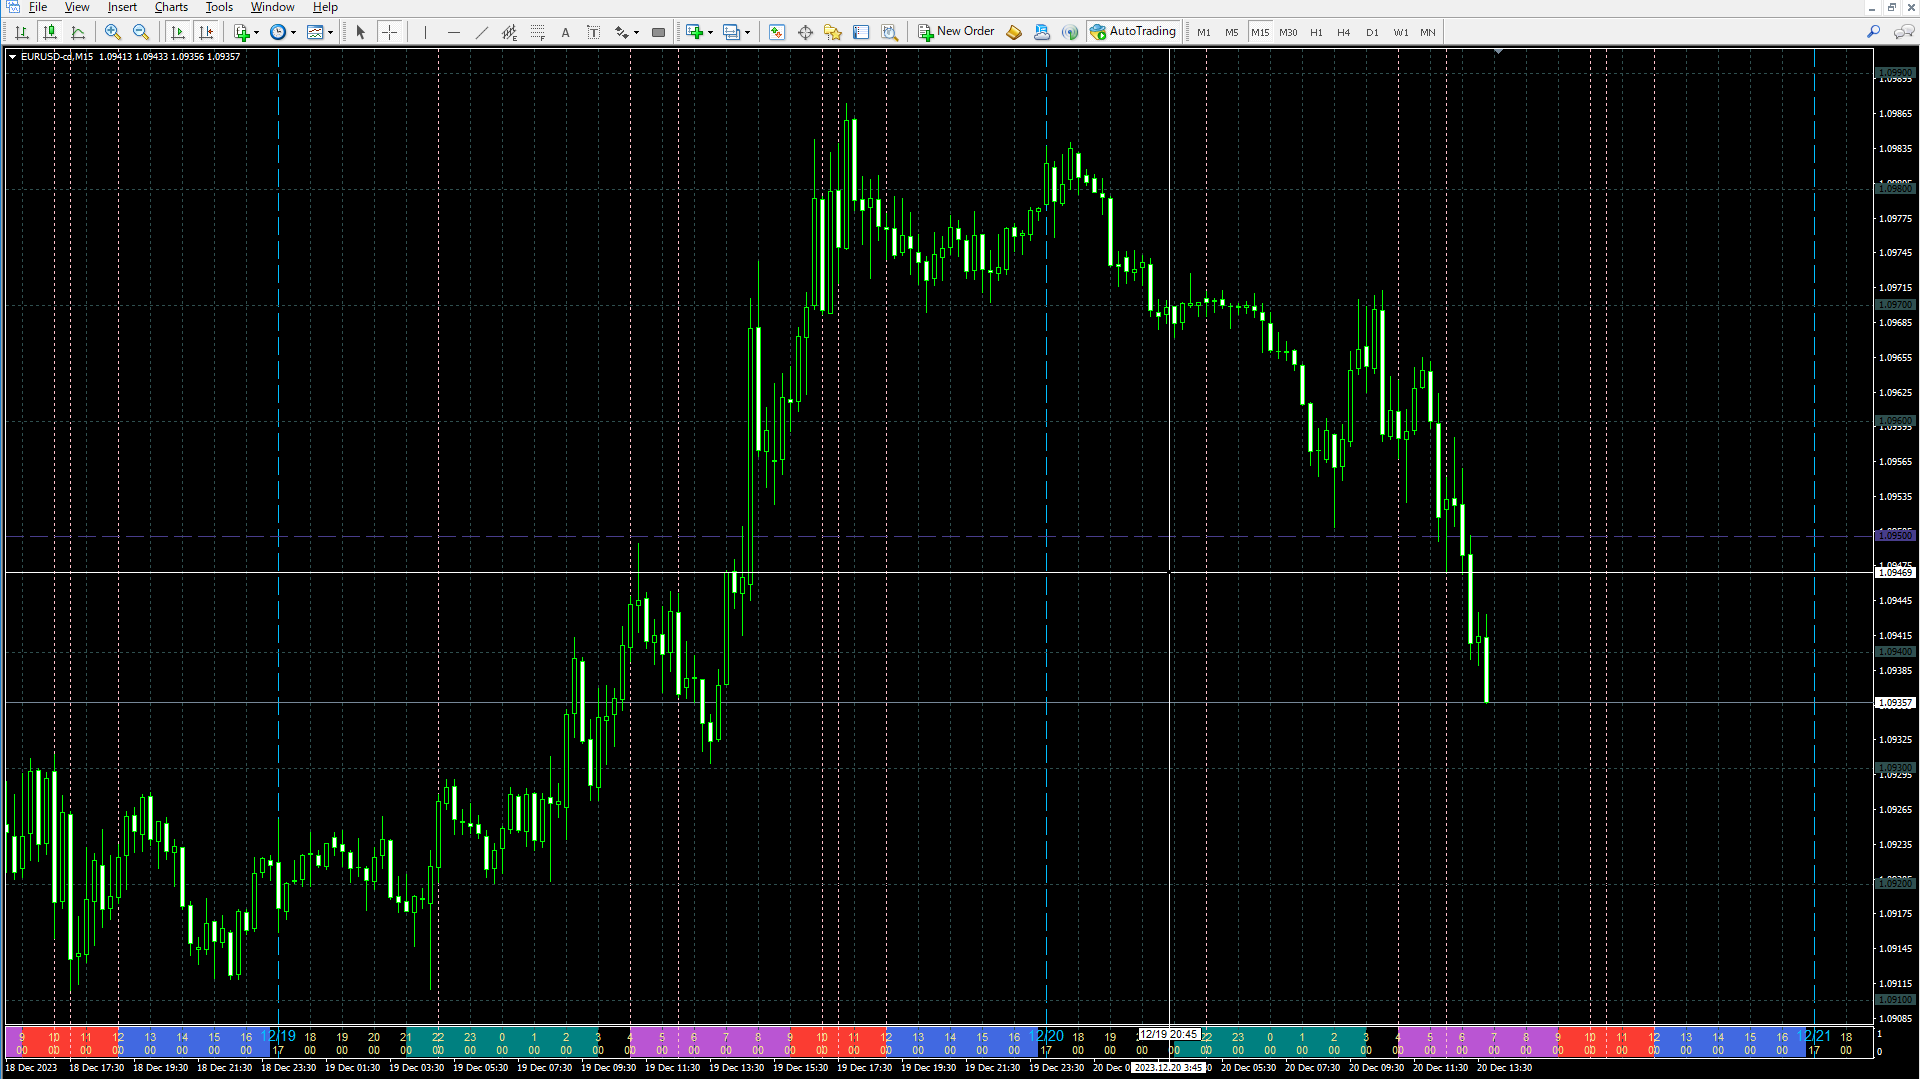
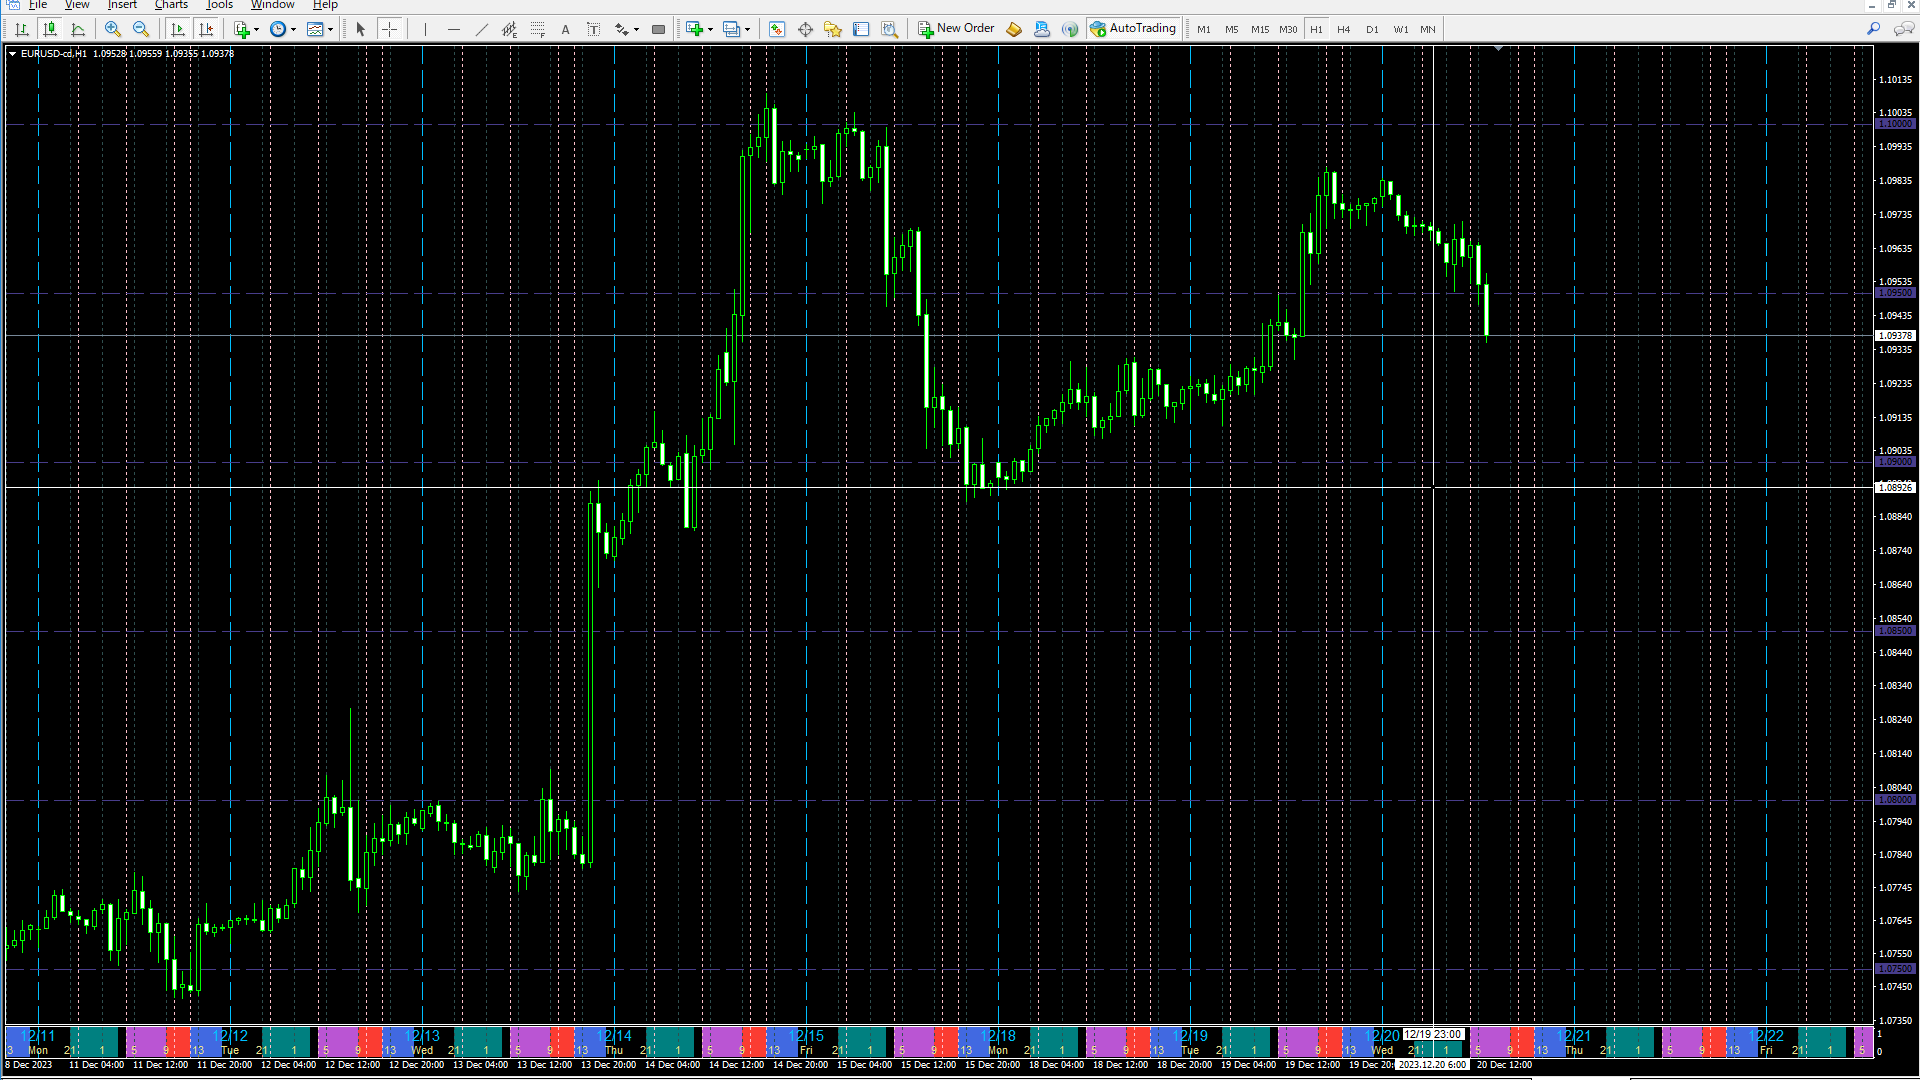
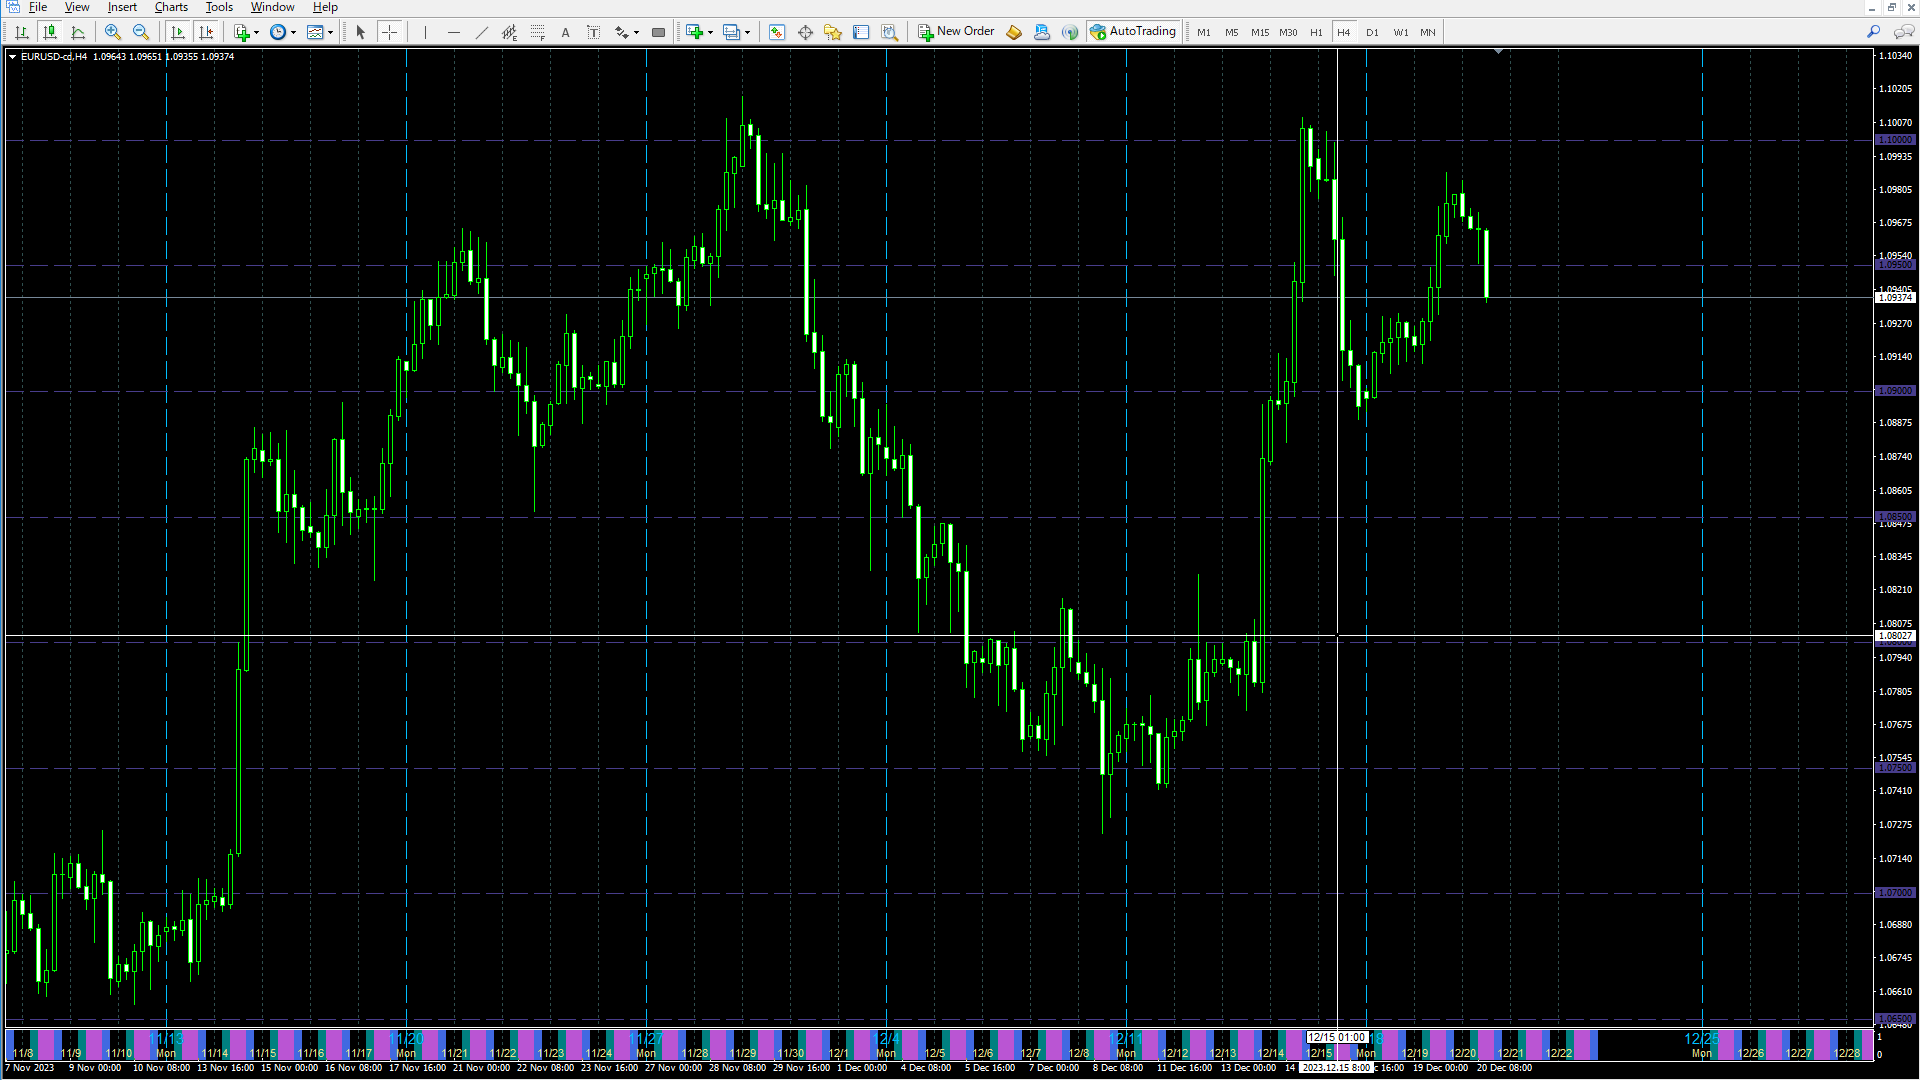
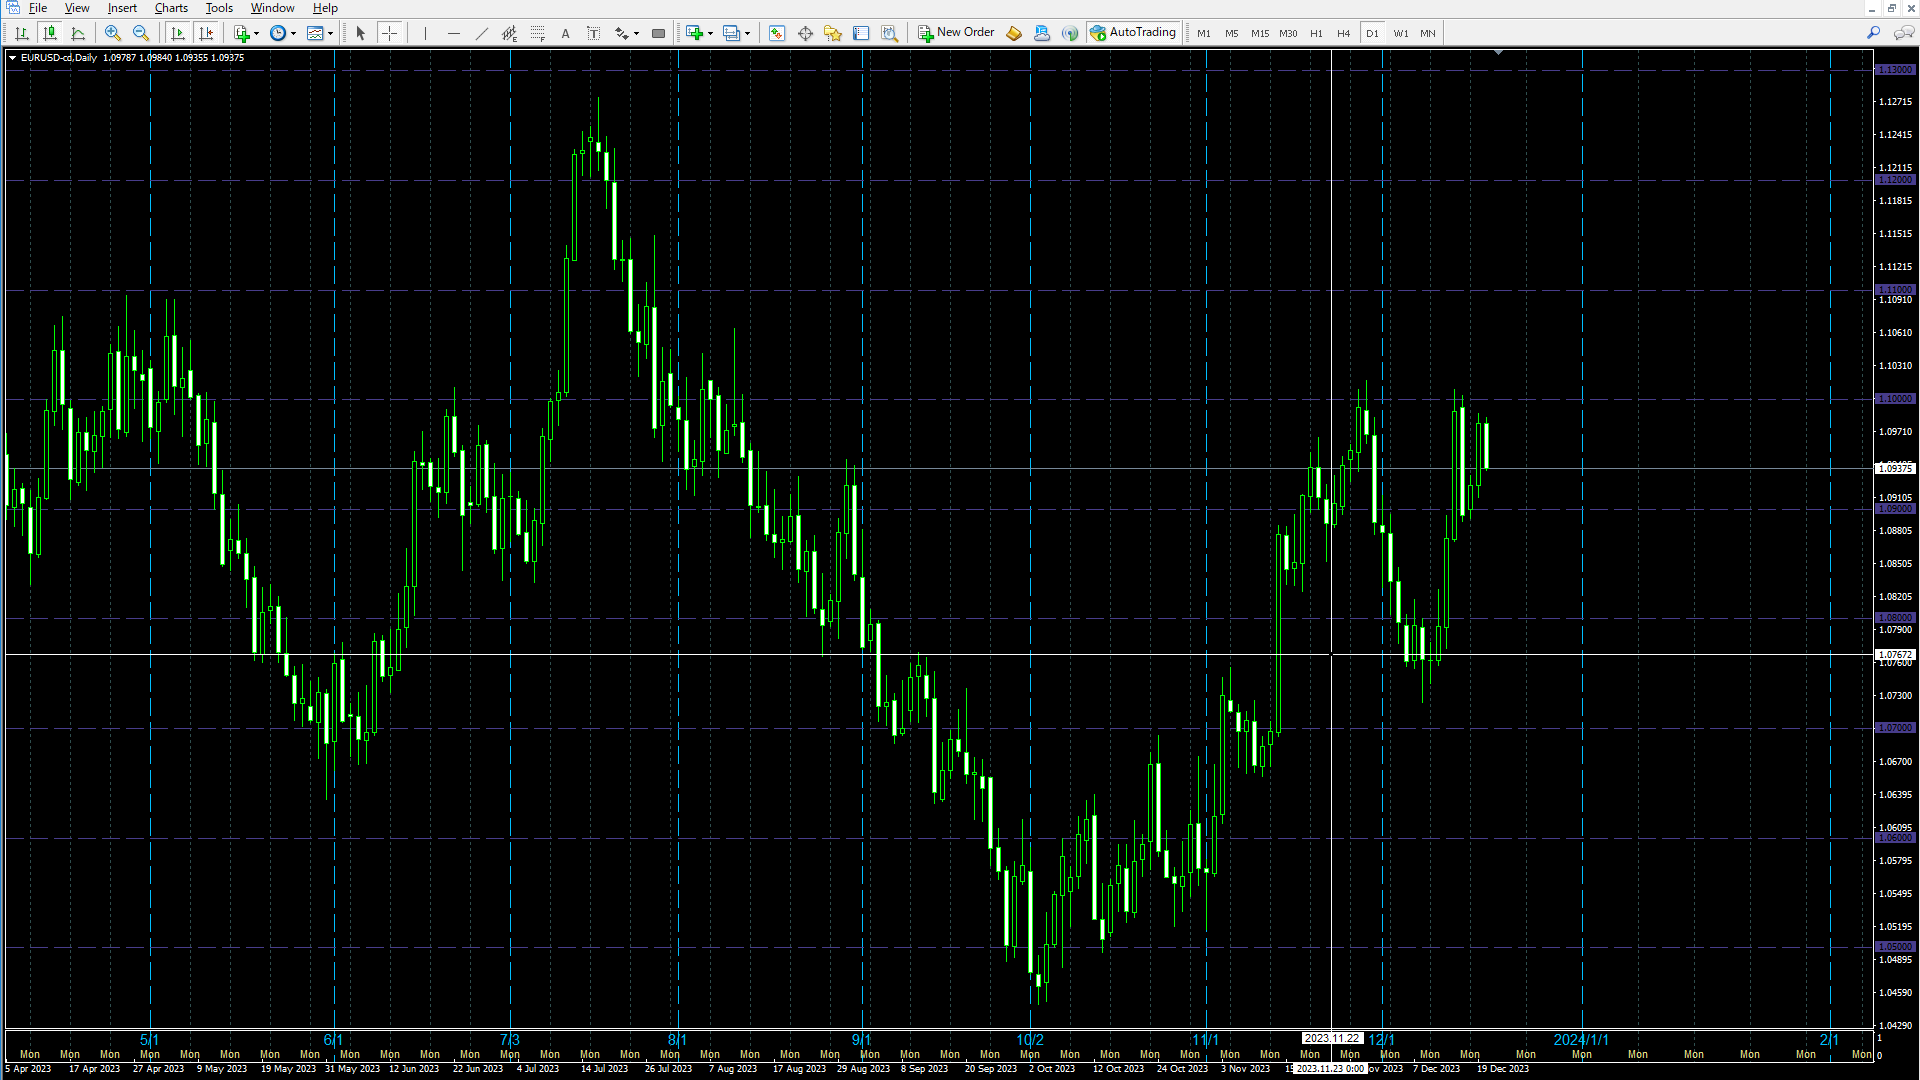
- Time and price lines can be displayed at set intervals.
Price lines can be displayed at set intervals for M1, M5, M15M30, H1H4, and D1W1MN respectively.
Also, price lines can be set up with lines in different colors every 50 pips, etc.
Time lines can be displayed at set intervals for M1, M5, M15M30, and H1 respectively.
(H4, D1, W1, MN time line display intervals are fixed.)
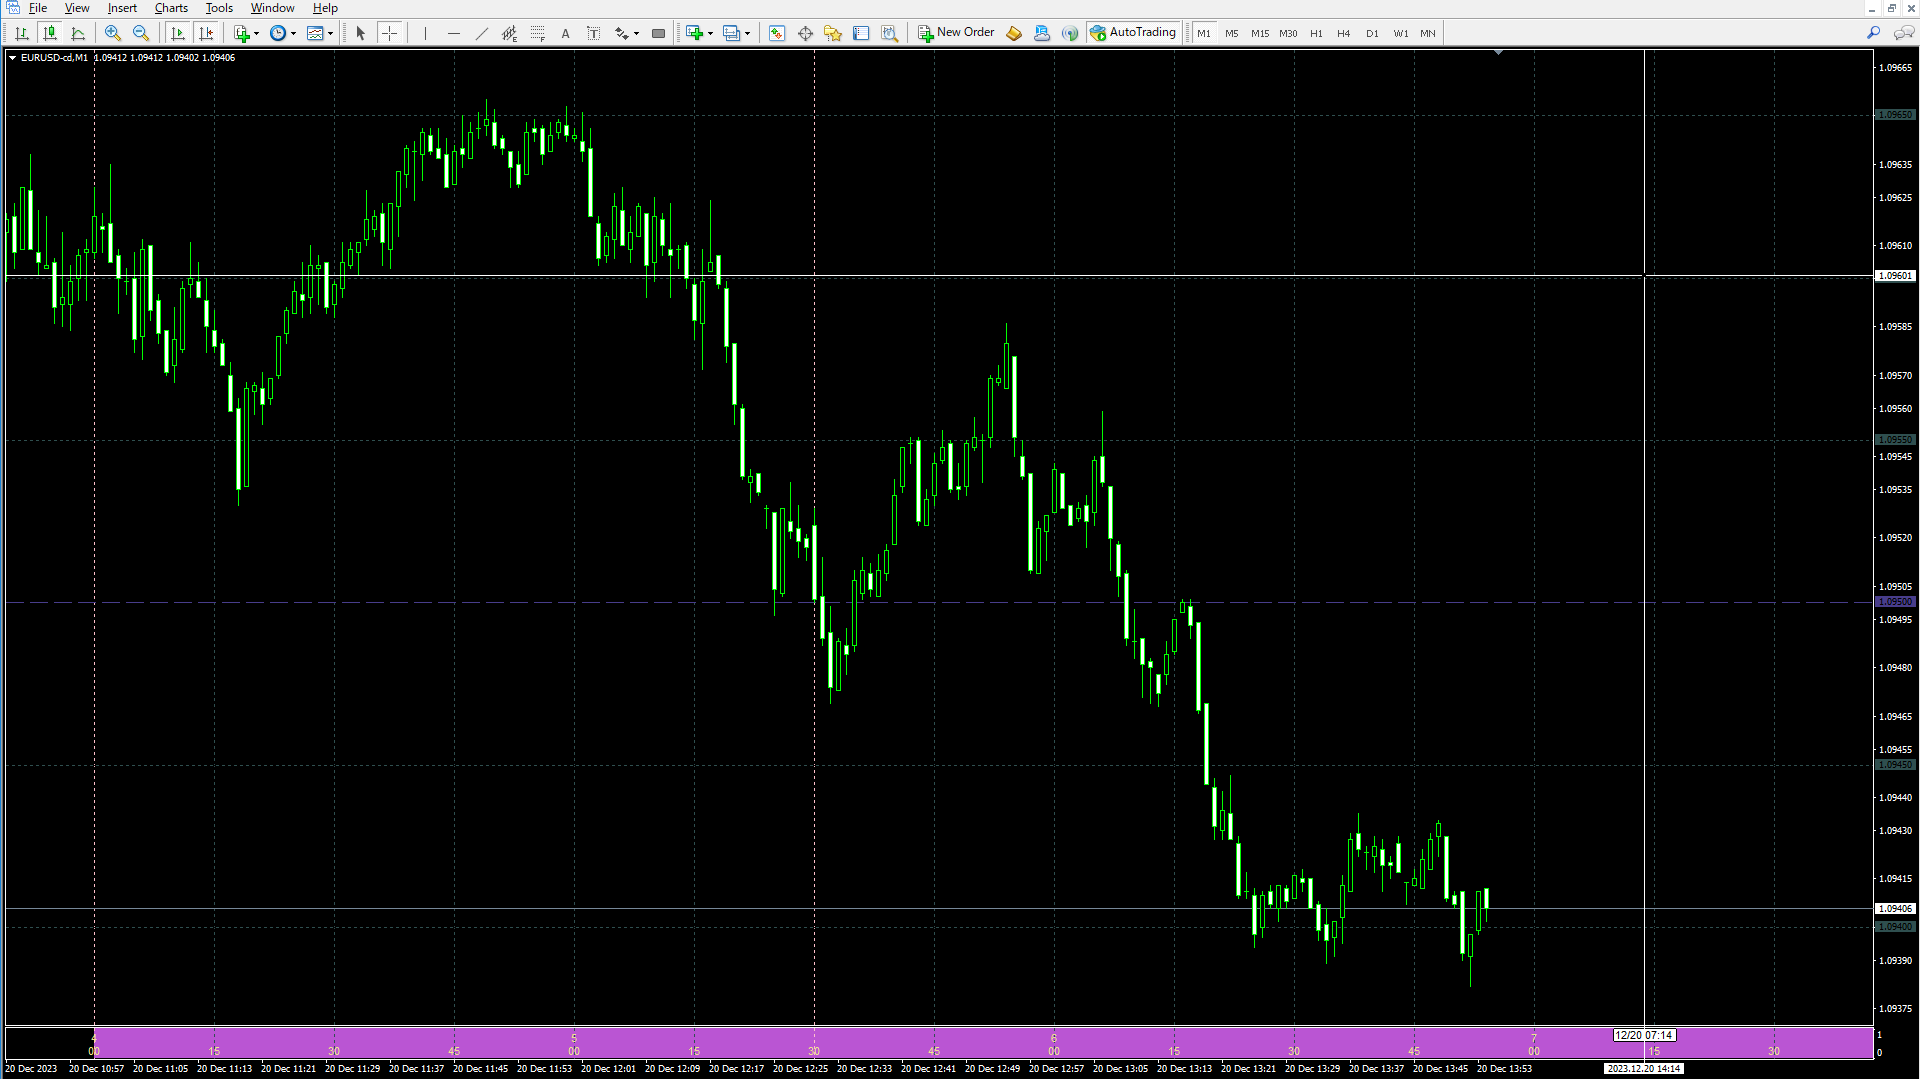
- Label with detailed time information.
Instead of the detailed time in the Crosshair display, the detailed time can be displayed with a label according to the set time.
Press "F" key to show/hide.
- Date delimited by MT4 server time.
Since it coincides with the end time of NY, it is easy to grasp as a day break.
- The date area at the bottom of the chart can be hidden by setting "Showing MT4 date area".
- Asian time, EU time, and US time can be displayed in specific colors.
- Supports 24-hour and 12-hour notation.
- Date notation supports 4/1, 1/4, Apr/1, 1/Apr.
parameter description
| ・Time offset: | Set the time difference in relation to the time on MT4. |
| ・Bars time range: | Set the number of time lines to be displayed. If 0 all range displayed |
| ・Price line step Minute (Pips) ・Price line step Hour (Pips) ・Price line step Day (Pips): | Set the price line display interval in Pips. Minute is M1,M5,M15,M30, Hour is H1,H4, and Day becomes a set value in D1,W1,MN. |
| ・Time interval M1 - H1: | Set the display interval of the time line. (Note) H4, D1, W1 and MN are fixed display settings. |
| ・Time notation: | Set time notation. (ex:24Hour 0,23. AM/PM 3a, 10p, mid) |
| ・Date notation: | Set date notation. (ex:4/1, 1/4, Apr/1, 1/Apr) |
| ・Base line color: | Set the color of the time and price line. |
| ・Base line style: | Set the style of the time and price line. |
| ・Time font size: | Set the display font size of the time. |
| ・Time color: | Set the display color of the time. |
| ・Day and year color: | Set the display color of the date. |
| ・Day and year line color: | Sets the color of the line that is displayed when the date is changed. |
| ・Price support line (Pips): | Set the line interval in Pips to be set at a breakout price. When set to 50 pips, the price line will be displayed in colors set in 50-pips increments, such as 99.950, 100.000, 100.050, etc. |
| ・Price support line color: | Set the color of the line to be displayed at the interval set in the Price line break (Pips). |
| ・Price support line style: | Set the style of the line to be displayed at the interval set in the Price line break (Pips). |
| ・Asia open time: ・Asia end time: | Specify the start and end time of Asian time. |
| ・EU open time: ・EU end time: | Specify the start and end time of EU time. |
| ・US open time: ・US end time: | Specify the start and end time of US time. |
| ・Asia range color: ・EU range color: ・US range color: | Set time zone colors for Asia, EU, and US. |
| ・Special Time 1 - 6: | Set the time you would like to specify specifically, such as the time the market opens or the time the economic event is released. The time line will be displayed in the color you set in Special Time n color. You can set up to 6 settings. (Note) Special Time is not appear in H4, D1, W1 or MN. |
| ・Special Time 1 - 6 color: | Set the color of the time line set in Special Time n. |
| ・Special Time line style: | Set the color of the time and price line. |
| ・ Showing MT4 date area : | Display setting for the date area at the bottom of the chart. true: show; false: hide. |