Dashboard RSI Multicurrency
- Indicatori
- Versione: 5.70
- Aggiornato: 19 luglio 2026
- Attivazioni: 10

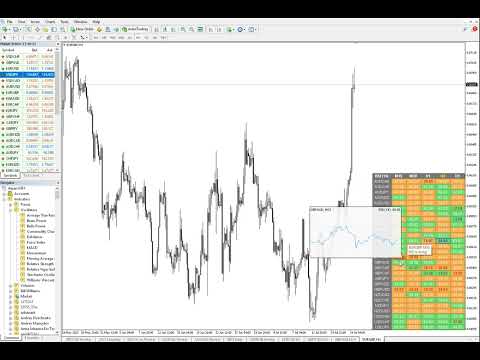
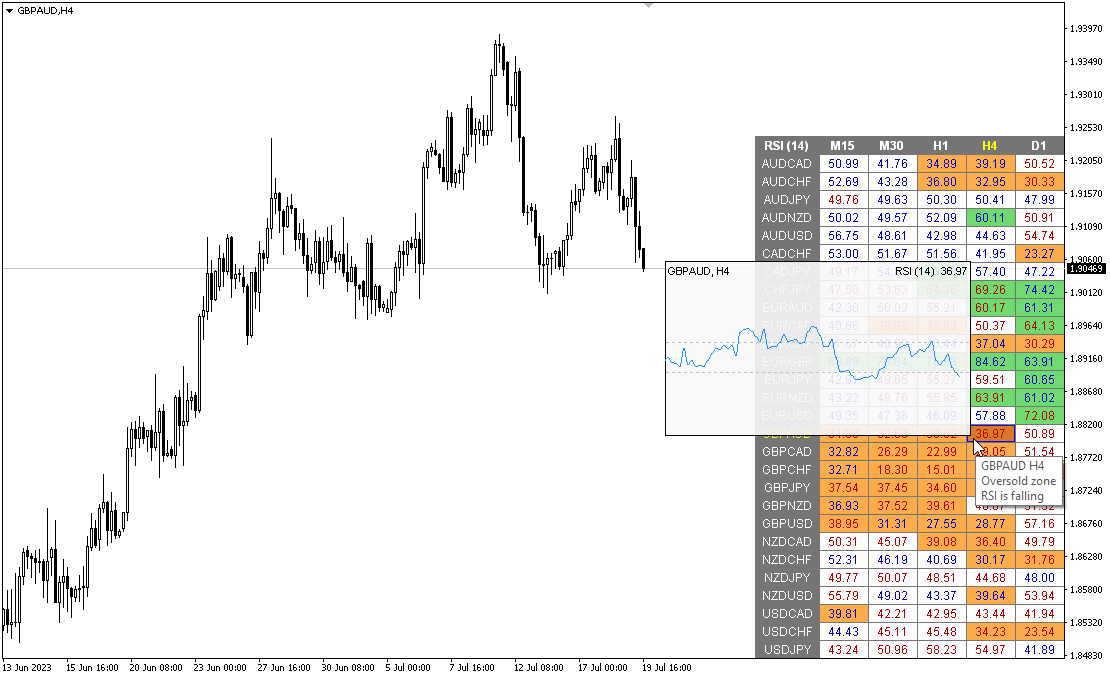
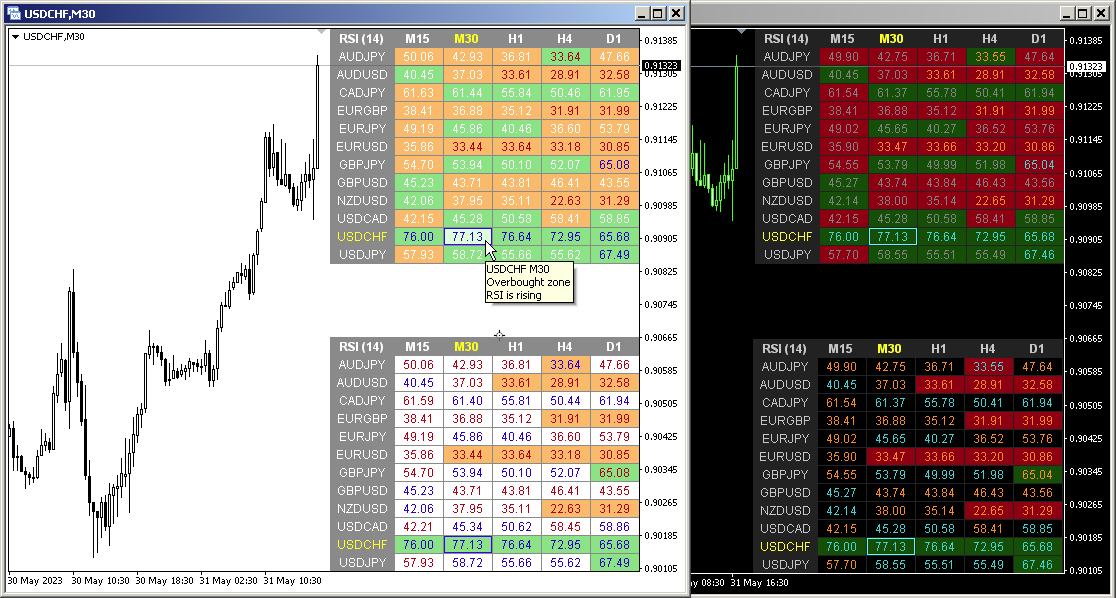
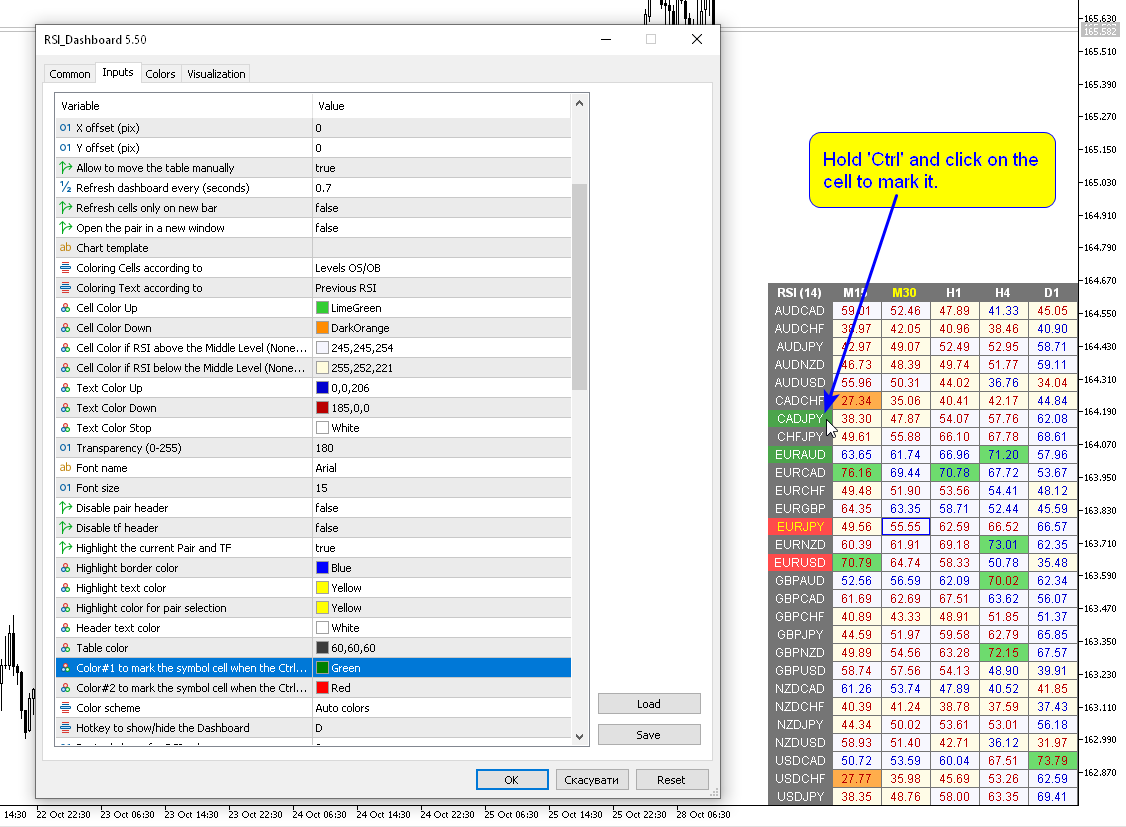
Modifica multivaluta e multitimeframe dell'indicatore Relative Strength Index (RSI). È possibile specificare qualsiasi valuta e intervallo di tempo desiderati nei parametri. Inoltre, il pannello può inviare notifiche quando si attraversano i livelli di ipercomprato e ipervenduto. Cliccando su una cella con un punto, questo simbolo e punto verranno aperti. Questo è lo scanner MTF.
La chiave per nascondere la dashboard dal grafico è "D" per impostazione predefinita
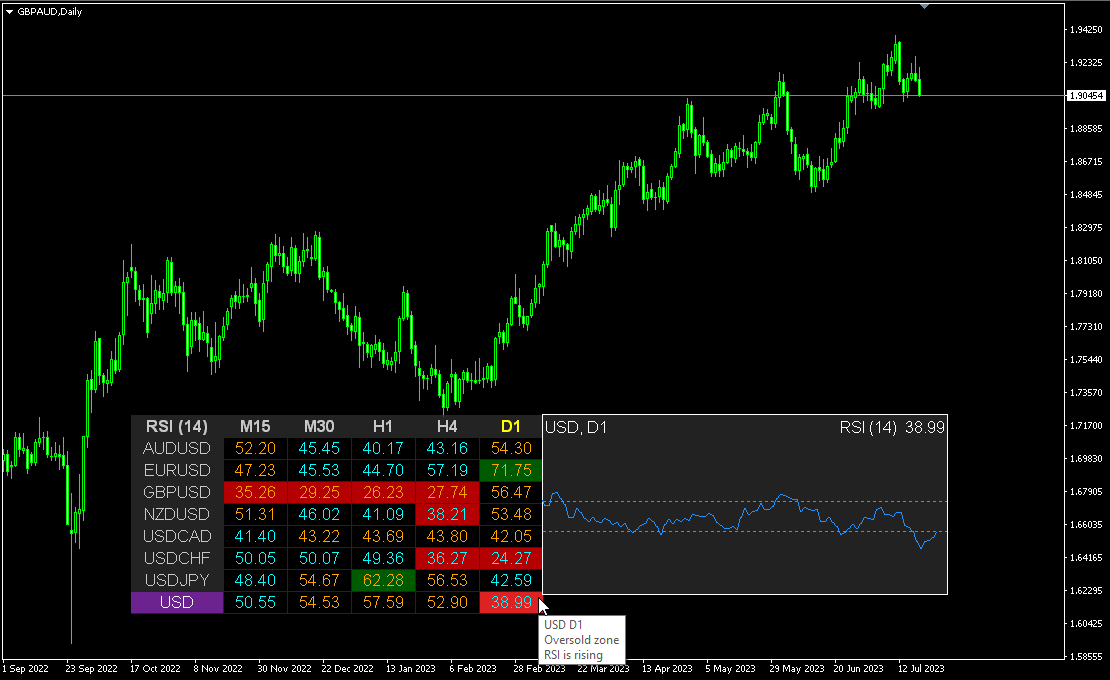
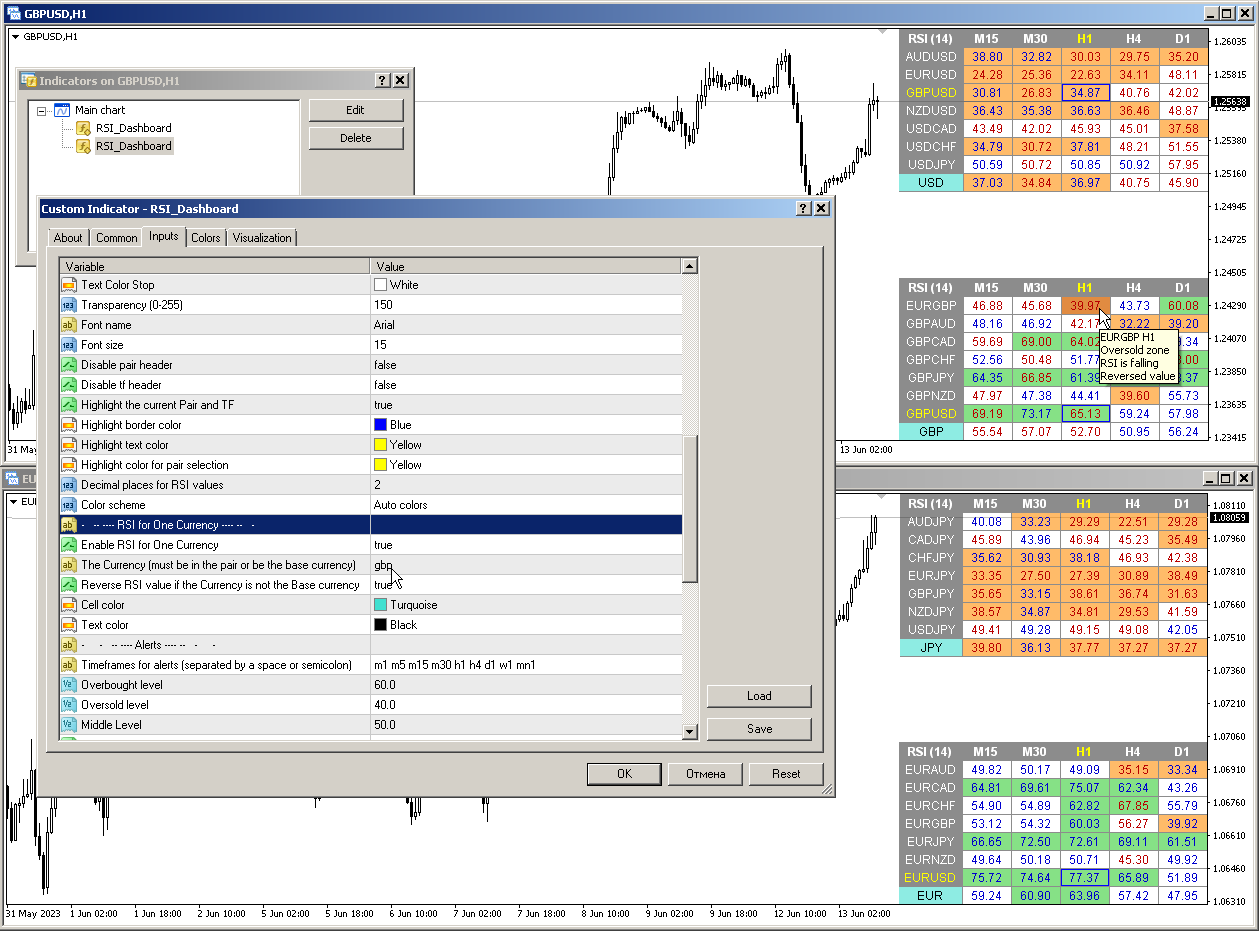
Similmente al Valuta Strength Meter (CSM), la Dashboard può selezionare automaticamente le coppie che contengono una valuta specifica, o quelle coppie che hanno quella valuta come valuta base. L'indicatore cerca la valuta in tutte le coppie specificate nel “Set di coppie”; le altre coppie vengono ignorate. E sulla base di queste coppie, viene calcolato l'RSI totale per questa valuta. E puoi vedere quanto è forte o debole quella valuta.
Parametri
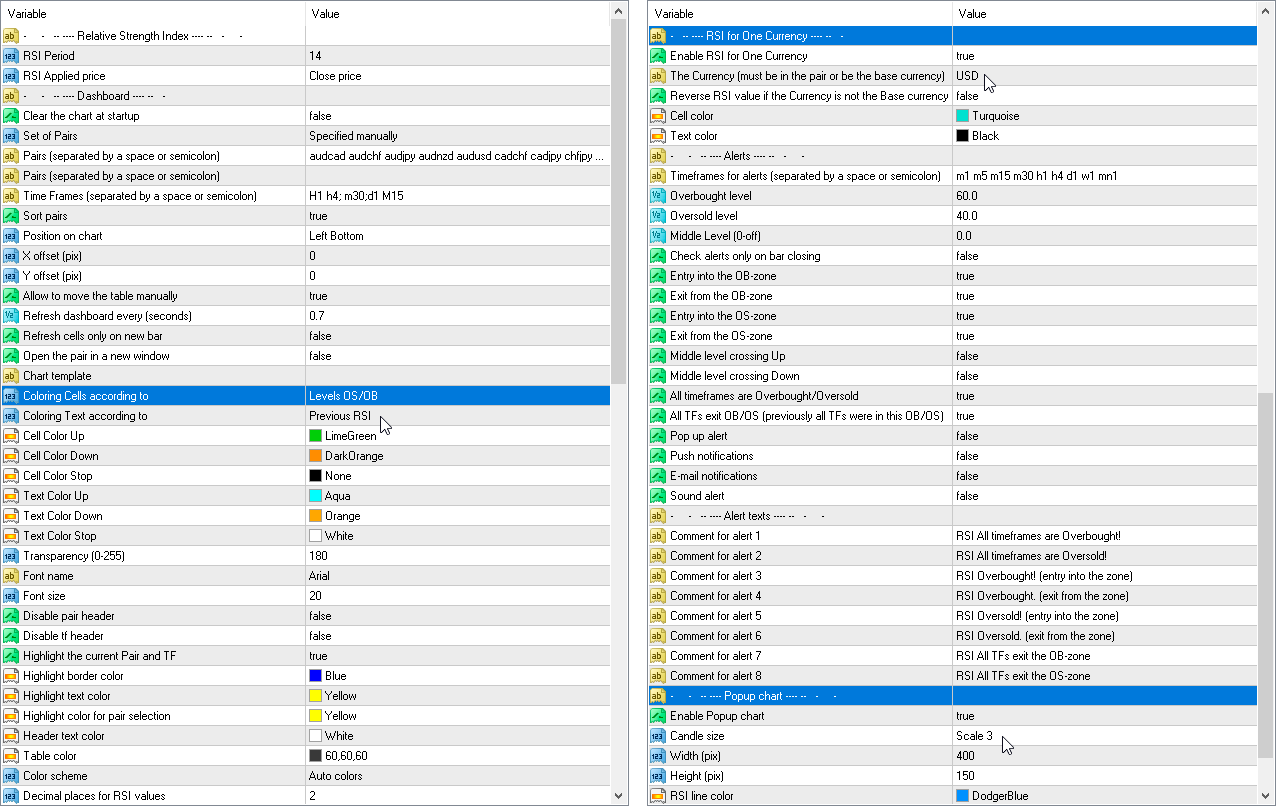
RSI Period — periodo di media.
RSI Applied price — tipo di prezzo.
Clear the chart at startup — cancella il grafico all'avvio
Set of Pairs — insieme di simboli
— Market Watch — Coppie da "Market Watch" del MT.— Specified manually — coppie specificate manualmente, nei parametri "Coppie".— Current pair — mostra solo la coppia attuale.
Pairs (separated by a space or semicolon) — elenco di simboli separati da spazi o punto e virgola. I nomi delle valute dovrebbero essere scritti esattamente come quelli del broker, mantenendo maiuscole e minuscole e prefisso/suffisso.
Time Frames (separated by a space or semicolon) — elenco di intervalli temporali separati da spazi o punti e virgola (intervallo temporale multiplo).
Sort pairs — ordina l'elenco delle coppie.
Position on chart — angolo per visualizzare il pannello sulla carta.
X offset (pix) — sposta il pannello lungo l'asse X;
Y offset (pix) — sposta il pannello lungo l'asse Y;
Refresh dashboard every (seconds) — periodo di aggiornamento per tutte le coppie e gli intervalli di tempo.
Refresh cells only on new bar — gli aggiornamenti delle celle (e gli avvisi) verranno eseguiti solo quando viene visualizzata una nuova barra.
Open the pair in a new window — apri un simbolo in una nuova finestra del grafico facendo clic.
Chart template — il nome del modello per il grafico, se il grafico si apre in una nuova finestra.
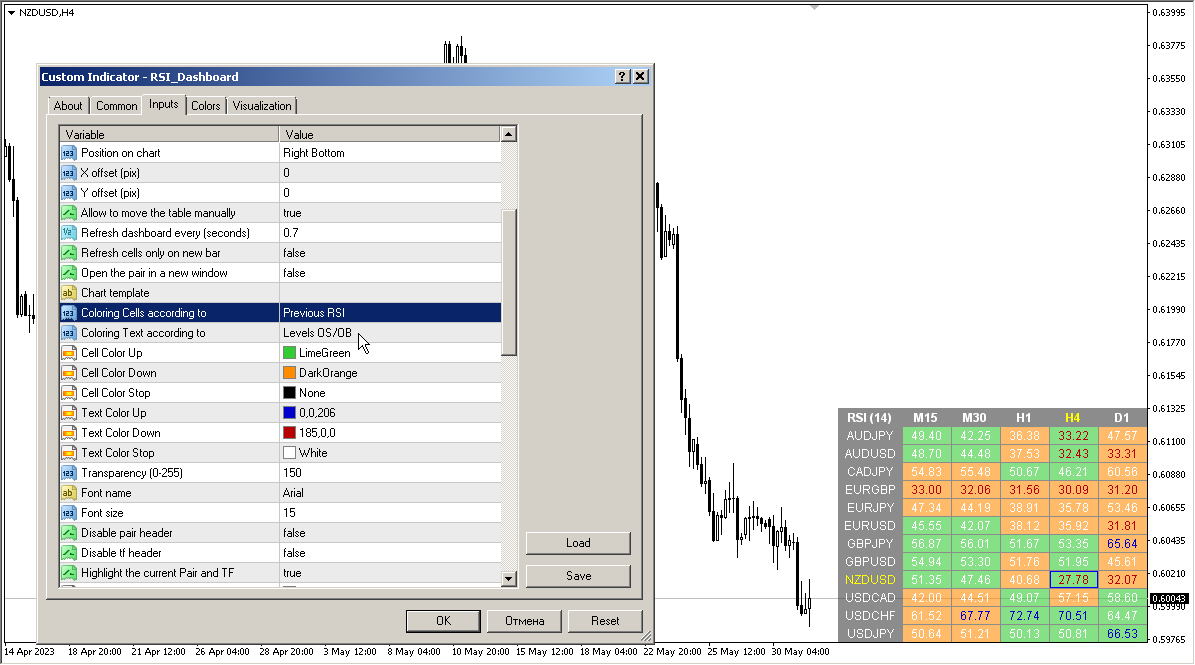
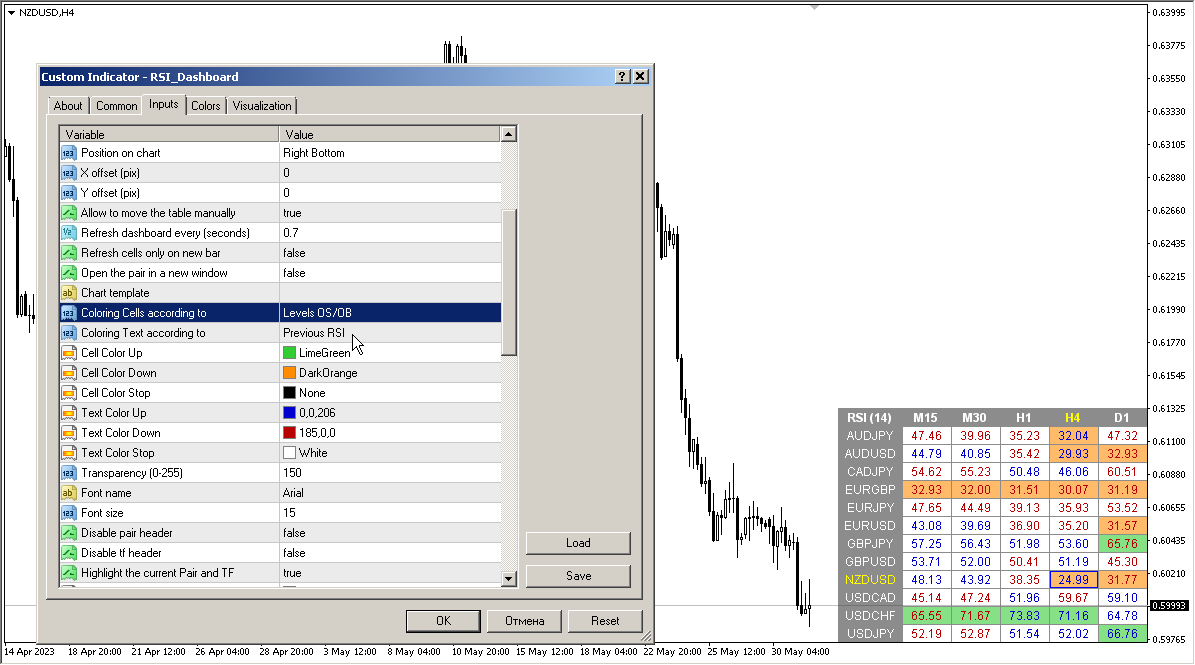
Coloring the cells according to the — dipingi le celle della tabella secondo i livelli di ipercomprato/ipervenduto o secondo la direzione della candela precedente.
Color Up — colore della cella se l'indicatore aumenta.
Color Down — colore della cella se l'indicatore diminuisce.
Color Stop — colore della cella se l'indicatore non cambia.
Transparency (0-255) — trasparenza del pannello.
Font name — nome del carattere.
Font size — dimensione del carattere.
Avvisi
Timeframes for alerts (separated by a space or semicolon) — elenco dei periodi per i quali verrà inviato l'avviso (separati da uno spazio o un punto e virgola).
Overbought level — livello di ipercomprato per gli avvisi.
Oversold level — livello di ipervenduto per gli avvisi.
Middle Level — Livello intermedio
Check alerts only on bar closing — Controlla gli avvisi solo alla chiusura della sbarra — controlla il passaggio a livello solo dopo la chiusura della sbarra.
Entry into the OB-zone — Ingresso nella zona OB
Exit from the OB-zone — Esci dalla zona OB
Entry into the OS-zone — Ingresso nella zona del sistema operativo
Exit from the OS-zone — Esci dalla zona del sistema operativo
Middle level crossing Up — Passaggio a livello medio
Middle level crossing Down — Passaggio a livello medio in discesa
Alert when RSI direction changes — Avvisa quando cambia la direzione dell'RSI
All timeframes are Overbought/Oversold — Tutti i tempi sono ipercomprato/ipervenduto
All TFs exit OB/OS (previously all TFs were in this OB/OS) — Tutti i TF escono dall'OB/OS (prima tutti i TF si trovavano in questo OB/OS)
Pop up alert — avviso popup.
Push notifications — notifica push.
E-mail notifications — notifica e-mail.
Sound alert — avviso sonoro.


hello I have RSI dashboard and Stochastic dashbord. I need something for alert system. I really like your dashboards. But I need something more useful. If you can add it I will be very happy.. Example: When the RSI is over 70 on the H1 and at the same time The RSI is under the 30 on the M1 , Can be an alert for it ? When the RSI is under 30 on the H1 and at the same time The RSI is over the 70 on the M1 , Can be an alert for it ? I mean that when a timeframe is over 70 and the other timeframe is under 30 , there will be an alert for it