Heikin Ashi Dashboard MT5
- Indicatori
- Versione: 2.80
- Aggiornato: 19 luglio 2026
- Attivazioni: 10

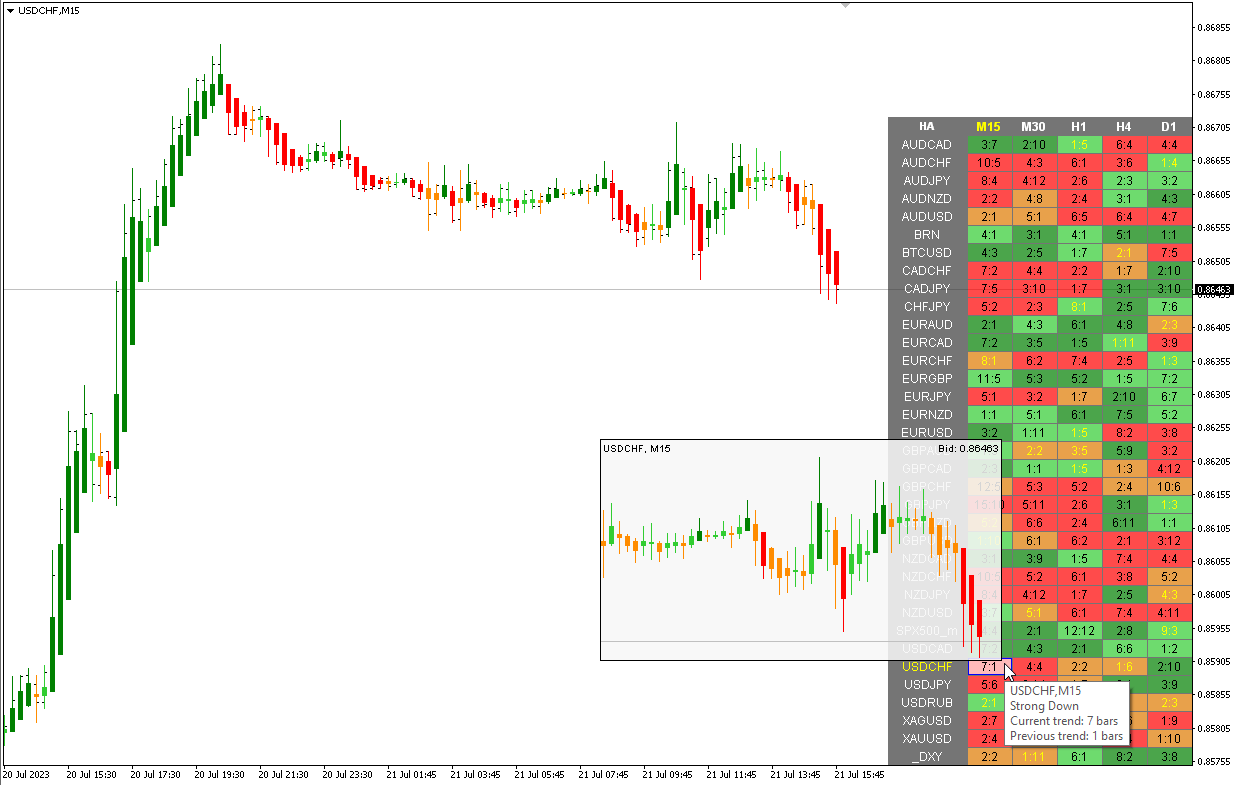
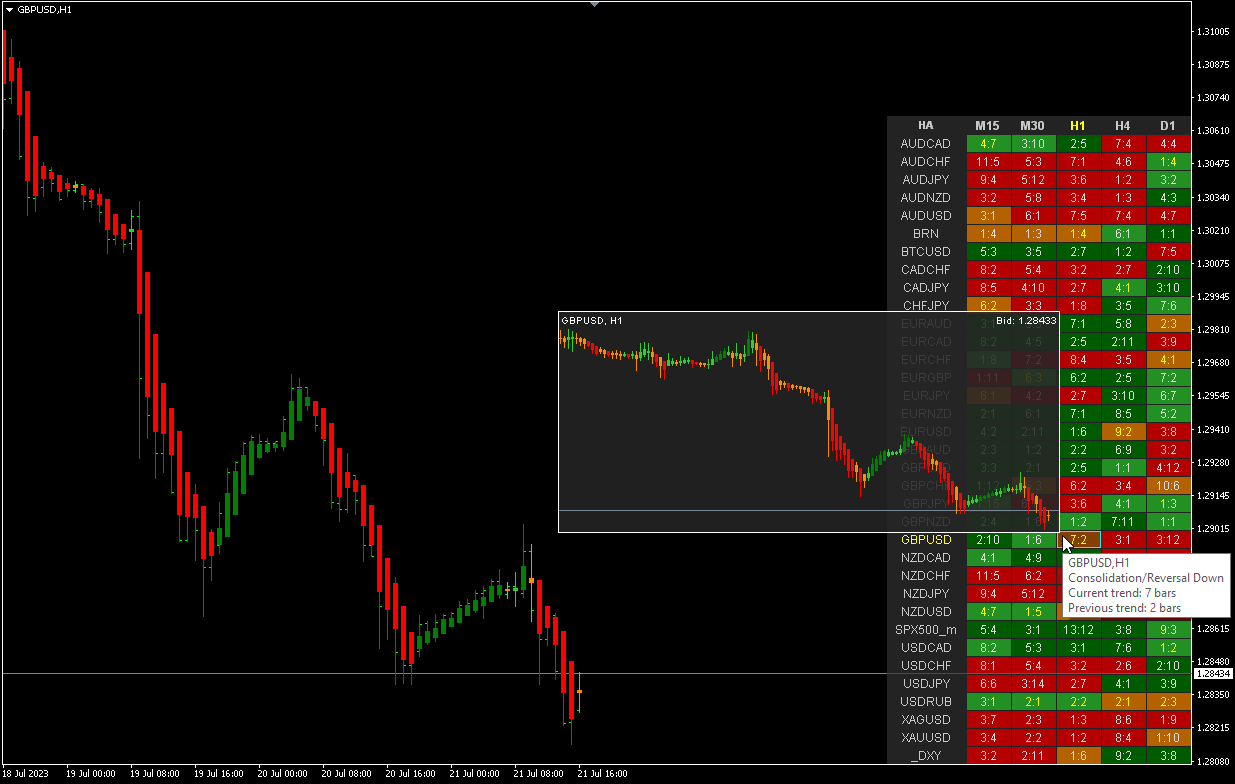
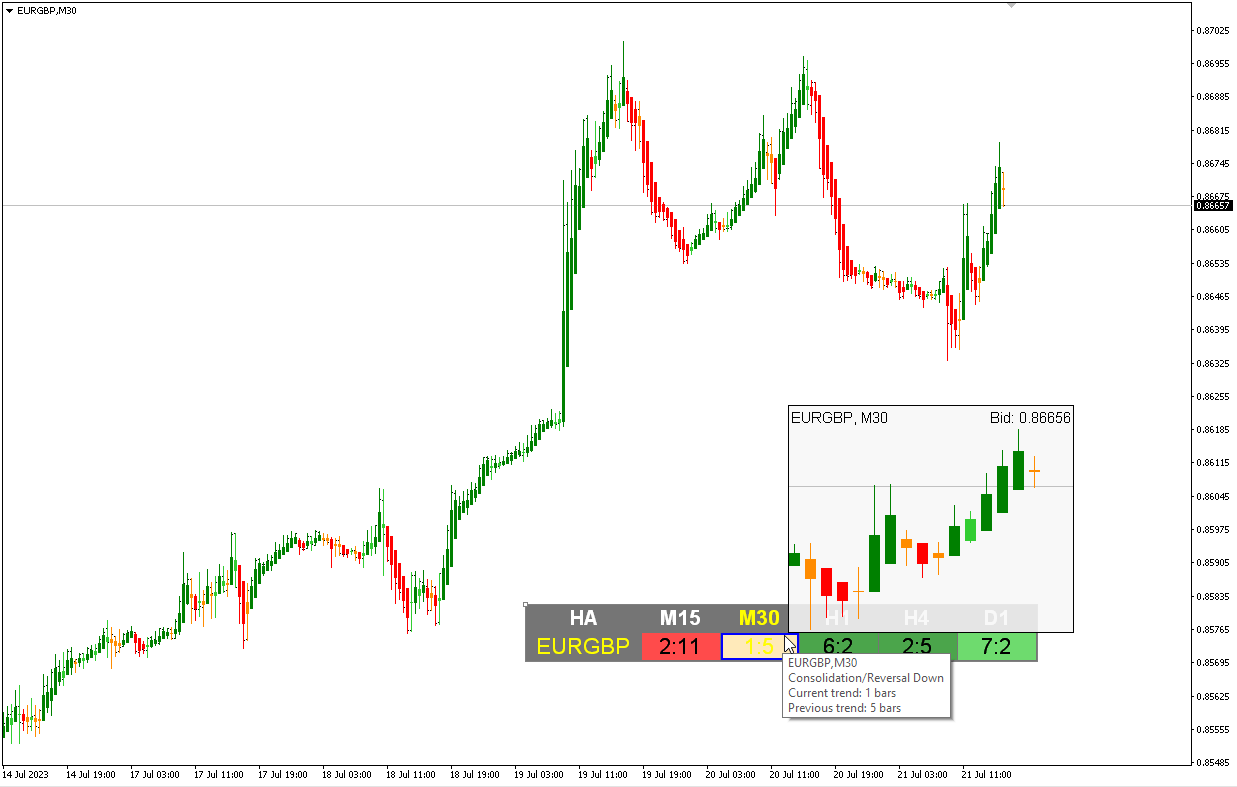
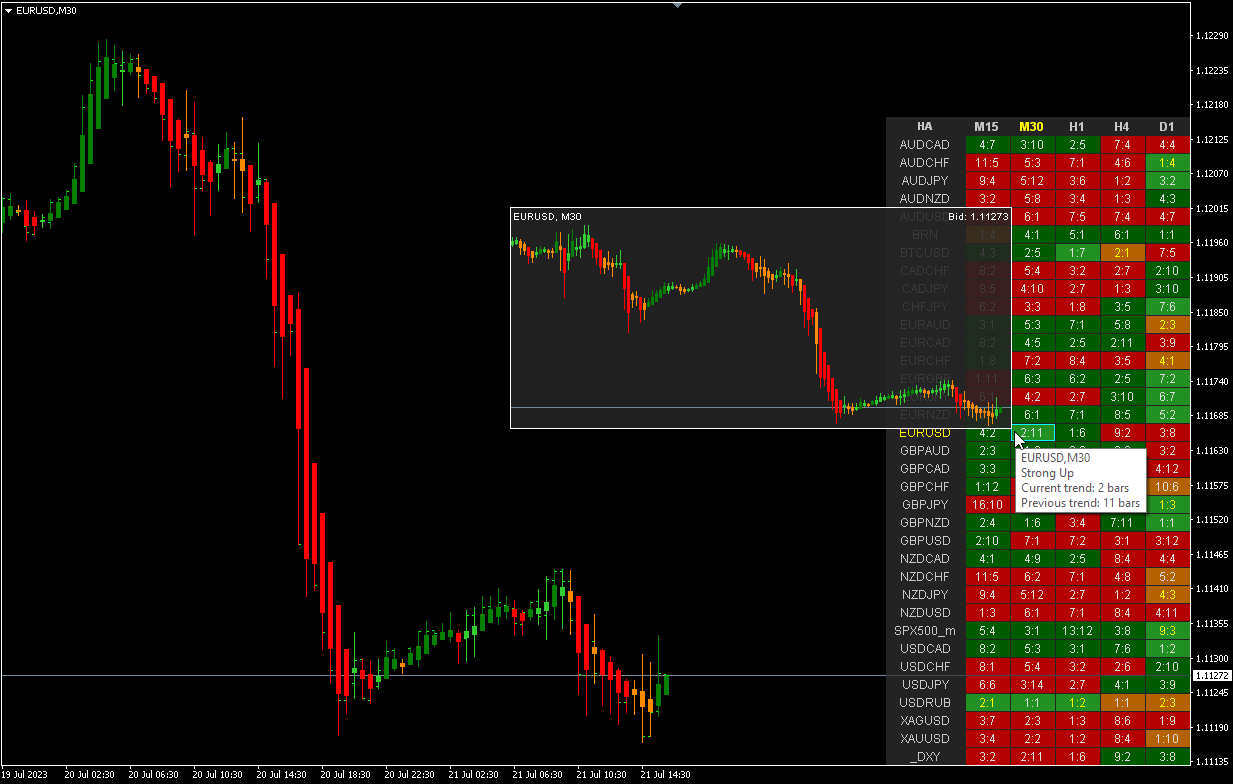
Multi-currency and multitimeframe Heikin Ashi indicator. Shows the current state of the market. On the scanner panel you can see the direction, strength and number of bars of the current trend. The Consolidation/Reversal candles are also shown using color. You can specify any desired currencies and periods in the parameters. Also, the indicator can send notifications when the trend changes or when reversal and consolidation candles (dojis) appear. By clicking on a cell, this symbol and period will be opened. This is MTF Scanner — HA Dashboard
Heikin-Ashi is a Japanese trading indicator and financial chart that means "average pace". Heikin-Ashi charts resemble candlestick charts, but have a smoother appearance as they track a range of price movements, rather than tracking every price movement as with candlesticks. Heikin-Ashi was created in the 1700s by Munehisa Homma, who also created the candlestick chart. These charts are used by traders and investors to help determine and predict price movements.
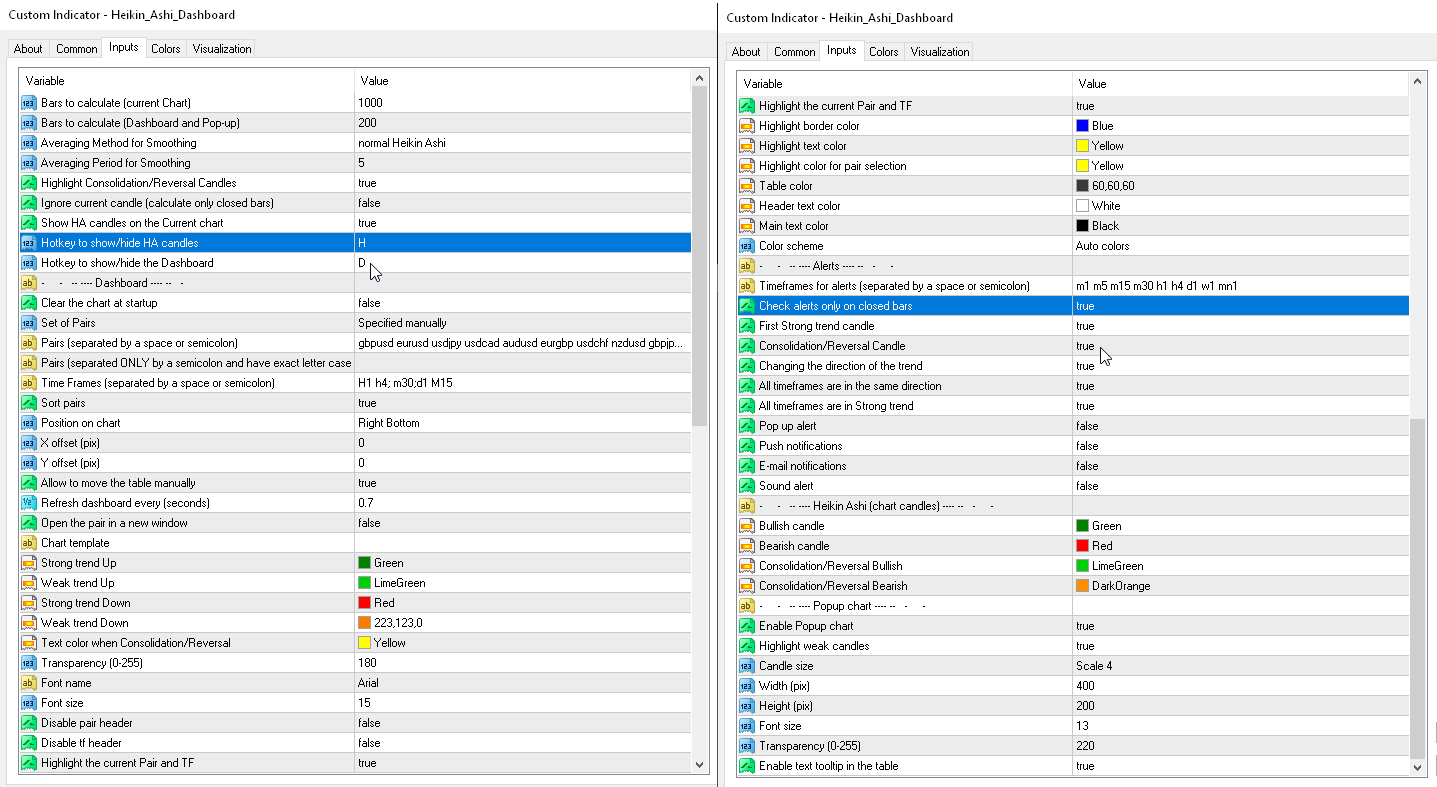
Parameters
- Averaging Method for Smoothing — selection of a method for smoothing candle prices.
— Simple MA
— Exponential MA
— Smoothed MA
— Linear weighted MA
— normal Heikin Ashi
- Averaging Period for Smoothing — selection of the period for smoothing
- Ignore current candle (calculate only closed bars) — disable display of the current (not closed) candle.
- Show HA candles on the current chart — Heiken Ashi candles will be drawn on the current chart.
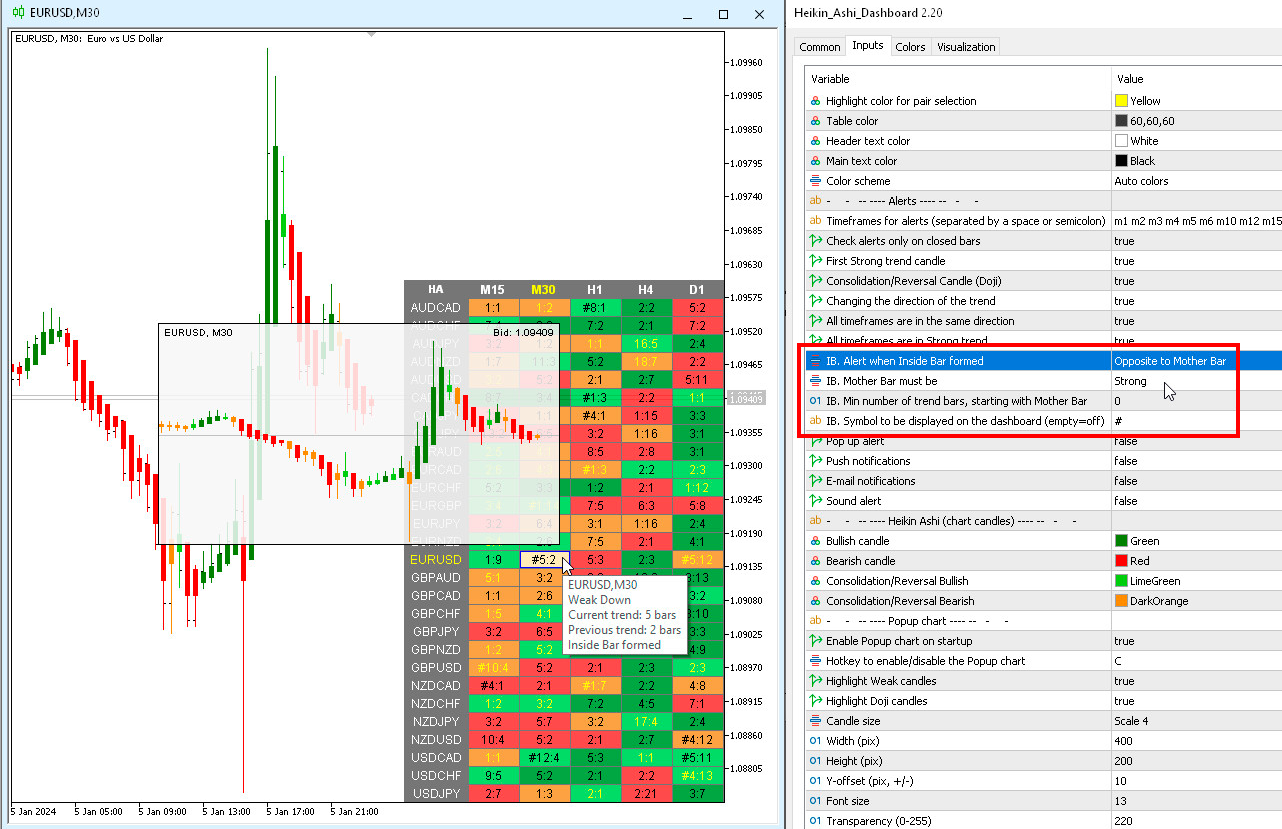
- Show Consolidation/Reversal Candles (Doji).
- Doji. Body length to the Candle length ratio, % (body<=%) — parameter sets the size of the candle body as a percentage relative to the size of the entire candle. The body should be <= to this percentage.
- Doji. Wick length to the Candle length ratio, % (each wick>=%) — parameter sets the size of the upper and lower wicks as a percentage, relative to the size of the entire candle. Each wick must be >= to this percentage.
- Hotkey to show/hide HA candles.
- Hotkey to show/hide the Dashboard.
Set of Pairs — set of symbols
— Market Watch — pairs from the "Market Watch" of the MT.— Specified manually — pairs specified manually, in the parameters "Pairs".— Current pair — show only the current pair.
Pairs (separated by a space or semicolon) — list of symbols separated by spaces or semicolons. The currency names should be written exactly like the broker's, keeping the case and prefix/suffix.
Time Frames (separated by a space or semicolon) — list of timeframes separated by spaces or semicolons (multi timeframe).
Sort pairs — sorting the list of pairs.
Position on chart — corner to display the panel on the chart.
X offset (pix) — shift the panel along the X axis;
Y offset (pix) — shift the panel along the Y axis;
Refresh dashboard every (seconds) — update period for all pairs and timeframes.
Open the pair in a new window — open a symbol in a new chart window by clicking.
Chart template — the name of the template for the chart, if the chart opens in a new window.
Strong trend Up — color for a strong uptrend.
Weak trend Up — color for a weak uptrend.
Strong trend Down — color for a strong downtrend.
Weak trend Down — color for a weak downtrend.
Text color when Consolidation/Reversal — highlight color (and candles on the chart) for consolidation/reversal bars.
Transparency (0-255).
Font name.
Font size.
Check alerts only when the candle is closed.
All timeframes are in Strong trend — These alerts are sent once per bar according to the minimum timeframe in the dashboard. They do not look at the "Timeframes for alerts" parameter.
All timeframes are in the same direction — These alerts are sent once per bar according to the minimum timeframe in the dashboard. They do not look at the "Timeframes for alerts" parameter.

Very good Indicator