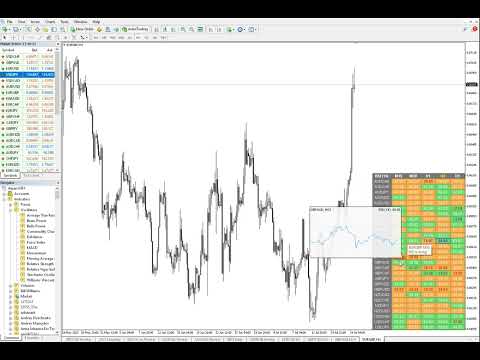
Dashboard RSI Multicurrency
- 지표
- 버전: 5.70
- 업데이트됨: 19 7월 2026
- 활성화: 10

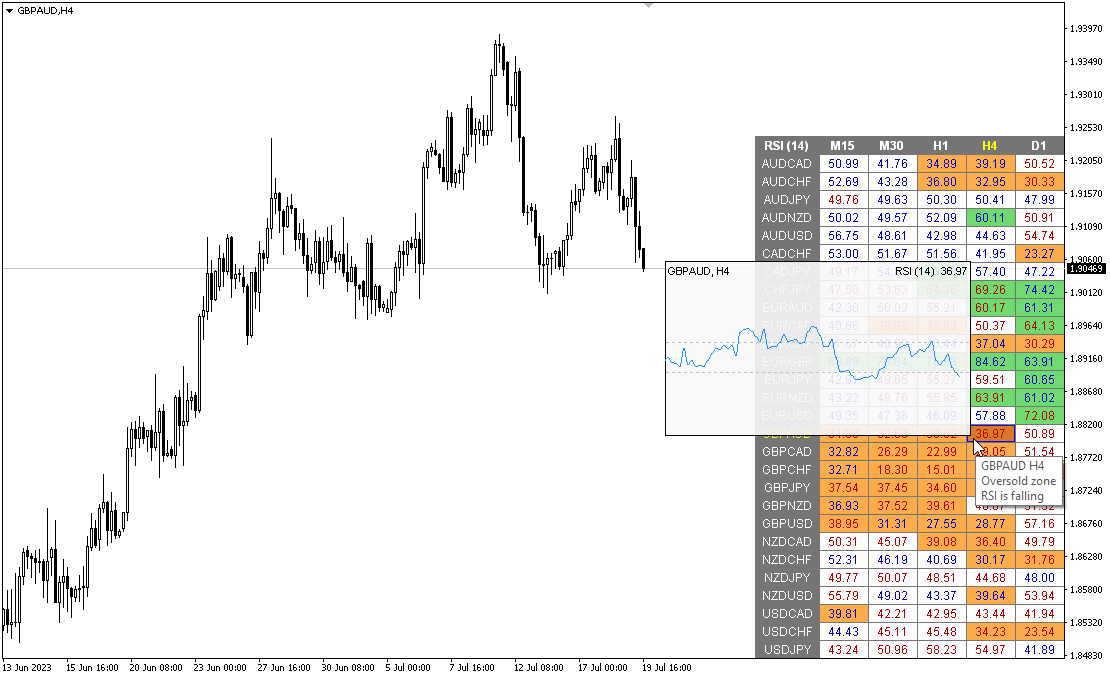
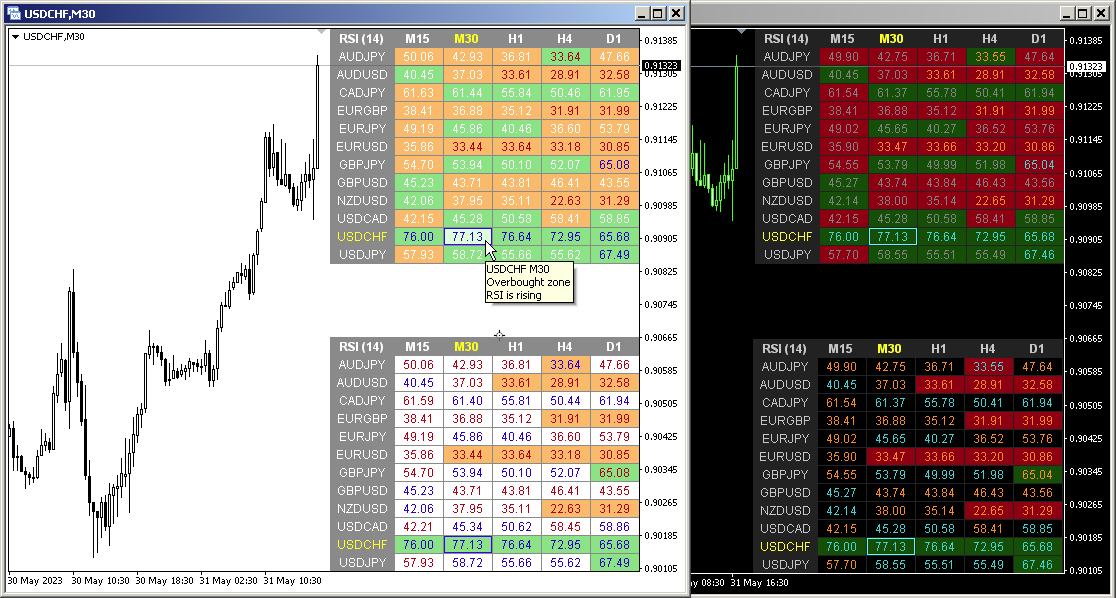
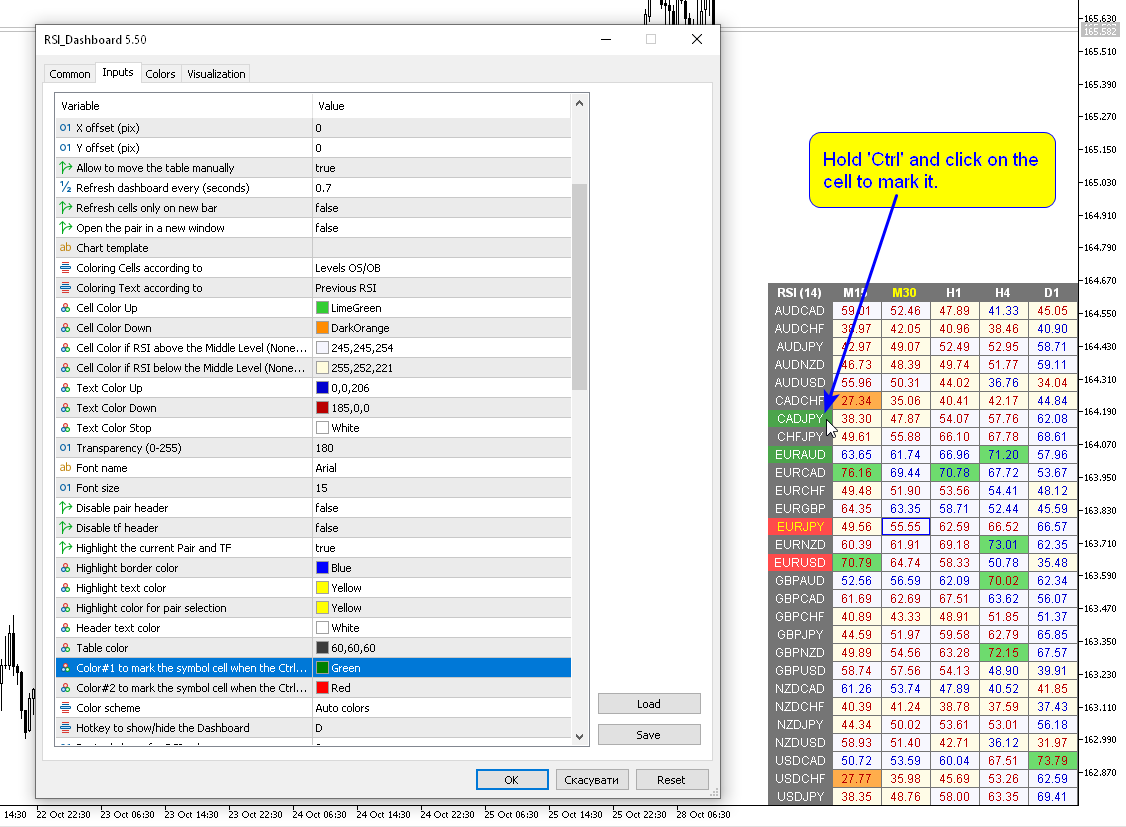
RSI(상대강도지수) 지표의 다중 통화 및 다중 시간대 수정. 매개변수에서 원하는 통화와 기간을 지정할 수 있습니다. 또한 패널은 과매수 및 과매도 수준을 넘을 때 알림을 보낼 수 있습니다. 마침표가 있는 셀을 클릭하면 해당 기호와 마침표가 열립니다. MTF 스캐너입니다.
차트에서 대시보드를 숨기는 키는 기본적으로 "D"입니다
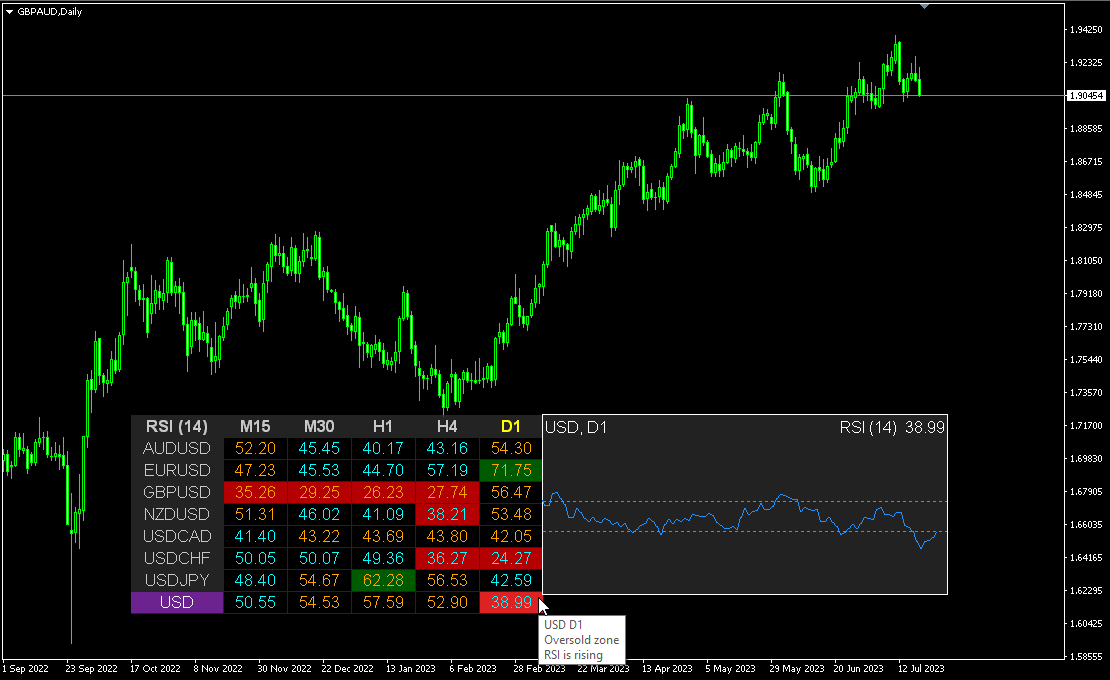
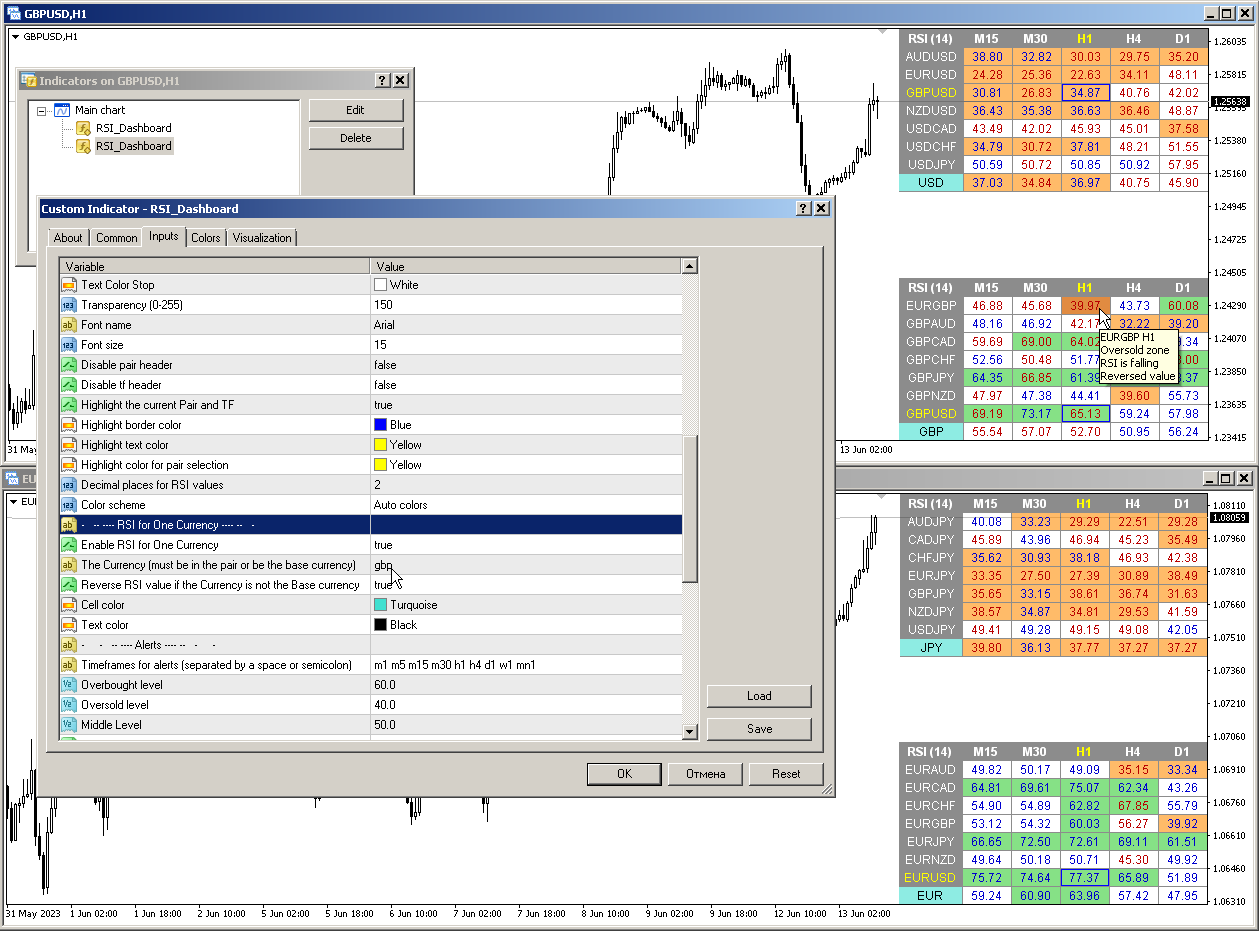
통화 강도 측정기(CSM)와 마찬가지로 대시보드는 지정된 통화가 포함된 쌍 또는 해당 통화가 기본 통화로 포함된 쌍을 자동으로 선택할 수 있습니다. 표시기는 "쌍 집합"에 지정된 모든 쌍에서 통화를 검색합니다. 다른 쌍은 무시됩니다. 그리고 이 쌍을 기반으로 이 통화의 총 RSI가 계산됩니다. 그리고 그 통화가 얼마나 강하거나 약한지 알 수 있습니다.
매개변수
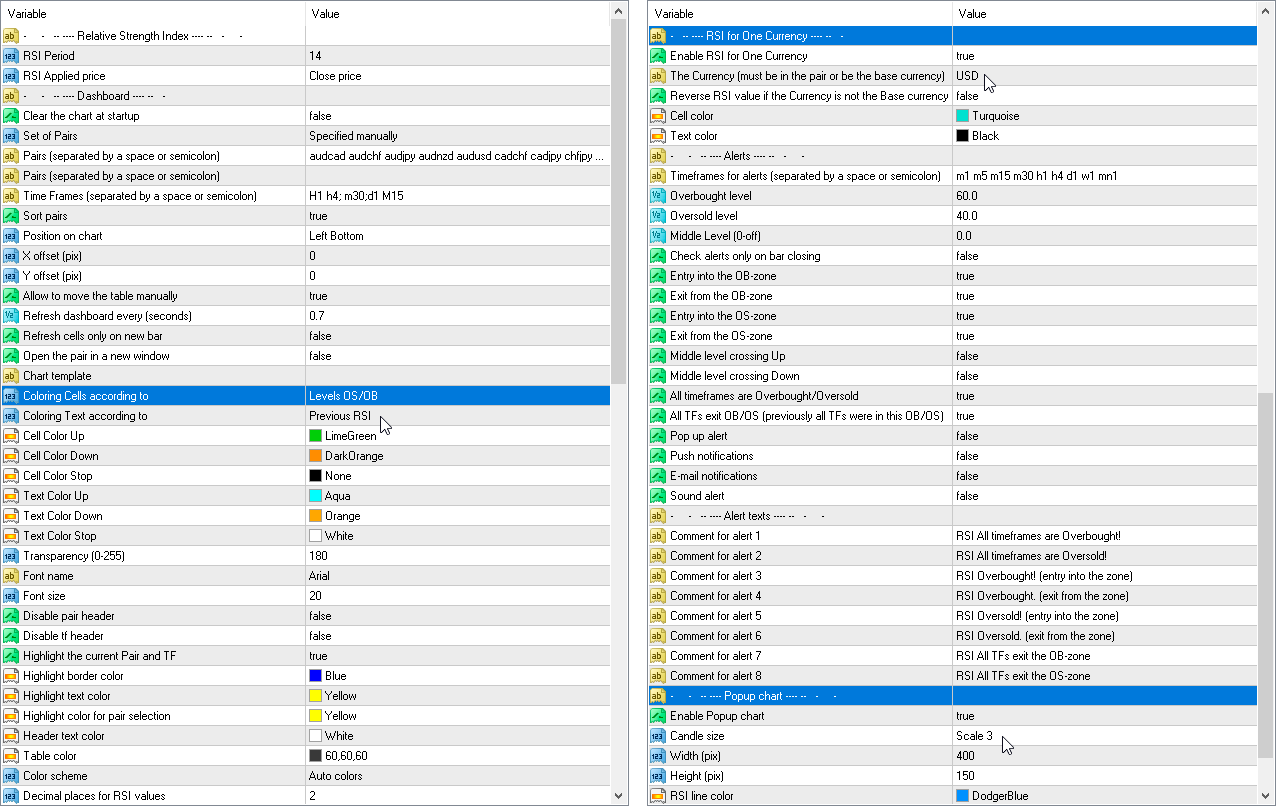
RSI Period — 평균 기간.
RSI Applied price — 가격 유형.
Clear the chart at startup — 시작 시 차트를 지웁니다
Set of Pairs — 기호 집합
— Market Watch — MT의 "Market Watch"에서 나온 쌍입니다.— Specified manually — "쌍" 매개변수에서 쌍이 수동으로 지정됩니다.— Current pair — 현재 쌍만 표시합니다.
Pairs (separated by a space or semicolon) — 공백이나 세미콜론으로 구분된 기호 목록입니다. 통화 이름은 대소문자와 접두사/접미사를 유지하면서 브로커의 이름과 동일하게 작성해야 합니다.
Time Frames (separated by a space or semicolon) — 공백 또는 세미콜론으로 구분된 기간 목록(다중 기간)
Sort pairs — 쌍 목록을 정렬합니다.
Position on chart — 차트에 패널을 표시하는 모서리입니다.
X offset (pix) — X축을 따라 패널을 이동합니다.
Y offset (pix) — Y축을 따라 패널을 이동합니다.
Refresh dashboard every (seconds) — 모든 쌍 및 기간에 대한 업데이트 기간입니다.
Refresh cells only on new bar — 셀 업데이트(및 경고)는 새 막대가 나타날 때만 발생합니다.
Open the pair in a new window — 클릭하여 새 차트 창에서 기호를 엽니다.
Chart template — 차트가 새 창에서 열리는 경우 차트 템플릿의 이름입니다.
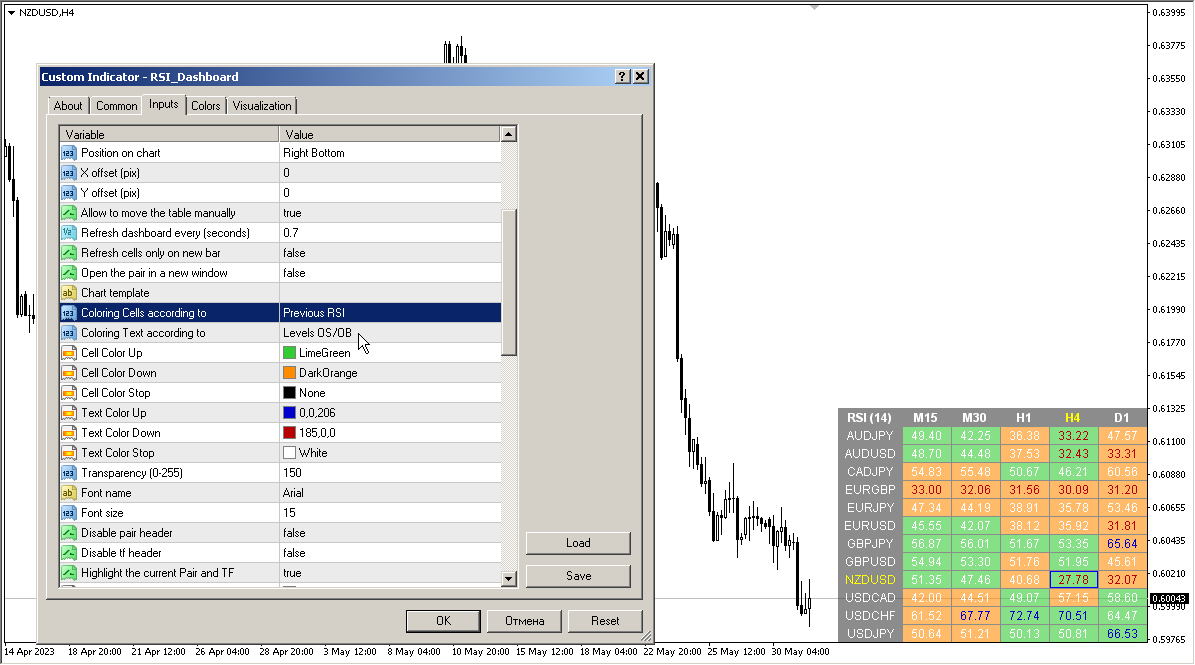
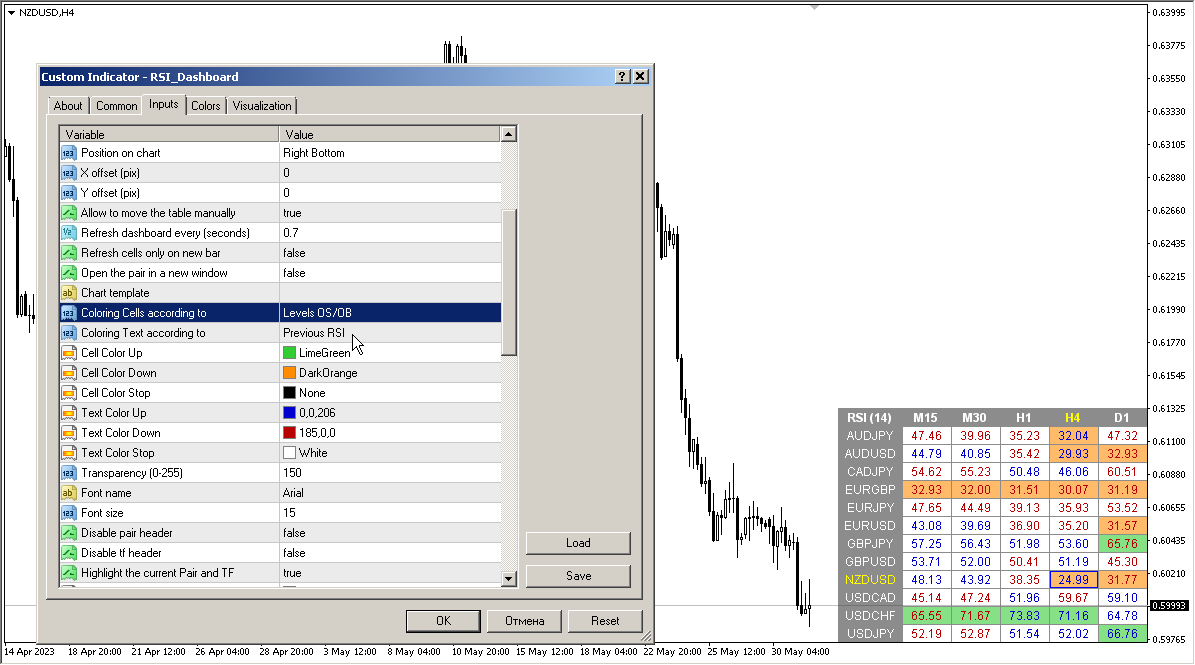
Coloring the cells according to the — 과매수/과매도 수준 또는 이전 캔들의 방향에 따라 테이블의 셀을 색칠합니다.
Color Up — 표시기가 증가하는 경우 셀 색상입니다.
Color Down — 표시기가 감소하는 경우 셀 색상입니다.
Color Stop — 표시기가 변경되지 않는 경우 셀 색상입니다.
Transparency (0-255) — 패널의 투명도입니다.
Font name — 글꼴 이름입니다.
Font size — 글꼴 크기.
경고
Timeframes for alerts (separated by a space or semicolon) — 경고가 전송될 기간 목록(공백 또는 세미콜론으로 구분)
Overbought level — 경고에 대한 과매수 수준입니다.
Oversold level — 경고에 대한 과매도 수준입니다.
Middle Level — 중간 수준
Check alerts only on bar closing — 바 폐쇄 시에만 경보를 확인하십시오. 바 폐쇄 후에만 수평 교차점을 확인하십시오.
Entry into the OB-zone — OB존 진입
Exit from the OB-zone — OB 구역에서 나가기
Entry into the OS-zone — OS 영역 진입
Exit from the OS-zone — OS 영역에서 나가기
Middle level crossing Up — 중간 레벨 교차 업
Middle level crossing Down — 중간 레벨 교차 아래로
Alert when RSI direction changes — RSI 방향이 변경되면 경고
All timeframes are Overbought/Oversold — 모든 기간은 과매수/과매도 상태입니다.
All TFs exit OB/OS (previously all TFs were in this OB/OS) — 모든 TF가 OB/OS를 종료합니다(이전에는 모든 TF가 이 OB/OS에 있었습니다).
Pop up alert — 팝업 경고.
Push notifications — 푸시 알림.
E-mail notifications — 이메일 알림.
Sound alert — 소리 알림.


hello I have RSI dashboard and Stochastic dashbord. I need something for alert system. I really like your dashboards. But I need something more useful. If you can add it I will be very happy.. Example: When the RSI is over 70 on the H1 and at the same time The RSI is under the 30 on the M1 , Can be an alert for it ? When the RSI is under 30 on the H1 and at the same time The RSI is over the 70 on the M1 , Can be an alert for it ? I mean that when a timeframe is over 70 and the other timeframe is under 30 , there will be an alert for it