Dashboard RSI Multicurrency
- Indicadores
- Versão: 5.70
- Atualizado: 19 julho 2026
- Ativações: 10

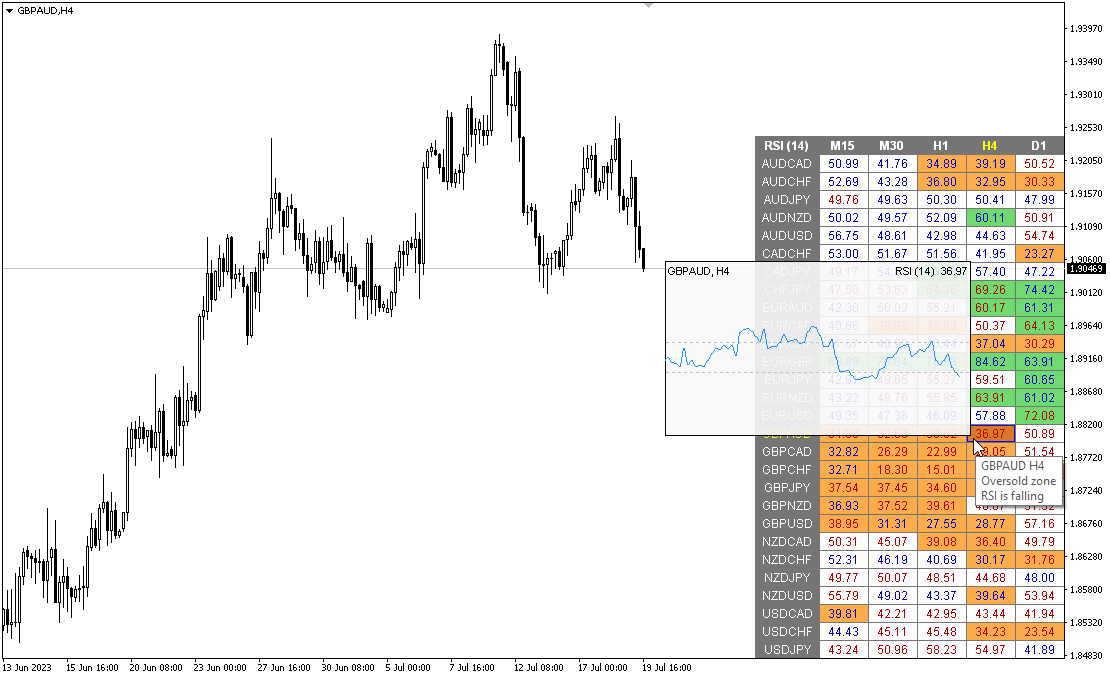
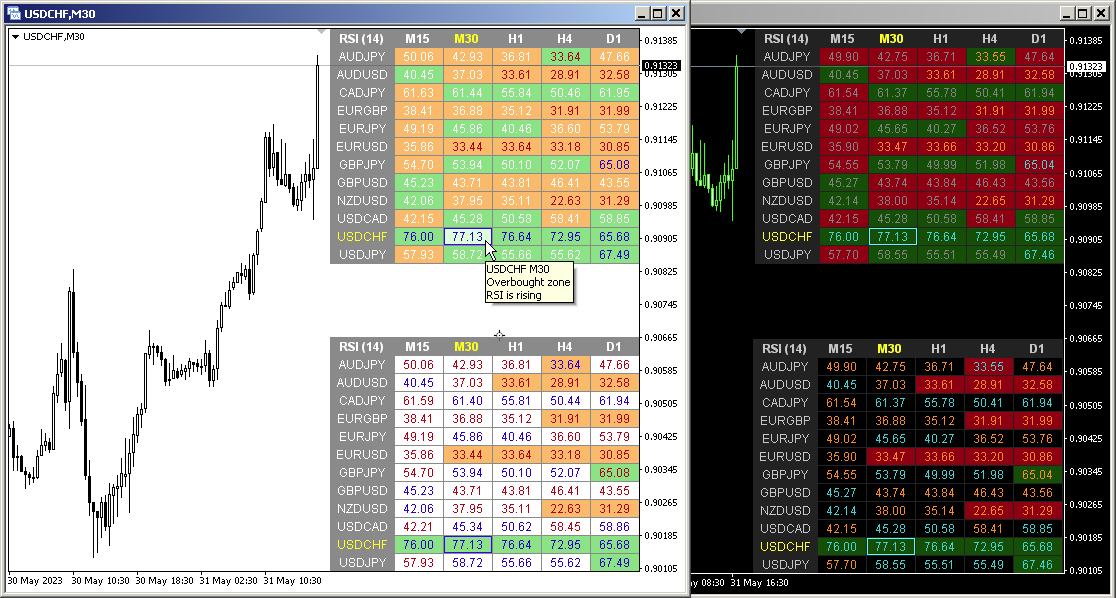
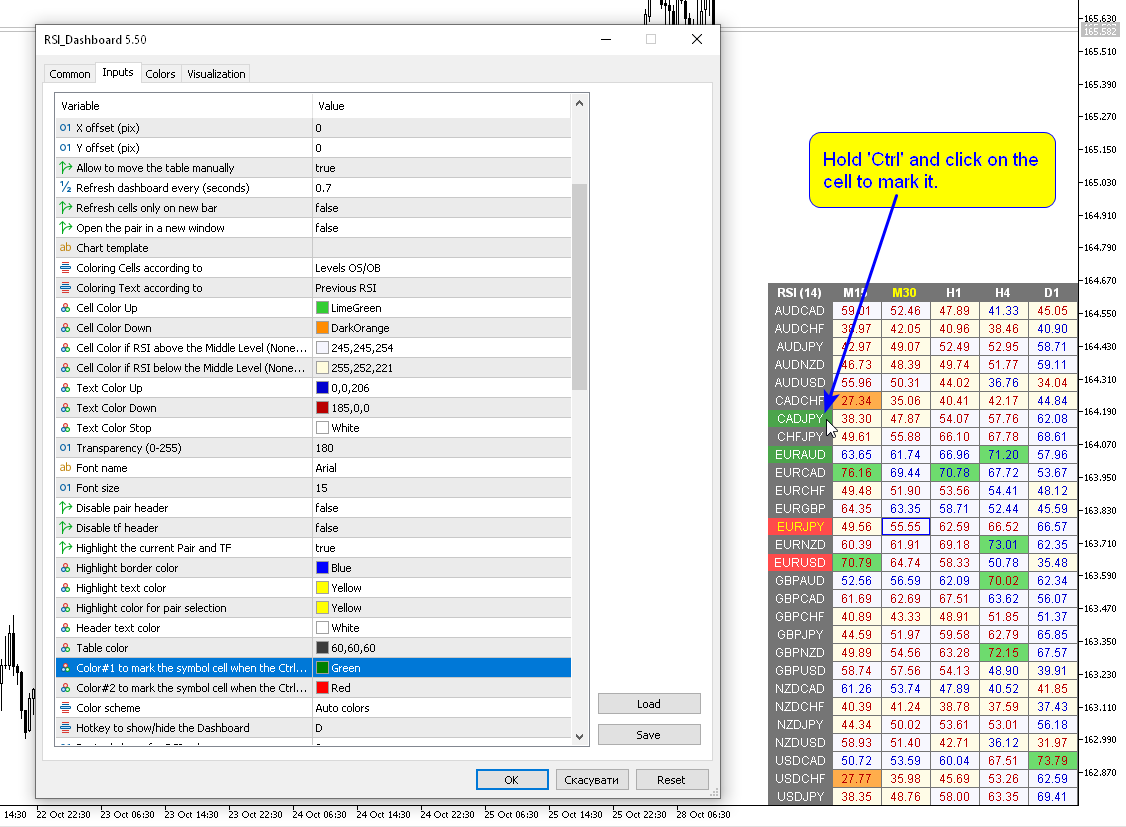
Modificação multimoeda e multitimeframe do indicador Índice de Força Relativa (RSI). Você pode especificar quaisquer moedas e prazos desejados nos parâmetros. Além disso, o painel pode enviar notificações ao cruzar níveis de sobrecompra e sobrevenda. Ao clicar em uma célula com ponto final, este símbolo e ponto final serão abertos. Este é o scanner MTF.
A chave para ocultar o painel do gráfico é “D” por padrão
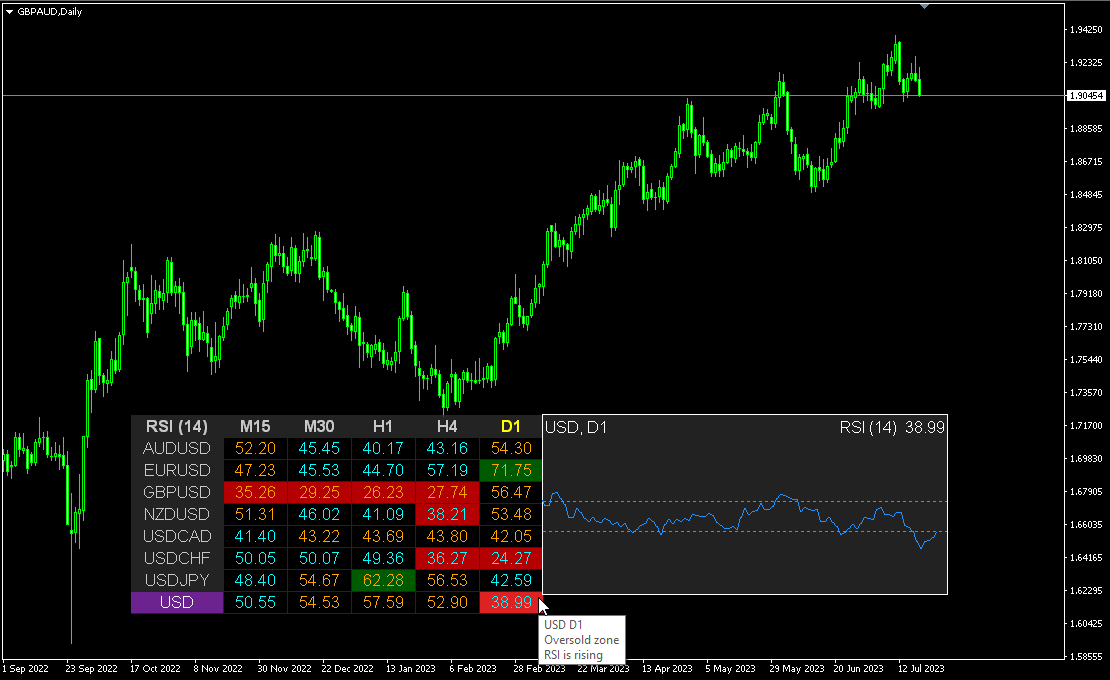
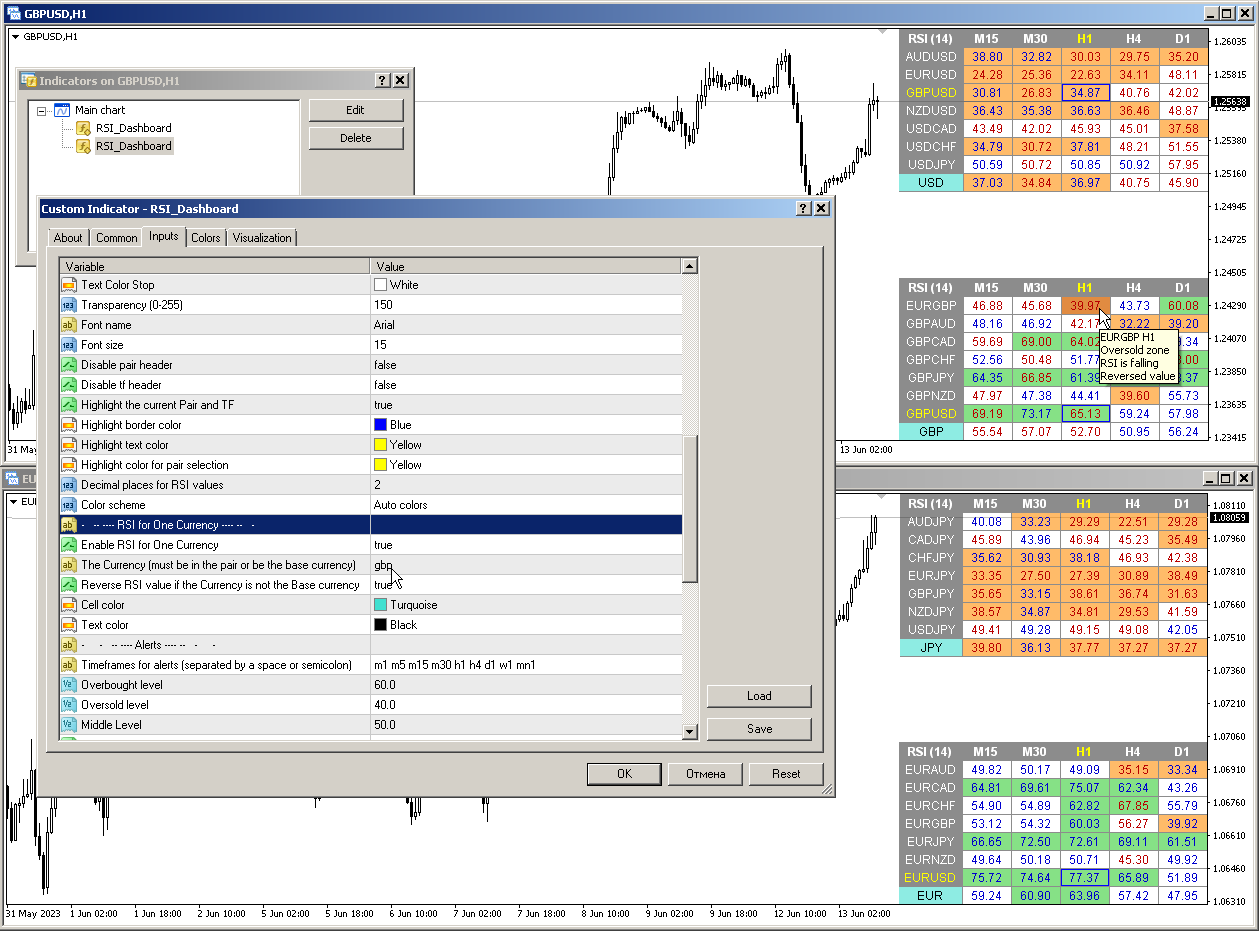
Semelhante ao Medidor de Força da Moeda, o Painel pode selecionar automaticamente pares que contenham uma moeda específica ou aqueles pares que tenham essa moeda como moeda base. O indicador procura Moeda em todos os pares especificados no “Conjunto de Pares”; outros pares são ignorados. E com base nesses pares, o RSI total para esta moeda é calculado. E você pode ver quão forte ou fraca é essa moeda.
Parâmetros
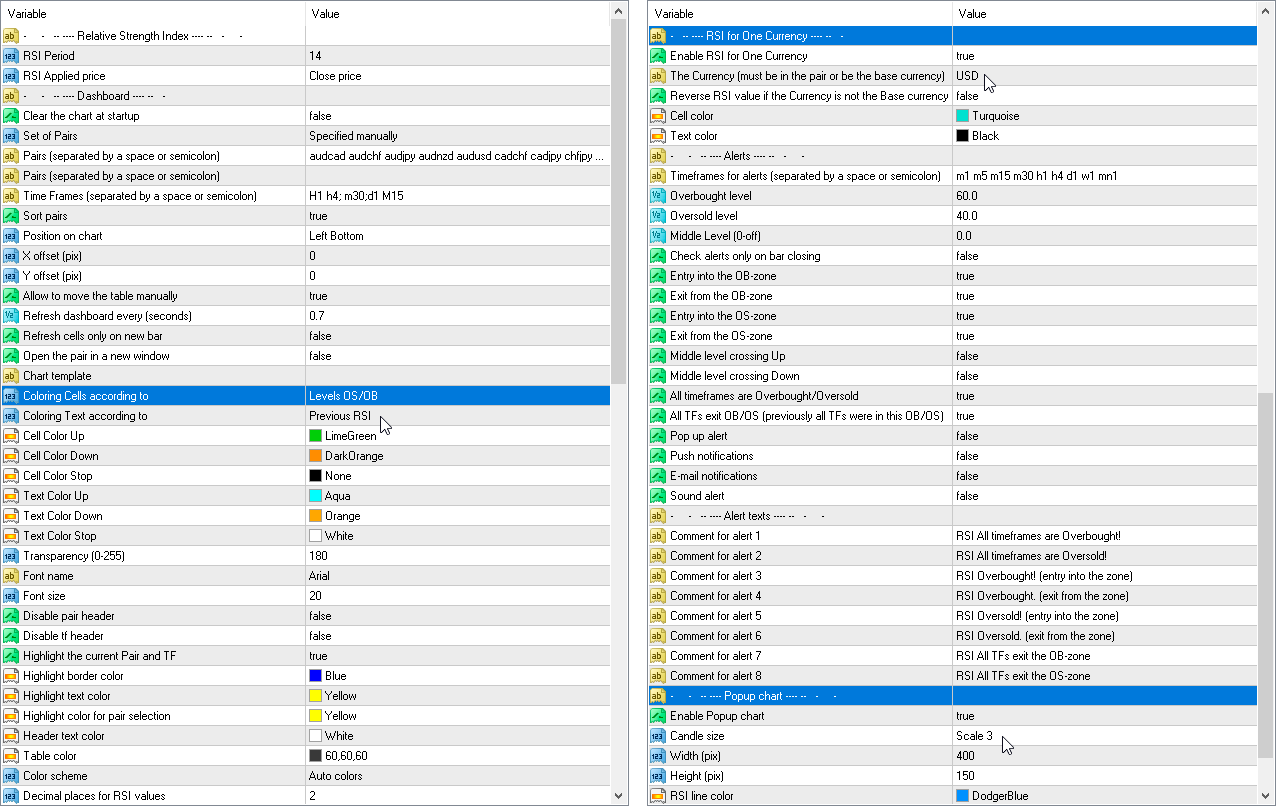
RSI Period — período médio.
RSI Applied price — tipo de preço.
Clear the chart at startup — limpe o gráfico na inicialização
Set of Pairs — conjunto de símbolos
— Market Watch — Pares do "Market Watch" do MT.— Specified manually — pares especificados manualmente, nos parâmetros "Pares".— Current pair — mostra apenas o par atual.
Pairs (separated by a space or semicolon) — lista de símbolos separados por espaço ou ponto e vírgula. Os nomes das moedas devem ser escritos exatamente como os da corretora, mantendo a caixa e o prefixo/sufixo.
Time Frames (separated by a space or semicolon) — lista de prazos separados por espaços ou ponto e vírgula (vários prazos).
Sort pairs — classificando a lista de pares.
Position on chart — canto para exibir o painel no gráfico.
X offset (pix) — desloca o painel ao longo do eixo X;
Y offset (pix) — desloca o painel ao longo do eixo Y;
Refresh dashboard every (seconds) — período de atualização para todos os pares e intervalos de tempo.
Refresh cells only on new bar — as atualizações (e alertas) das células só ocorrerão quando uma nova barra aparecer.
Open the pair in a new window — abra um símbolo em uma nova janela do gráfico clicando.
Chart template — o nome do modelo do gráfico, se o gráfico for aberto em uma nova janela.
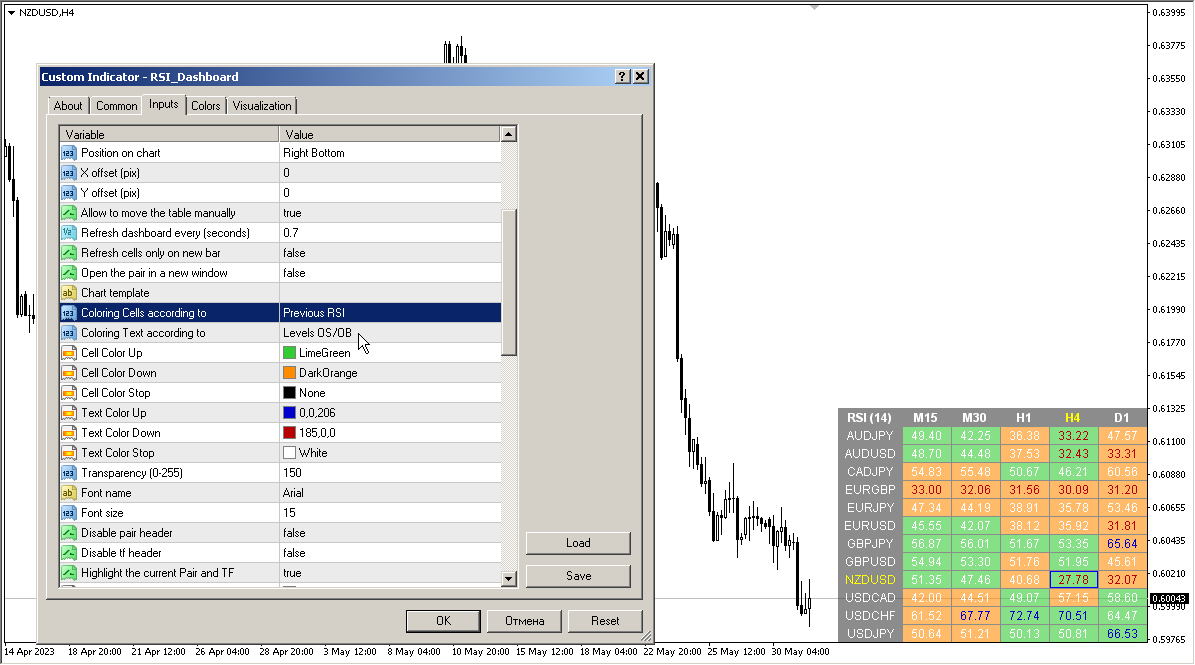
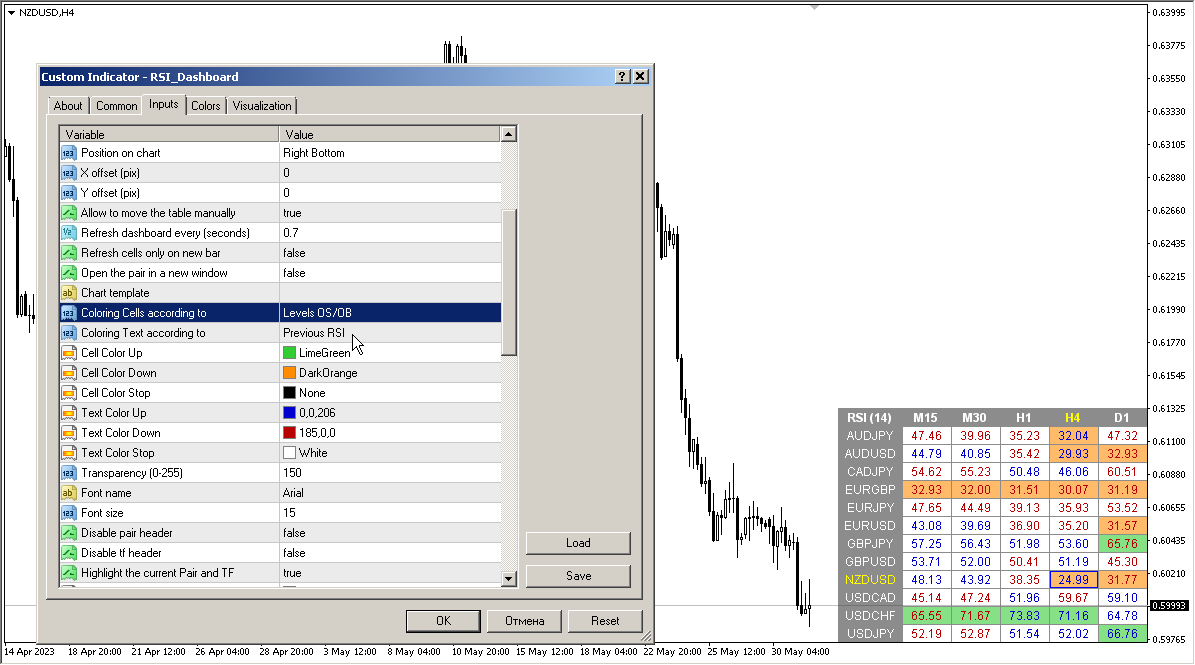
Coloring the cells according to the — pinte as células da tabela de acordo com os níveis de sobrecompra/sobrevenda ou de acordo com a direção da vela anterior.
Color Up — cor da célula se o indicador aumentar.
Color Down — cor da célula se o indicador diminuir.
Color Stop — cor da célula se o indicador não mudar.
Transparency (0-255) — transparência do painel.
Font name — nome da fonte.
Font size — tamanho da fonte.
Alertas
Timeframes for alerts (separated by a space or semicolon) — lista de períodos para os quais o alerta será enviado (separados por espaço ou ponto e vírgula).
Overbought level — nível de sobrecompra para alertas.
Oversold level — nível de sobrevenda para alertas.
Middle Level — Nível médio
Check alerts only on bar closing — verifique a passagem de nível somente após o fechamento da barra.
Entry into the OB-zone — Entrada na zona OB
Exit from the OB-zone — Sair da zona OB
Entry into the OS-zone — Entrada na zona do sistema operacional
Exit from the OS-zone — Sair da zona do sistema operacional
Middle level crossing Up — Passagem de nível médio para cima
Middle level crossing Down — Passagem de nível médio para baixo
Alert when RSI direction changes — Alerta quando a direção do RSI muda
All timeframes are Overbought/Oversold — Todos os prazos estão sobrecomprados/sobrevendidos
All TFs exit OB/OS (previously all TFs were in this OB/OS) — Todos os TFs saem do OB/OS (anteriormente todos os TFs estavam neste OB/OS)
Pop up alert — alerta pop-up.
Push notifications — notificação push.
E-mail notifications — notificação por e-mail.
Sound alert — sound alert — alerta sonoro.


hello I have RSI dashboard and Stochastic dashbord. I need something for alert system. I really like your dashboards. But I need something more useful. If you can add it I will be very happy.. Example: When the RSI is over 70 on the H1 and at the same time The RSI is under the 30 on the M1 , Can be an alert for it ? When the RSI is under 30 on the H1 and at the same time The RSI is over the 70 on the M1 , Can be an alert for it ? I mean that when a timeframe is over 70 and the other timeframe is under 30 , there will be an alert for it