Dashboard RSI Multicurrency
- インディケータ
- バージョン: 5.70
- アップデート済み: 19 7月 2026
- アクティベーション: 10

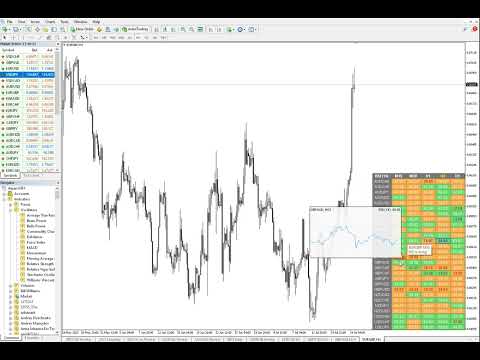
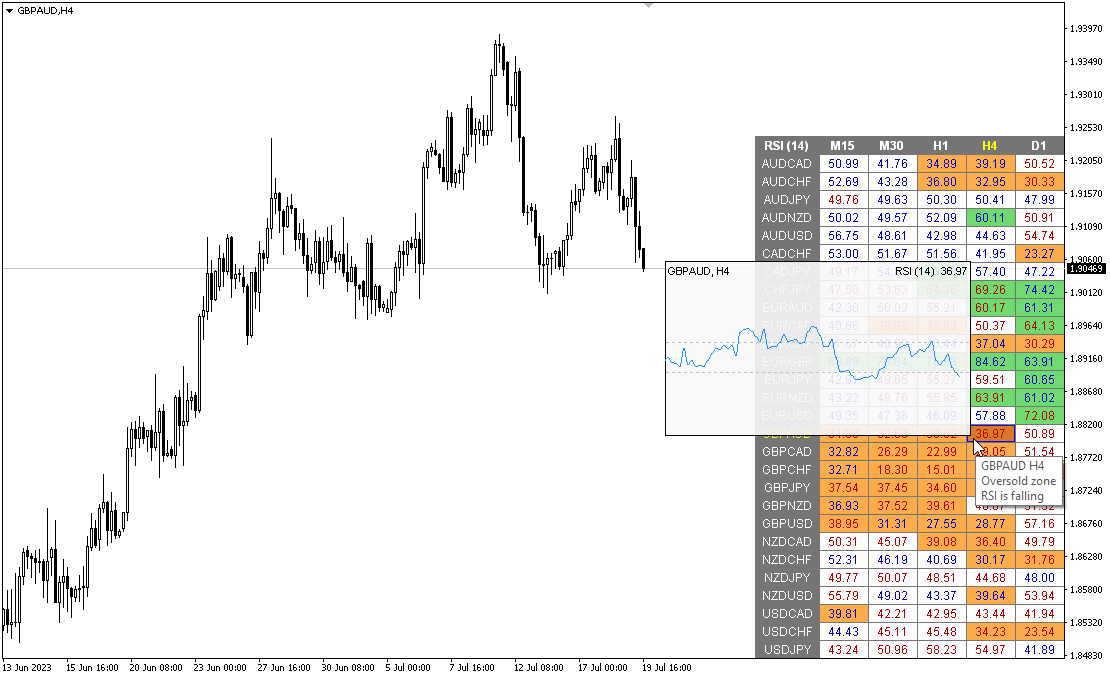
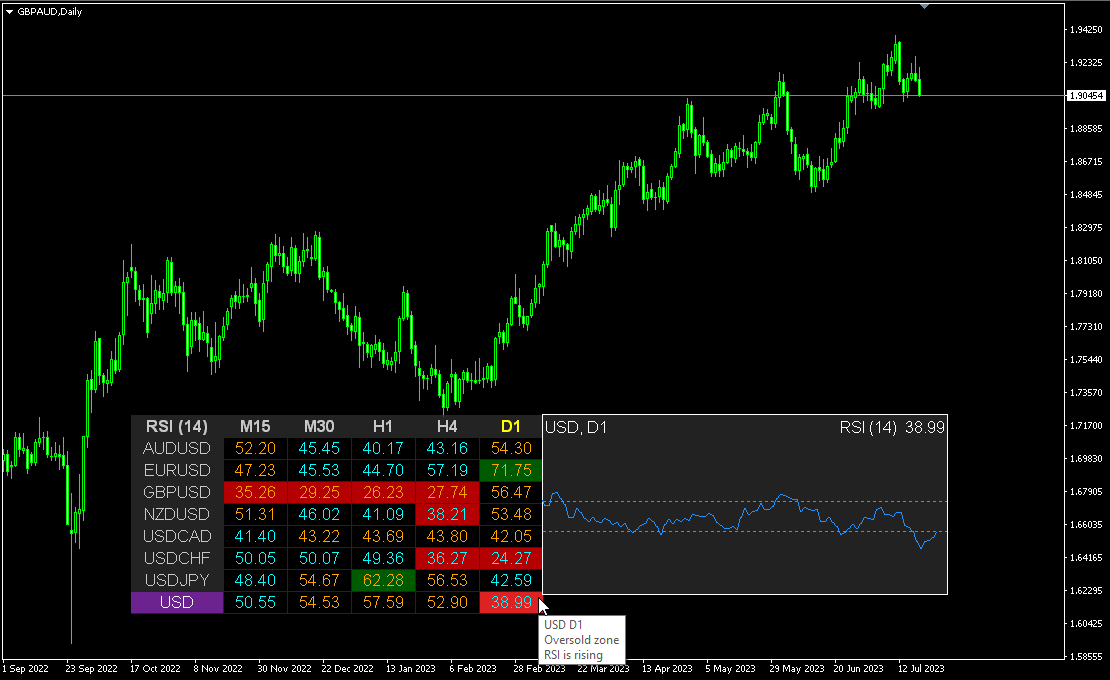
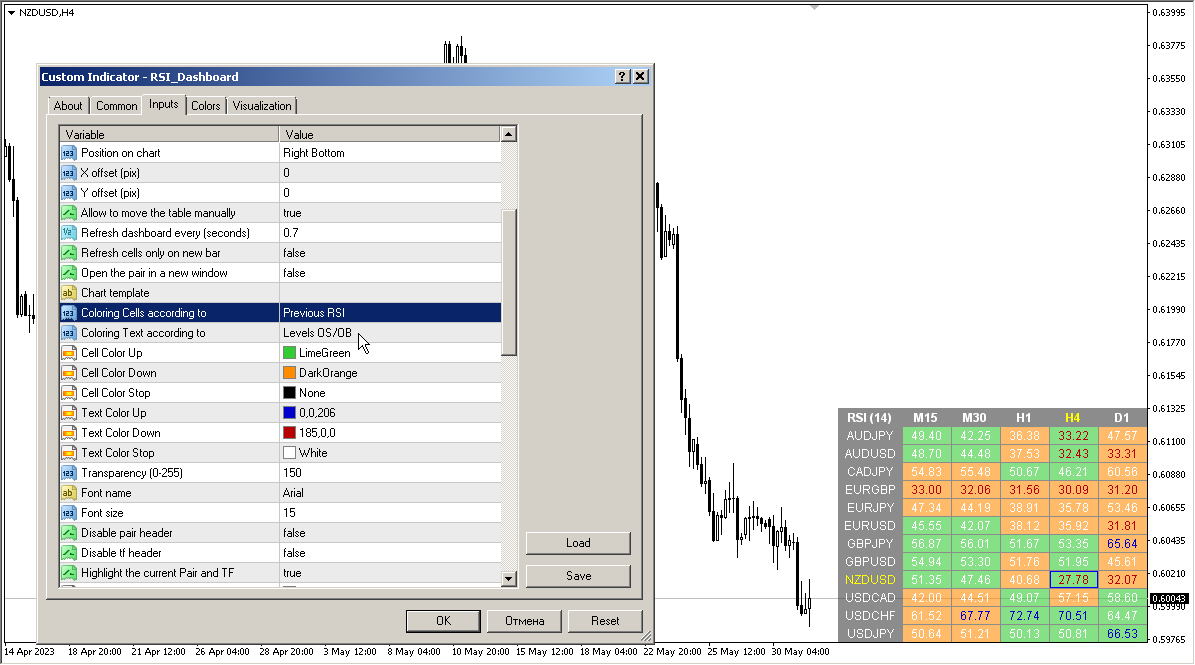
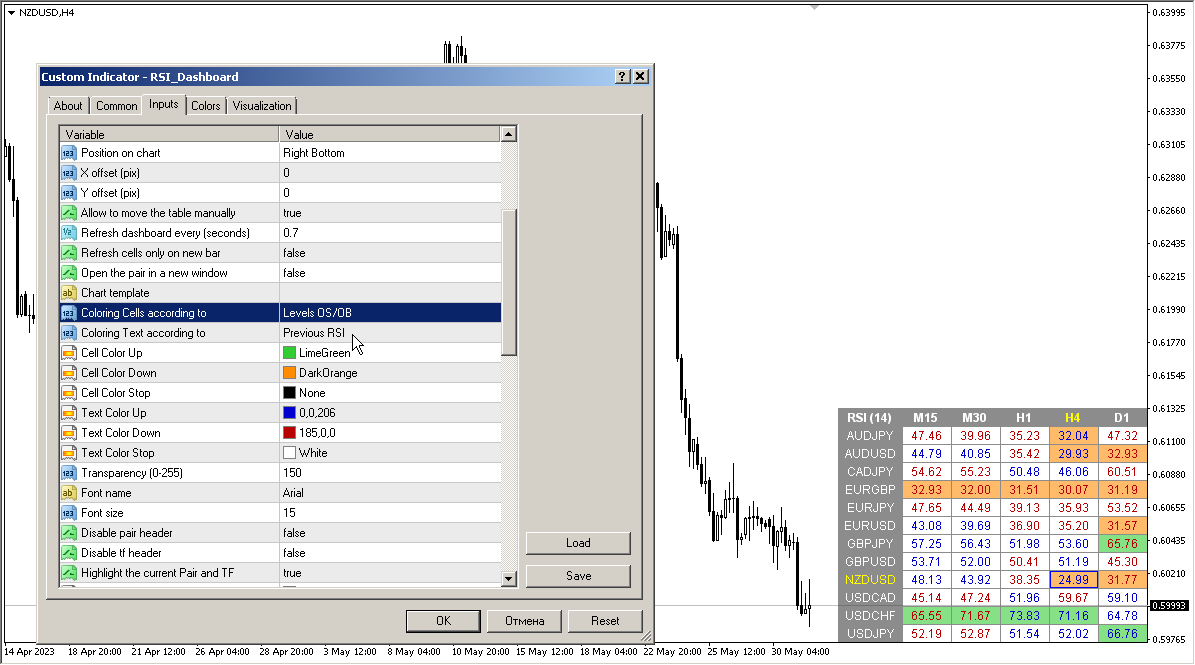
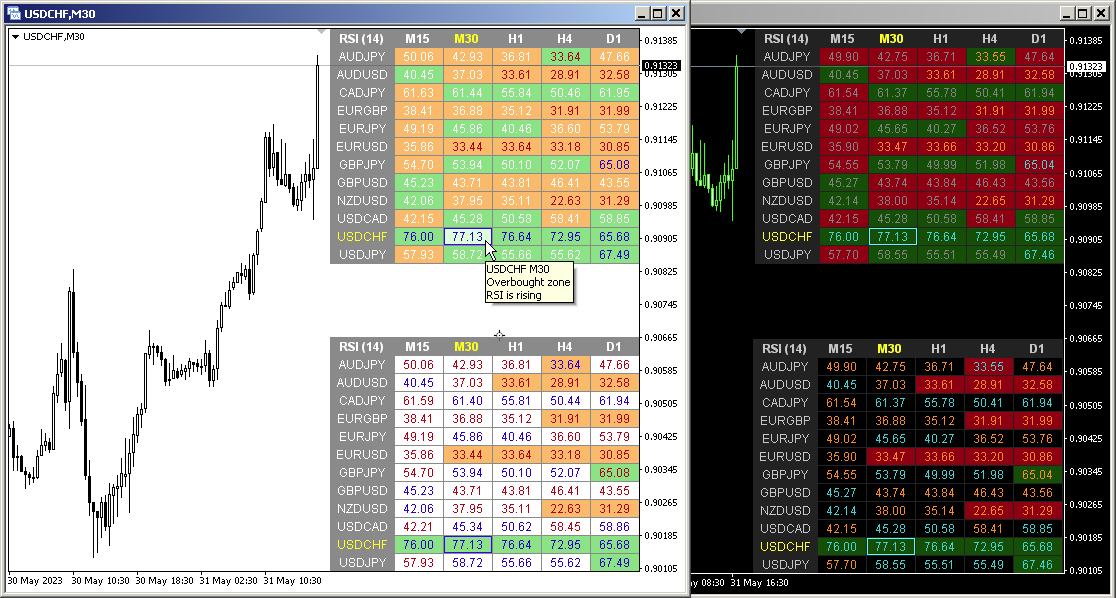
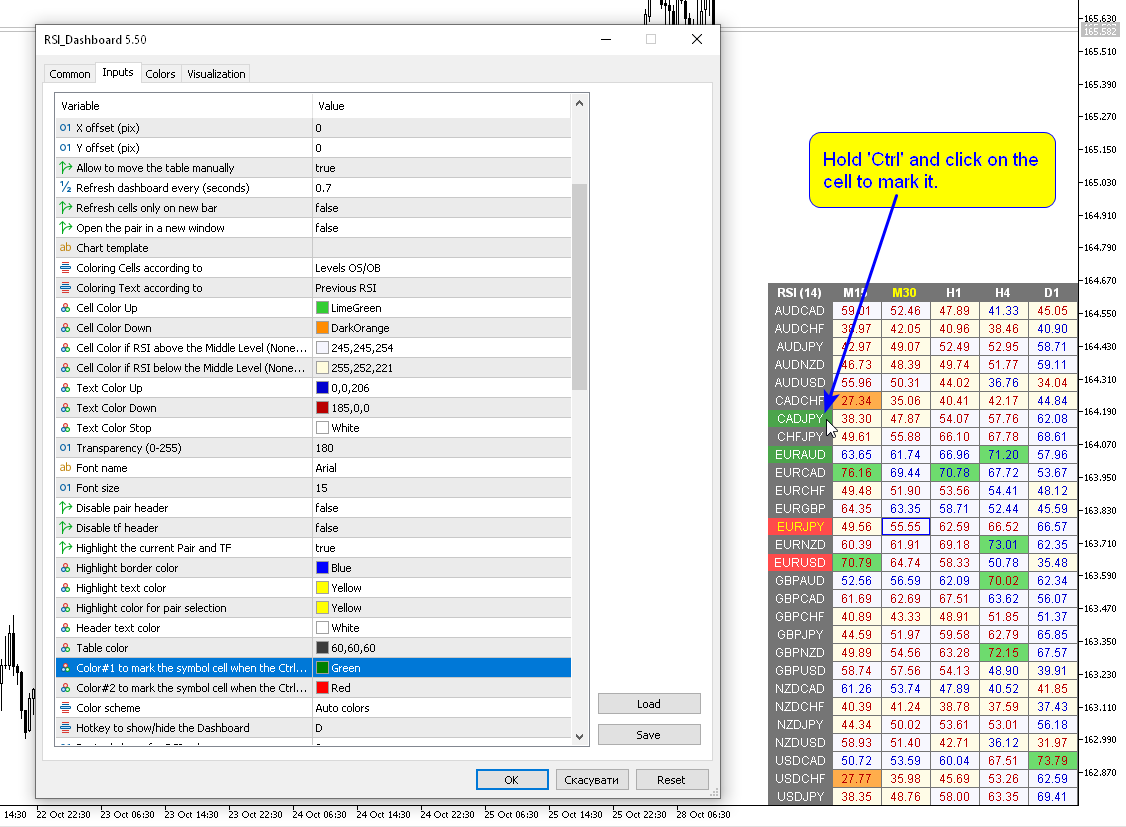
相対力指数 (RSI) インジケーターのマルチ通貨およびマルチタイムフレームの変更。パラメータで任意の通貨とタイムフレームを指定できます。また、パネルは買われすぎレベルと売られすぎレベルを越えたときに通知を送信できます。ピリオドのあるセルをクリックすると、このシンボルとピリオドが開きます。これが MTF スキャナーです。
ダッシュボードをチャートから非表示にするキーは、デフォルトでは「D」です
通貨強度メーター (CSM) と同様に、ダッシュボードは、指定された通貨を含むペア、またはその通貨を基本通貨とするペアを自動的に選択できます。インジケーターは、「ペアのセット」で指定されたすべてのペアで通貨を検索します。他のペアは無視されます。そして、これらのペアに基づいて、この通貨の合計 RSI が計算されます。そして、その通貨がどれだけ強いか弱いかを確認できます.
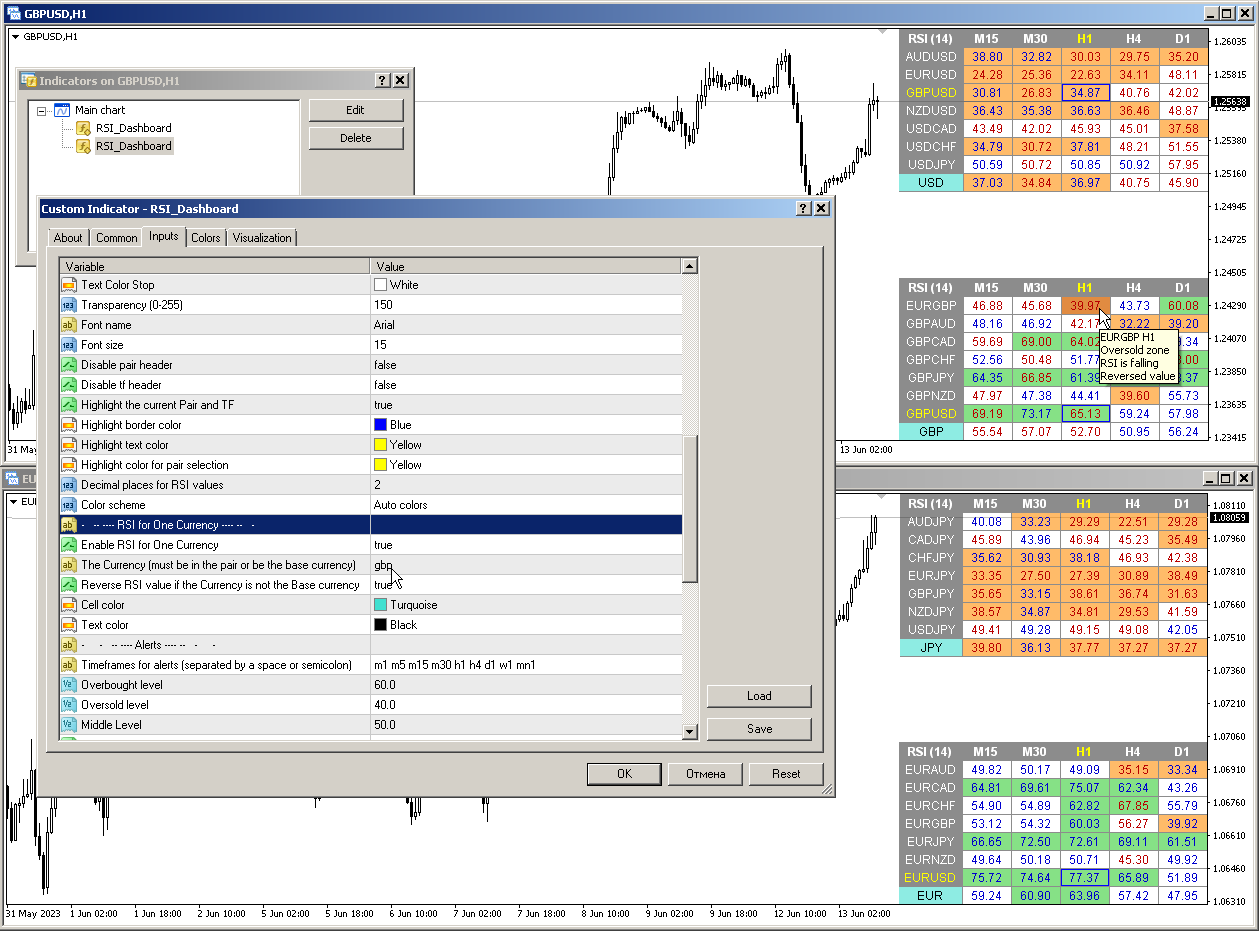
パラメータ
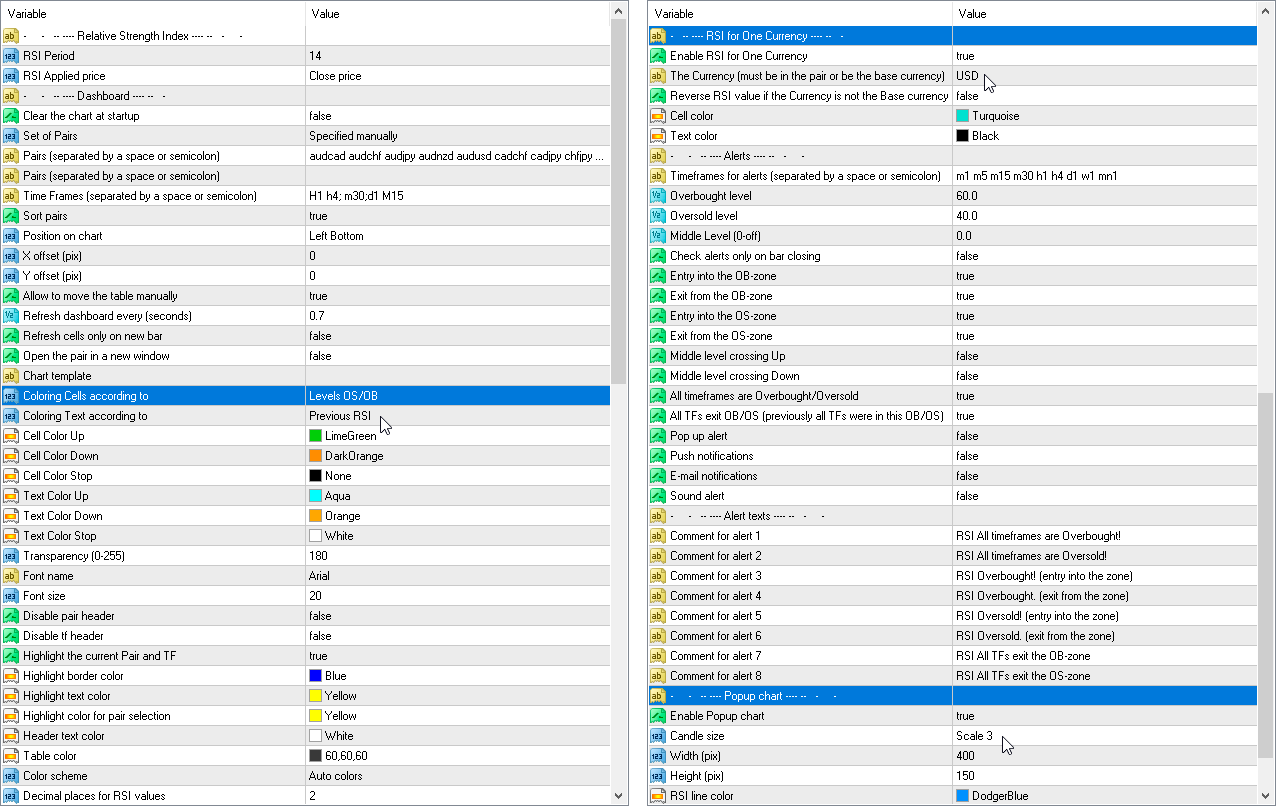
RSI Period — 平均期間。
RSI Applied price — 価格タイプ。
Clear the chart at startup — 起動時にチャートをクリアします
Set of Pairs — シンボルのセット
— Market Watch — MTの「マーケットウォッチ」からのペア。— Specified manually — パラメータ「ペア」で手動で指定されたペア。— Current pair — 現在のペアのみを表示します。
Pairs (separated by a space or semicolon) — スペースまたはセミコロンで区切られたシンボルのリスト。通貨名はブローカーのものとまったく同じように記述し、大文字と小文字、およびプレフィックス/サフィックスを維持する必要があります。
Time Frames (separated by a space or semicolon) — スペースまたはセミコロンで区切られた時間枠のリスト (複数の時間枠)。
Sort pairs — ペアのリストを並べ替えます。
Position on chart — チャート上のパネルを表示するコーナー。
X offset (pix) — X 軸に沿ってパネルをシフトします。
Y offset (pix) — Y 軸に沿ってパネルをシフトします。
Refresh dashboard every (seconds) — すべてのペアと時間枠の更新期間。
Refresh cells only on new bar — 新しいバーが表示されたときにのみセルの更新 (およびアラート) が行われます。
Open the pair in a new window — クリックすると、新しいチャート ウィンドウでシンボルが開きます。
Chart template — チャートが新しいウィンドウで開く場合のチャートのテンプレートの名前。
Coloring the cells according to the — 買われすぎ/売られすぎのレベルまたは前のローソク足の方向に従って、テーブルのセルを塗りつぶします。
Color Up — インジケーターが上昇する場合のセルの色。
Color Down — インジケーターが下落する場合のセルの色。
Color Stop — インジケーターが変化しない場合のセルの色。
Transparency (0-255) — パネルの透明度。
Font name — フォント名。
Font size — フォント サイズ。
アラート
Timeframes for alerts (separated by a space or semicolon) — アラートが送信される期間のリスト (スペースまたはセミコロンで区切る)。
Overbought level — アラートの買われすぎレベル。
Oversold level — アラートの売られすぎレベル。
Middle Level — 中間レベル
Check alerts only on bar closing — バーのクローズ後にのみレベル交差をチェックします。
Entry into the OB-zone — OB ゾーンへのエントリ
Exit from the OB-zone — OB ゾーンからの終了
Entry into the OS-zone — OS ゾーンへのエントリ
Exit from the OS-zone — OS ゾーンからの終了
Middle level crossing Up — 中間レベルが上へ交差
Middle level crossing Down — 中間レベルが下へ交差
Alert when RSI direction changes — RSI の方向が変わったときにアラート
All timeframes are Overbought/Oversold — すべての時間枠が買われすぎ/売られすぎ
All TFs exit OB/OS (previously all TFs were in this OB/OS) — すべての TF が OB/OS から終了 (以前はすべての TF がこの OB/OS にありました)
Pop up alert — ポップアップ アラート。
Push notifications — プッシュ通知。
E-mail notifications — 電子メール通知。
Sound alert — サウンド アラート。


hello I have RSI dashboard and Stochastic dashbord. I need something for alert system. I really like your dashboards. But I need something more useful. If you can add it I will be very happy.. Example: When the RSI is over 70 on the H1 and at the same time The RSI is under the 30 on the M1 , Can be an alert for it ? When the RSI is under 30 on the H1 and at the same time The RSI is over the 70 on the M1 , Can be an alert for it ? I mean that when a timeframe is over 70 and the other timeframe is under 30 , there will be an alert for it