Cycles Plotter

Cycles Plotter Indicatore di Cicli Personalizzabili con Medie Mobili e Data di Inizio

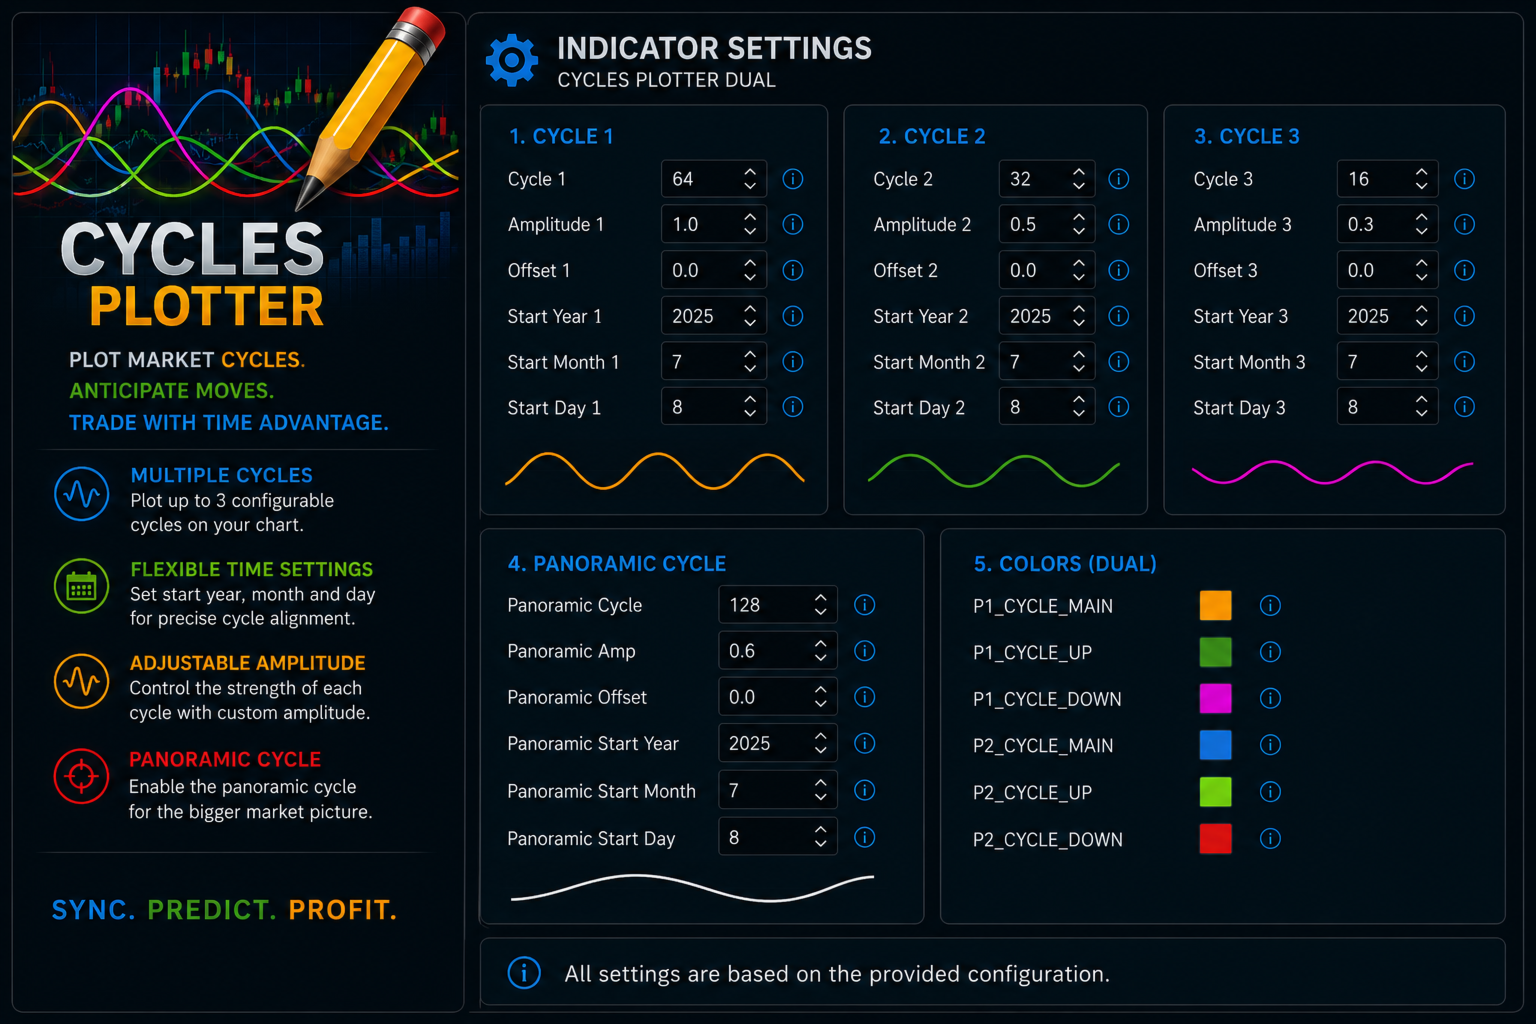
Il Cycles Plotter è un indicatore tecnico avanzato che traccia due cicli sinusoidali completamente personalizzabili, solo dietro input dell’utente. Non genera cicli automaticamente: tutti i cicli vengono calcolati esclusivamente in base ai parametri impostati dall’utente, offrendo ai trader uno strumento visivo per studiare le oscillazioni di prezzo e i potenziali cambi di tendenza, senza produrre segnali o previsioni automatiche.

Punti chiave:

Cicli definiti dall’utente: I cicli 1 P1 e 2 P2 sono totalmente configurabili dall’utente. È possibile impostare lunghezza del ciclo, ampiezza, medie mobili e data e ora di inizio esatta. Nessun ciclo viene tracciato se l’utente non inserisce i parametri.

Controllo dell’ampiezza: Ogni ciclo può avere un’ampiezza diversa, permettendo di regolare l’altezza delle oscillazioni rispetto alla media mobile di riferimento.

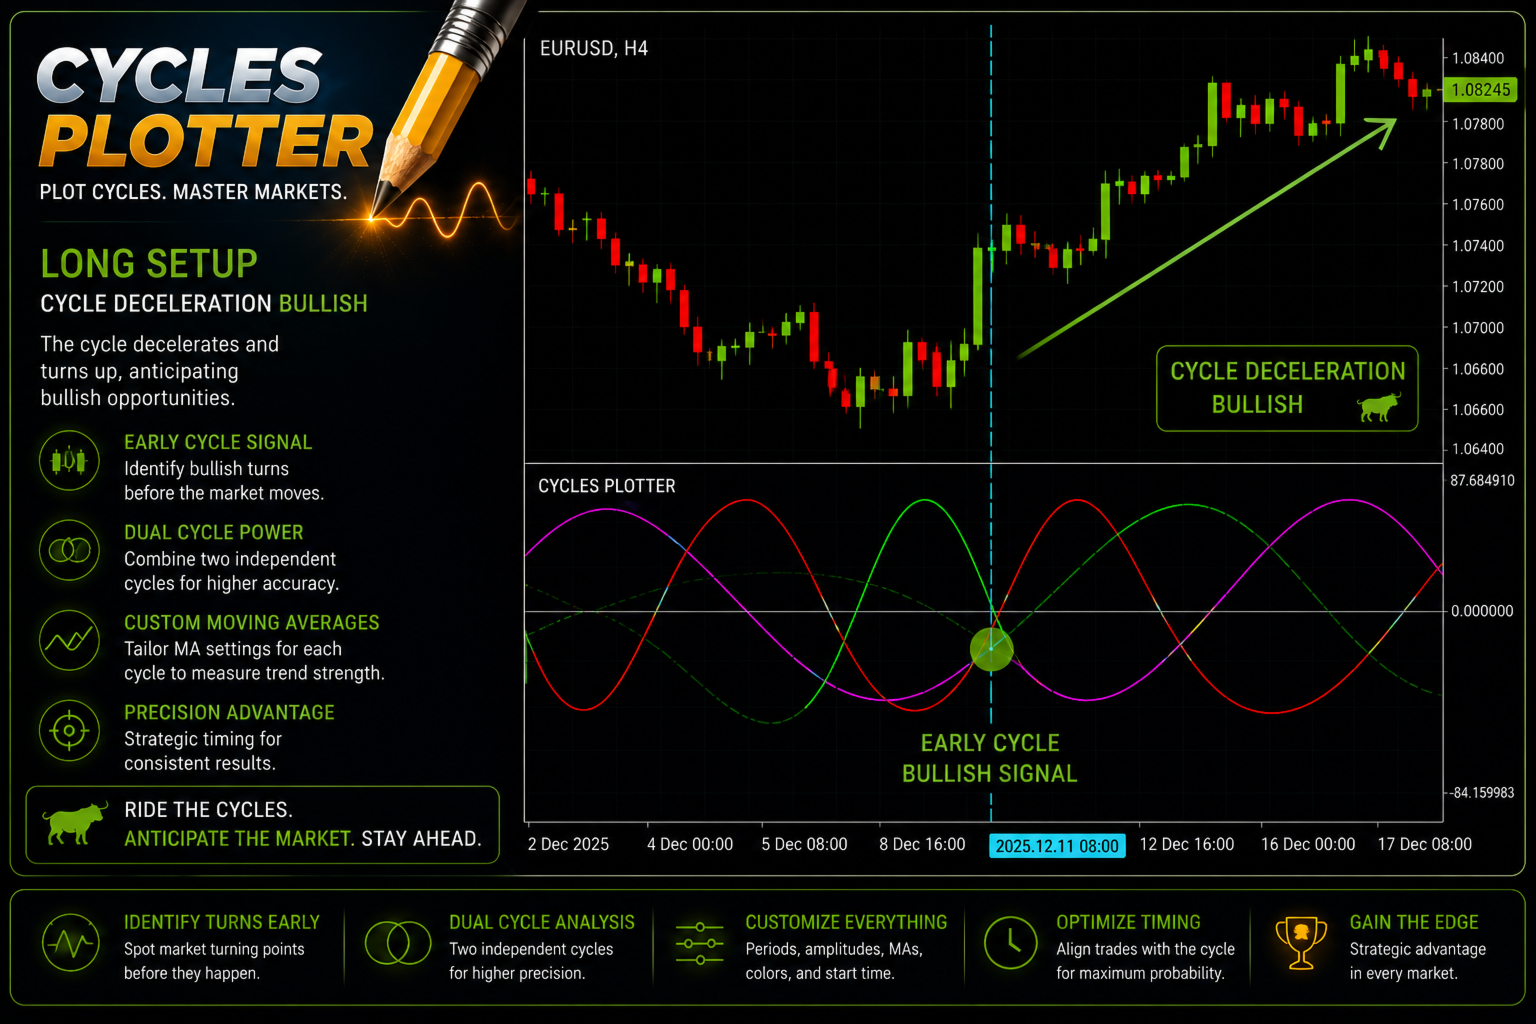
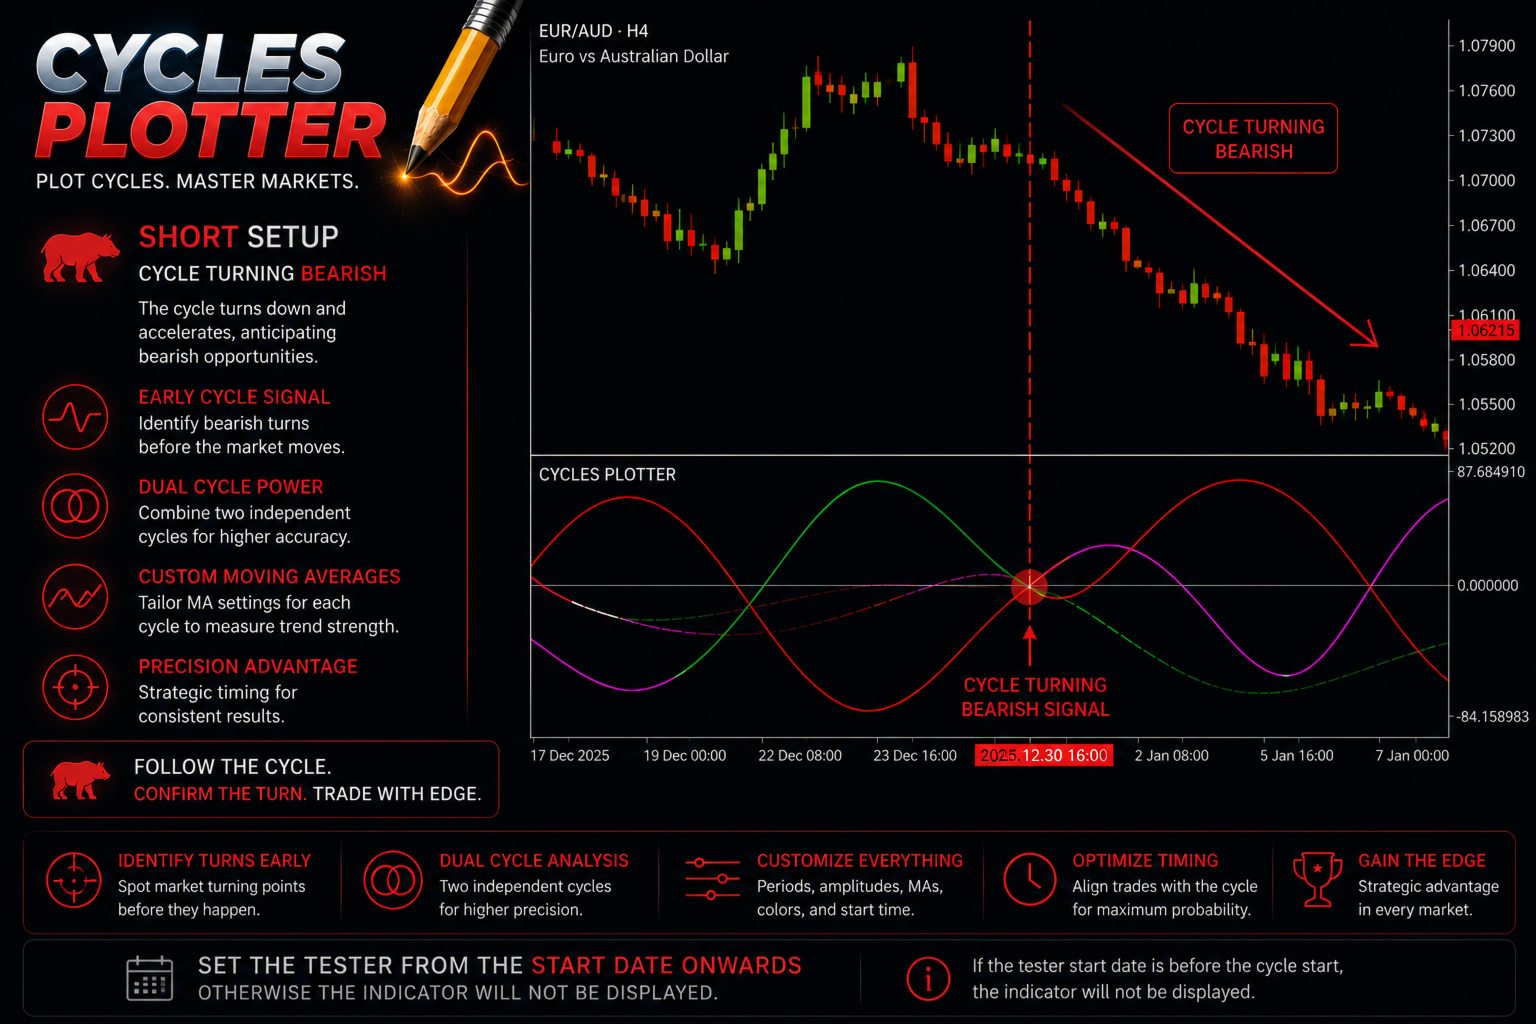
Rilevazione della tendenza: Le medie mobili veloci e lente indicano la direzione del ciclo:

Fast MA maggiore di Slow MA fase rialzista verde lime

Fast MA minore di Slow MA fase ribassista magenta rosso

Fast MA circa uguale a Slow MA fase laterale flat arancione blu

Tracciati dei cicli: Ogni ciclo ha tre linee separate:

Fase rialzista verde lime

Fase ribassista magenta rosso

Fase laterale flat arancione blu

Data e ora di inizio personalizzabile: È possibile definire il momento esatto in cui ogni ciclo inizia a essere tracciato, per un allineamento preciso con eventi di mercato o pattern storici.

A chi è rivolto?
Questo indicatore è consigliato particolarmente per coloro che:

stanno studiando i cicli di mercato o li hanno già studiati,

vogliono approfondire la propria conoscenza dei cicli applicati al trading,

utilizzano i cicli nei loro sistemi di trading o desiderano integrarli nei propri sistemi.

Il Cycles Plotter è quindi utile sia a trader esperti che vogliono analizzare i movimenti ciclici dei prezzi, sia a chi è in fase di apprendimento o ricerca. La tecnica dei cicli è uno strumento affidabile, consolidato da molti anni, e presente nei maggiori sistemi di analisi tecnica e trading professionale.

Importante: L’indicatore non genera segnali automatici né previsioni. Tutti i calcoli e i cicli sono basati esclusivamente sugli input forniti dall’utente.


Prodotti consigliati
CosmiCLab SMC FIBO CosmiCLab SMC FIBO is a professional trading indicator designed for traders who use Smart Money Concepts (SMC), market structure analysis and Fibonacci retracement levels. The indicator automatically detects market swings and builds Fibonacci levels based on the latest impulse movement. It also identifies market structure changes such as BOS (Break of Structure) and CHOCH (Change of Character), helping traders understand the current market direction. CosmiCLab SMC FIBO also pr
Zone Structure Scanner Panel for MT5 Find better setups faster — without scanning charts for hours. The Zone Structure Scanner Panel for MT5 helps you automatically scan multiple symbols, detect key weekly and daily support/resistance zones, read market structure, highlight confluence, and flag H4 rejection-confirmed setups from one powerful panel. Instead of jumping from chart to chart, you get ranked opportunities in one place so you can focus on the setups that matter most. Why it stands
Introducing "X Marks the Spot" – Your Ultimate MetaTrader 5 Indicator for Perfect Trades! Are you tired of the guesswork in trading? Ready to take your MetaTrader 5 experience to a whole new level? Look no further – "X Marks the Spot" is here to revolutionize your trading strategy! What is "X Marks the Spot"? "X Marks the Spot" is not just another indicator – it's your personal trading compass that works seamlessly on all timeframes . Whether you're a beginner or an experienced trader,
MercariaPattern1-2-3 відстежує рух ціни, знаходить трьоххвильові структури 1-2-3 та підсвічує момент, коли сценарій підтверджується пробоєм ключового рівня. MercariaPattern1-2-3 tracks price movement, detects three-leg 1-2-3 structures and highlights the moment when the scenario is confirmed by a key level breakout. Індикатор збирає локальні свінги в компактну фігуру 0–1–2–3 , чекає підтвердженого пробою та будує стрілку входу з готовими рівнями SL/TP. The indicator combines local swings into a
Phantom Edge SMC
Nattapon Chuekamhod
Phantom Edge SMC — The Ultimate Smart Money Indicator for MT5 Tired of manually drawing structures while trading SMC or ICT concepts? Let Phantom Edge SMC do the heavy lifting for you. Key Features Internal & Swing Structure: Automatically detects BOS and CHoCH across two structural levels. Order Blocks (OB): Identifies Internal and Swing OBs with automated mitigation tracking. Equal Highs / Lows: Highlights EQH / EQL to pinpoint Liquidity pools. Fair Value Gaps (FVG): Displays FVGs with
RAD CRITICAL LEVES RAD indicator tracks “Relevant Volume” in real time, identifying accumulation and distribution processes, projecting them in the chart as SUPPORT or RESISTANCE zones. Natural   support   and resistance levels are generated by Volume Accumulation and Distribution processes. As these processes evolve, levels at which the relevant volume in the market place is positioned, become difficult areas to cross upwards or downwards. By using this information, traders can identify very s
Was: $249  Now: $99   Market Profile defines a number of day types that can help the trader to determine market behaviour. A key feature is the Value Area, representing the range of price action where 70% of trading took place. Understanding the Value Area can give traders valuable insight into market direction and establish the higher odds trade. It is an excellent addition to any system you may be using. Inspired by Jim Dalton’s book “Mind Over Markets”, this indicator is designed to suit the
RBreaker
Zhong Long Wu
RBreaker Gold Indicators is a short-term intraday trading strategy for gold futures that combines trend following and intraday reversal approaches. It not only captures profits during trending markets but also enables timely profit-taking and counter-trend trading during market reversals. This strategy has been ranked among the top ten most profitable trading strategies by the American magazine   Futures Truth   for 15 consecutive years. It boasts a long lifecycle and remains widely used and st
Trade smarter, not harder: Empower your trading with Harmonacci Patterns This is arguably the most complete harmonic price formation auto-recognition indicator you can find for the MetaTrader Platform. It detects 19 different patterns, takes fibonacci projections as seriously as you do, displays the Potential Reversal Zone (PRZ) and finds suitable stop-loss and take-profit levels. [ Installation Guide | Update Guide | Troubleshooting | FAQ | All Products  ] It detects 19 different harmonic pric
Master Osi
Norapan Tonphim
OSS ULTIMATE ELITE 2026 – Institutional Smart Money System Stop chasing price. Start trading like smart money.  Why Traders Are Switching to OSS Elite Most indicators react after the move. OSS ULTIMATE ELITE is designed to help you position before the move happens. This is not just another signal tool — it’s a complete trading framework combining momentum, structure, and liquidity behavior.  What Makes This Different? Not lagging signals Not random arrows Not overfitted strategies  Built
Overview The Market Perspective Structure Indicator is a comprehensive MetaTrader indicator designed to provide traders with a detailed analysis of market structure across multiple timeframes. It identifies and visualizes key price action elements, including swing highs and lows, Break of Structure (BOS), Change of Character (CHOCH), internal structures, equal highs/lows, premium/discount levels, previous levels from higher timeframes, and trading session zones. With extensive customization opt
Chỉ báo này sẽ thông báo cho bạn nếu cấu hình xu hướng thành công. Tín hiệu theo xu hướng không nên được tăng theo, nhưng tín hiệu mua ở mức giá thấp theo mô hình giao dịch thông thường của bạn, hoặc tín hiệu bán ở mức giá tốt, là một lựa chọn rất tốt. Hãy thiết lập nó trên khung thời gian lớn hơn và theo dõi các khung thời gian nhỏ hơn, bám sát các xu hướng chính. Tôi thường thiết lập ba khung thời gian gần nhau nhất và không bao giờ đi ngược tín hiệu của INdicator này. INdicator   này không có
Multi-Time Period Charts: Professional Multi-Timeframe Visualization for MT5 The Multi-Time Period Charts (MTPC) indicator is a sophisticated market structure visualization tool for MetaTrader 5. It allows traders to overlay higher-timeframe price action directly onto their current lower-timeframe execution chart using precisely rendered, semi-transparent boxes. This eliminates the need for constant window switching while maintaining a clear, non-intrusive view of the broader market context. Cor
FREE
L'indicatore costruisce le quotazioni attuali, che possono essere confrontate con quelle storiche e su questa base fanno una previsione del movimento dei prezzi. L'indicatore ha un campo di testo per una rapida navigazione fino alla data desiderata. Opzioni: Simbolo - selezione del simbolo che visualizzerà l'indicatore; SymbolPeriod - selezione del periodo da cui l'indicatore prenderà i dati; IndicatorColor - colore dell'indicatore; HorisontalShift - spostamento delle virgolette disegnate d
HAS RSI Signal — Indicatore di Tendenza Professionale con Calcolo SL/TP HAS RSI Signal è un potente strumento di trading che combina classici intramontabili con moderni algoritmi di filtraggio del rumore. L'indicatore analizza il mercato attraverso le candele Heiken Ashi Smoothed (HAS) e l'oscillatore RSI , fornendo al trader segnali di ingresso chiari durante le inversioni di tendenza o l'uscita dalle zone di ipercomprato/ipervenduto. Vantaggi Principali: Doppio Filtraggio: L'uso di Heiken Ashi
AutoTrend Pro
Aram Hussein Mohammed
TL Method — Automatic Trendline Detection & Strength Indicator Tired of drawing trendlines manually? TL Method does it for you — automatically detecting, drawing, and scoring trendlines in real time. What it does: Scans up to 1000 bars to find valid support and resistance trendlines Scores each trendline by counting confirmed anchor touches Generates buy/sell signal arrows when price approaches strong trendlines Alerts you via popup, push notification, or sound — with smart cooldown to avoid spa
Multi-Timeframe PO3 Projection Multi-Timeframe PO3 Projection is a clean and practical MetaTrader 5 indicator designed to project multiple higher-timeframe candles directly on your active chart. Instead of switching between H1, H4, D1, and other higher timeframes, this indicator lets you view their live candle structure side by side. It helps traders track the current higher-timeframe open, high, low, close, and candle direction while staying on the chart timeframe they are actively trading. The
Il livello Premium è un indicatore unico con una precisione superiore all'80% delle previsioni corrette! Questo indicatore è stato testato dai migliori Specialisti di Trading per più di due mesi! L'indicatore dell'autore che non troverai da nessun'altra parte! Dagli screenshot puoi vedere di persona la precisione di questo strumento! 1 è ottimo per il trading di opzioni binarie con un tempo di scadenza di 1 candela. 2 funziona su tutte le coppie di valute, azioni, materie prime, criptovalu
L'indicateur SMC Venom Model BPR est un outil professionnel pour les traders travaillant dans le concept Smart Money (SMC). Il identifie automatiquement deux modèles clés sur le graphique des prix: FVG   (Fair Value Gap) est une combinaison de trois bougies, dans laquelle il y a un écart entre la première et la troisième bougie. Forme une zone entre les niveaux où il n'y a pas de support de volume, ce qui conduit souvent à une correction des prix. BPR   (Balanced Price Range) est une combinaiso
MetaTrader 4 version available here: https://www.mql5.com/en/market/product/25793 FFx Pivot SR Suite PRO is a complete suite for support and resistance levels. Support and Resistance are the most used levels in all kinds of trading. Can be used to find reversal trend, to set targets and stop, etc. The indicator is fully flexible directly from the chart 4 periods to choose for the calculation: 4Hours, Daily, Weekly and Monthly 4 formulas to choose for the calculation: Classic, Camarilla, Fibonac
Unlock powerful breakout opportunities The 123 Pattern is one of the most popular, powerful and flexible chart patterns. The pattern is made up of three price points: a bottom, a peak or valley, and a Fibonacci retracement between 38.2% and 71.8%. A pattern is considered valid when the price breaks beyond the last peak or valley, moment at which the indicator plots an arrow, rises an alert, and the trade can be placed. [ Installation Guide | Update Guide | Troubleshooting | FAQ | All Products  ]
Cumulative delta indicator As most traders believe, the price moves under the pressure of market buying or selling. When someone redeems an offer standing in the cup, the deal is a "buy". If someone pours into the bid standing in the cup - the deal goes with the direction of "sale". The delta is the difference between purchases and sales. A cumulative delta - the difference between the cumulative sum of purchases and sales for a certain period of time. It allows you to see who is currently contr
Price Magnet — Price Density and Attraction Levels Indicator Price Magnet is a professional analytical tool designed to identify key support and resistance levels based on statistical Price Density. The indicator analyzes a specified historical period and detects price levels where the market spent the most time. These zones act as “magnets,” attracting price action or forming a structural base for potential reversals. Unlike traditional Volume Profile tools, Price Magnet focuses on price-time d
FX-AIEA Smart Supply and Demand Zone Identification Indicator (Supply and Demand Indicators MT5) Version: 2.51 | Compatible Platform: MetaTrader 5  Why do trades need supply and demand zones? Supply and demand zones are the core manifestation of institutional order flow, reflecting real buying and selling power more accurately than traditional support and resistance. However, manual drawing is not only time-consuming but also highly subjective and prone to missing key areas. FX-AIEA Supp
The Super Arrow Indicator provides non-repainting buy and sell signals with exceptional accuracy. Key Features No repainting – confirmed signals remain fixed Clear visual arrows: green for buy, red for sell Real-time alerts via pop-up, sound, and optional email Clean chart view with no unnecessary clutter Works on all markets: Forex, gold, oil, indices, crypto Adjustable Parameters TimeFrame Default:   "current time frame" Function:   Sets the time frame for indicator calculation Options:   Can
Volume Profile Canvas - Professional Volume Profile Indicator for MetaTrader 5 DESCRIPTION Volume Profile Canvas is a professional volume profile indicator for MetaTrader 5 that renders directly on the chart using a high-performance Canvas engine. It calculates and displays the volume distribution across price levels, identifying the Point of Control (POC), Value Area High (VAH) and Value Area Low (VAL) in real time. This is a pure analysis tool. It does not trade. It gives you an instant vi
Footprint is an indicator for order flow and volume analysis. It helps identify market structure at the cluster level, find key zones with increased activity, and work with filters directly on the chart without constantly opening the settings window. Footprint Indicator Features cluster-based Bid x Ask and Delta charts; on-chart control panel; sliders for filter adjustments; Absorption; Initiative; Stacked Imbalances; Big Trades; dPOC / Dynamic Point of Control; Delta; side market profile; cumul
Looking for reliable levels on a price chart? Already tired of searching for similar indicators? Are the levels not working out as they should? Then this is the indicator for you. Volume Prices Universal is a reliable indicator of horizontal volumes. What does it show? First of all, the main idea of ​​the indicator is to display at which price mark the price has been for the longest time. Thus, the display of price volumes on the price chart is formed. With the help of which you can very simpl
CCI Fixed Dual
Edoardo Centorame
Cos è il CCI FIXED DUAL Il CCI FIXED DUAL è un Trend Direction Filter professionale, progettato per identificare con precisione: la direzione dominante del mercato la qualità strutturale del movimento la coerenza tra trend principale e fasi di accelerazione Non è un indicatore di ingresso diretto. Non è un oscillatore classico. È uno strumento di contesto, pensato per aiutare il trader a decidere quando operare e quando NON operare, riducendo drasticamente il rumore e gli errori di interpretazio
GorMaster Pro
Manuel Damian Ortiz Fernandez
GorMaster_Pro — Sesgo confiable, noticias y técnica en una sola pantalla Visión GorMaster_Pro es una herramienta indispensable para cualquier tipo de trader (scalper, intradía o swing) porque combina información fundamental y técnica para darte una lectura fiel y accionable del mercado. En una sola vista verás: sesgo direccional BUY/SELL/RANGO , ventanas de noticias en tiempo real que congelan la operativa, métricas técnicas clave (ATR_Z, RangeRatio, ADX, SpreadZ), sesiones y alertas . Todo org
Gli utenti di questo prodotto hanno anche acquistato
ARIPoint
Temirlan Kdyrkhan
ARIPoint is a powerful trading companion designed to generate high-probability entry signals with dynamic TP/SL/DP levels based on volatility. Built-in performance tracking shows win/loss stats, PP1/PP2 hits, and success rates all updated live. Key Features: Buy/Sell signals with adaptive volatility bands Real-time TP/SL/DP levels based on ATR Built-in MA Filter with optional ATR/StdDev volatility Performance stats panel (Success, Profit/Loss, PP1/PP2) Alerts via popup, sound, push, or email Cu
Rilevatore intelligente multistrato di breakout e pullback per MetaTrader 5 "Intelligente. Semplice. Veloce!" Sei stanco di perdere entrate su breakout ad alta probabilità? Passi ore a scansionare più grafici, cercando di allineare i breakout con la direzione del trend e il momentum delle valute — solo per perdere il movimento? Break Pullback risolve tutto questo con un solo indicatore. Cos'è Break Pullback? Break Pullback è un indicatore MetaTrader 5 di livello professionale, progettato speci
ARICoins
Temirlan Kdyrkhan
ARICoin is a powerful trading companion designed to generate high-probability entry signals with dynamic TP/SL/DP levels based on volatility. Built-in performance tracking shows win/loss stats, PP1/PP2 hits, and success rates all updated live. Key Features: Buy/Sell signals with adaptive volatility bands Real-time TP/SL/DP levels based on ATR Built-in MA Filter with optional ATR/StdDev volatility Performance stats panel (Success, Profit/Loss, PP1/PP2) Alerts via popup, sound, push, or email Cust
AriX
Temirlan Kdyrkhan
1 (4)
AriX Indicator for MT5 A powerful trend-following and signal-evaluation tool AriX is a custom MT5 indicator that combines Moving Averages and ATR-based risk/reward logic to generate clear buy/sell signals. It visualizes dynamic SL/TP levels, evaluates past trade outcomes, and displays win/loss statistics in a clean on-chart panel. Key features include: Buy/Sell signals based on MA crossovers ATR-based SL/TP1/TP2/TP3 levels with visual lines and labels Signal outcome tracking with real-time stat
Gold Xausd Hunter
Metin Erkamoglu
5 (1)
MATADOR GOLD — XAUUSD M5 ( TimeFrame M5 ) Scalp Signals for MT5 Strategy Tester Visualization Video https://youtu.be/_cWbbyg2RSs Not every move deserves a signal. MATADOR GOLD was built for traders who prefer selective, structured, high-quality decision support over noisy, hyperactive signal tools. Designed specifically for Gold (XAUUSD / GOLD) on M5 , MATADOR helps you read short-term momentum with more discipline by combining trend logic, market-condition filters, momentum timing, spread pro
+++++++++++++++++++++++++++++++++++++++++++++++++++++++++++++++++++++++++++++++++++++++++++++++++ +++ Link to EURUSD Only Free Version -->  https://www.mql5.com/en/market/product/156904?source=Unknown +++++++++++++++++++++++++++++++++++++++++++++++++++++++++++++++++++++++++++++++++++++++++++++++++ Hallo Trader, This is a traditional GANN & FIBONACCI strategy based on detection of an impulsive move in the opposite direction. This is called a Breakout. At the moment of Breakout, the indicator draw
Pantera Indicator
Temirlan Kdyrkhan
5 (1)
A tool for on-chart strategy backtesting and performance analysis. A utility for developing, debugging, and testing custom trading ideas and indicator functions. An indicator designed to quickly test trading concepts and visualize the effectiveness of different input parameters. An all-in-one sandbox for testing everything from simple crossovers to complex, multi-condition trading systems.
TrendMaestro5
Stefano Frisetti
Attenzione alle truffe, questo indicatore e' distribuito esclusivamente su MQL5.com nota: questo indicatore e' per METATRADER5, se vuoi la versione per  METATRADER4 questo e' il link:   https://www.mql5.com/it/market/product/108106 TRENDMAESTRO ver 2.5 TRENDMAESTRO   riconosce un nuovo TREND sul nascere, non sbaglia mai. La sicurezza di identificare un nuovo TREND non ha prezzo. DESCRIZIONE TRENDMAESTRO identifica un nuovo TREND sul nascere, questo indicatore prende in esame la volatilita' i
IVISTscalp5
Vadym Zhukovskyi
5 (6)
Итальянский [iVISTscalp5]: Un laboratorio per lo studio del comportamento del mercato attraverso il tempo TLV Framework | Liquidity Activation Points ⸻ Descrizione Generale iVISTscalp5 è un indicatore multilivello di timing e struttura dei prezzi sviluppato all’interno del progetto VISTmany. Il sistema prevede il tempo, la direzione e l’ampiezza del movimento attraverso i Liquidity Activation Points (timings). L’indicatore iVISTscalp5 può essere utilizzato con i parametri predefin
Aiuta a determinare se questo punto è adatto per acquistare. Aiuta a determinare se questo punto è adatto per vendere. Quando tutti e quattro gli indicatori raggiungono contemporaneamente il fondo, occorre concentrarsi sulle opportunità di rimbalzo. Quando tutti e quattro gli indicatori si trovano contemporaneamente nella parte alta, occorre concentrarsi sulle opportunità di ribasso. Questo sistema è costruito sulla base di avanzate tecnologie algoritmiche cinesi e di una struttura di modellazio
Beat The Market Maker MT5
Yahia Ismail Ibrahim El Mughrabi
BEAT THE MARKET MAKER Stop Entering After the Market Has Already Trapped You Most traders think they need a better entry. But the real problem is deeper. They enter when price looks strong… only to discover they were the liquidity. The market moves to collect weak positions before the real move begins. That is why you get caught in fake breakouts. That is why you enter late. That is why the chart looks clear only after the move is finished. You do not need more noise. You need to read the
ARIScalping
Temirlan Kdyrkhan
ARIScalp is a powerful trading companion designed to generate high-probability entry signals with dynamic TP/SL/DP levels based on volatility. Built-in performance tracking shows win/loss stats, PP1/PP2 hits, and success rates all updated live. Key Features: Buy/Sell signals with adaptive volatility bands Real-time TP/SL/DP levels based on ATR Built-in MA Filter with optional ATR/StdDev volatility Performance stats panel (Success, Profit/Loss, PP1/PP2) Alerts via popup, sound, push, or email Cus
ZIVA Signal Intelligence
Hassan Abdullah Hassan Al Balushi
ZIVA Signal Intelligence An Adaptive, Modular Market Intelligence System ZIVA Signal Intelligence is not positioned as a conventional trading indicator. It is a fully integrated, proprietary market intelligence system engineered to deliver structured, high-precision interpretation of price behavior within a controlled analytical environment. Developed through an independent architectural approach, ZIVA does not rely on, derive from, or replicate existing indicators. It represents a standalone
Big Player Range
Thalles Nascimento De Carvalho
5 (3)
BigPlayerRange – Il miglior indicatore per MT5 BigPlayerRange è considerato il miglior indicatore per Mini Indice e Mini Dollaro su MetaTrader 5. Questo strumento essenziale evidenzia le zone strategiche di azione dei grandi player, offrendo un’analisi tecnica istituzionale di altissima precisione. Come usare BigPlayerRange: Questo indicatore mostra zone di acquisto (linea verde) e di vendita (linea rossa). Quando il prezzo chiude fuori da queste aree, è probabile un movimento di tendenz
SunSignal ML — AI Gold Signals with Multi-Timeframe Confluence SunSignal ML is an advanced AI-powered signal indicator purpose-built for XAUUSD gold trading. It combines a proprietary adaptive trend algorithm with six machine learning models trained on confirmed price pivots to produce high-confidence entry signals with multi-timeframe validation. The indicator runs efficiently on M1, M5 and M15 timeframes and is designed for traders who want precision entries guided by data rather than guesswor
FX Analysis is an all-in-one MT5 indicator dashboard that combines eight analytical tools in a single panel, helping traders identify high-probability setups without switching between charts or indicators. Designed for standard forex pairs on MetaTrader 5. Best results on M15 - H4 timeframes when all components are used together as part of the included workflow. Components Volatility Analyzer Displays historical average movement by hour and by day of the week. A real-time Pip Balance shows the
Recommended TimeFrame >= H1. 100% Non Repainted at any moment.  Use it carefully, only with Trend Direction. Trading Usage: 2 Variants: as Range System or as BreakOut System (Both Only With Trend Direction)::: (Always use StopLoss for minimise Risk); [1] as Range System: (Recommended) in UP TREND:  - BUY in Blue Line , then if price goes down by 50 points (on H1) open Second BUY.   Close in any Profit you wish: TrailingStop(45 points) or Close when Price touches upper Gold Line. in DOWN TREND
This is an advanced indicator used with success rate.Unlock the secrets of trading Boom and Crash spikes with our powerful MT5 indicator! This spike detection tool provides accurate buy and sell signals, trade alerts, and High success rate entries. Perfect for scalping, day trading, and swing trading. Get the best Boom and Crash strategy with our Deriv Boom and Crash spike indicator. Indicator does not redraw or repaint. Recommendation · Use a Virtual Private Server (VPS) for 24/7 alerts on mob
VTrende Pro
Andrii Diachenko
5 (1)
VTrende Pro - MTF indicator for trend trading with a display panel for MT5 *** Videos can be translated into any language using subtitles (video language - Russian) Although the signals of the VTrende Pro indicator can be used as signals of a full-fledged trading system, it is recommended to use them in conjunction with the Bill Williams TS. VTrende Pro is an extended version of the VTrende indicator. Difference between Pro version and VTrende: - Time zones - Signal V - signal 1-2 waves -    S
**Triple Crox Strategy - Professional Trading System** **Overview** Triple Crox Strategy is an advanced technical indicator for MetaTrader 5 that combines multiple analysis methods to provide precise trading signals. Designed for serious traders, this indicator integrates multiple strategies based on moving averages, ATR, RSI, and cloud settings to identify market opportunities with high reliability. **Main Configuration** **Setup Types** *   **Setup Open/Close:** Based on Heikin Ash
Red and Green Light – Intelligent Trading Signal Indicator Product Overview Red and Green Light is a professional trading signal indicator based on the multi-stage T3 smoothing algorithm. It integrates a visual traffic light system, intelligent signal recognition, risk alerts, and multiple notification features. Whether you're a manual trader or an Expert Advisor (EA) developer, this indicator helps you capture market opportunities with greater precision and effectively avoid the risks of
The Expert Advisor and the video are attached in the Discussion tab . The robot applies only one order and strictly follows the signals to evaluate the indicator efficiency. Pan PrizMA CD Phase is an option based on the Pan PrizMA indicator. Details (in Russian). Averaging by a quadric-quartic polynomial increases the smoothness of lines, adds momentum and rhythm. Extrapolation by the sinusoid function near a constant allows adjusting the delay or lead of signals. The value of the phase - wave s
Классификатор силы тренда. Показания на истории не меняет. Изменяется классификация только незакрытого бара. По идее подобен полной системе ASCTrend, сигнальный модуль которой, точнее его аппроксимация в несколько "урезанном" виде, есть в свободном доступе, а также в терминале как сигнальный индикатор SilverTrend . Точной копией системы ASCTrend не является. Работает на всех инструментах и всех временных диапазонах. Индикатор использует несколько некоррелируемых между собой алгоритмов для класси
FFx Universal Strength Meter PRO is more than a basic strength meter. Instead of limiting the calculation to price, it can be based on any of the 19 integrated strength modes + 9 timeframes. With the FFx USM, you are able to define any period for any combination of timeframes. For example, you can set the dashboard for the last 10 candles for M15-H1-H4… Full flexibility! Very easy to interpret... It gives a great idea about which currency is weak and which is strong, so you can find the best pai
The FFx Universal MTF alerter shows on a single chart all the timeframes (M1 to Monthly) with their own status for the chosen indicator. 9 indicators mode (MACD-RSI-Stochastic-MA-ADX-Ichimoku-Candles-CCI-PSAR). Each can be applied multiple times on the same chart with different settings. Very easy to interpret. Confirm your BUY entries when most of the timeframes are showing green color. And confirm your SELL entries when most of the timeframes are showing red color. 2 Alert Options : input to s
The FFx Watcher PRO is a dashboard displaying on a single chart the current direction of up to 15 standard indicators and up to 21 timeframes. It has 2 different modes: Watcher mode: Multi Indicators User is able to select up to 15 indicators to be displayed User is able to select up to 21 timeframes to be displayed Watcher mode: Multi Pairs User is able to select any number of pairs/symbols User is able to select up to 21 timeframes to be displayed This mode uses one of the standard indicators
FFx Patterns Alerter gives trade suggestions with Entry, Target 1, Target 2 and StopLoss .... for any of the selected patterns (PinBar, Engulfing, InsideBar, OutsideBar) Below are the different options available: Multiple instances can be applied on the same chart to monitor different patterns Entry suggestion - pips to be added over the break for the entry 3 different options to calculate the SL - by pips, by ATR multiplier or at the pattern High/Low 3 different options to calculate the 2 TPs -
MetaTrader 4 version available here : https://www.mql5.com/en/market/product/24881 FFx Basket Scanner is a global tool scanning all pairs and all timeframes over up to five indicators among the 16 available. You will clearly see which currencies to avoid trading and which ones to focus on. Once a currency goes into an extreme zone (e.g. 20/80%), you can trade the whole basket with great confidence. Another way to use it is to look at two currencies (weak vs strong) to find the best single pairs
ClassicSBA
Umri Azkia Zulkarnaen
this indicator very simple and easy if you understand and agree with setup and rule basic teknical sba you can cek in link : please cek my youtube channel for detail chanel : an for detail info  contact me  basicly setup buy (long) for this indicator is Magenta- blue and green candle or magenta - green  and green candlestik and for setup sell (short) is Black - yellow - and red candle or black - red  and red candlestik
Pendiente de Precio
Cesar Juan Flores Navarro
Indicador en base a la pendiente de la linea de precio, dibuja una línea de color cuando sube a base de los precios que previamente has sido procesados o linealizados, y cuando baja la pendiente la linea linealizada toma otro color. En este caso se a considerado 6 lineas de diferentes procesos desde pendientes largas hacia las cortas, observándose que cuando coincidan las pendientes se produce un máximo o mínimo, lo que a simple vista nos permitirá hacer una COMPRA O VENTA.
Altri dall’autore
Trend Direction Filter: Possiamo definirlo come un indicatore professionale progettato per identificare la direzione dominante del mercato, aiutando il trader a comprendere il contesto generale e a operare in modo più consapevole. Non si tratta di un indicatore di ingresso, ma di un filtro direzionale avanzato, studiato per evidenziare la struttura del trend e ridurre l’influenza del rumore di mercato. Come funziona L’indicatore analizza il comportamento del prezzo attraverso una struttura di sm
FREE
LongTerm
Edoardo Centorame
LongTerm è un indicatore di analisi direzionale progettato per interpretare la forza e la qualità del trend di medio lungo periodo, con un focus specifico sull’analisi long oriented. Non è un indicatore di ingresso né di timing operativo, ma uno strumento pensato per aiutare il trader a comprendere quando il mercato offre condizioni favorevoli o sfavorevoli per il trend long, riducendo il rumore tipico delle oscillazioni di breve periodo. Obiettivi LongTerm nasce per: identificare trend long for
FREE
Multi-Timeframe Alignment PRO è un indicatore avanzato progettato per analizzare l’allineamento del mercato su più timeframe contemporaneamente e trasformare queste informazioni in percentuali chiare, visive e facili da interpretare  L’obiettivo dell’indicatore è semplice: aiutarti a capire quando più timeframe stanno andando nella stessa direzione, aumentando la qualità delle decisioni operative Questa versione PRO non è una semplice estensione grafica della versione base, ma introduce più prof
Trend Sniper Follow Chiarezza, struttura e controllo del trend Trend Sniper è un indicatore di analisi della tendenza progettato per offrire una lettura chiara, ordinata e non rumorosa del trend di medio lungo periodo. Punti di forza principali Lettura del trend pulita e immediata Struttura gerarchica semplice ma potente Nessun sovraccarico visivo sul grafico Ideale per Daily, Weekly e Monthly Perfetto per swing trading e trend following Aiuta a rimanere allineati al contesto di mercato, evitand
Zeta Trend
Edoardo Centorame
Zeta Trend Indicatore di Linee di Tendenza con Timing Dinamico Zeta Trend è un indicatore tecnico avanzato che traccia automaticamente linee di tendenza veloci e lente, combinandole con segnali di timing derivanti da ulteriori indicatori di supporto. Non produce segnali di acquisto o vendita automatici: tutte le linee e gli indicatori vengono calcolati per offrire ai trader uno strumento visivo che facilita l’interpretazione della direzione del mercato e i potenziali cambi di tendenza. Punti ch
Directional Force Histogram DFH è un indicatore a istogramma progettato per specchiare lo stato del mercato e aiutare il trader a interpretare in modo immediato pressione direzionale, forza del movimento e fasi di rallentamento o transizione. DFH non fornisce segnali automatici di acquisto o vendita. Il suo obiettivo è offrire contesto operativo, migliorando la qualità delle decisioni e la gestione della posizione. Cosa misura DFH Pressione rialzista e ribassista Intensità del movimento Rallenta
Market Pulse Colored Dual Indicatore di Impulso di Mercato a Doppio Orizzonte Colori Dinamici Market Pulse Dual è un indicatore tecnico avanzato progettato per misurare e visualizzare l impulso del mercato attraverso una combinazione ponderata di RSI, CCI e una modulazione di energia volatilità basata su ATR. L indicatore non genera ordini e non esegue trading automatico: è uno strumento visivo che sintetizza in modo chiaro la direzione e la qualità del momentum, evidenziando con colori specifi
CCI Fixed Dual
Edoardo Centorame
Cos è il CCI FIXED DUAL Il CCI FIXED DUAL è un Trend Direction Filter professionale, progettato per identificare con precisione: la direzione dominante del mercato la qualità strutturale del movimento la coerenza tra trend principale e fasi di accelerazione Non è un indicatore di ingresso diretto. Non è un oscillatore classico. È uno strumento di contesto, pensato per aiutare il trader a decidere quando operare e quando NON operare, riducendo drasticamente il rumore e gli errori di interpretazio
Cos è TREND VISION PRO TREND VISION PRO è un Trend Direction Filter multi timeframe adattivo di livello avanzato, progettato per fornire una lettura strutturata, gerarchica e contestuale della direzione del mercato su quasi tutti i timeframe operativi, in modo automatico e coerente. TREND VISION PRO rappresenta l evoluzione diretta di TREND VISION DAILY. Mentre la versione DAILY era volutamente limitata al grafico D1 per offrire una lettura semplice e focalizzata, la versione PRO estende la ste
Ma Extremes
Edoardo Centorame
MA Extremes   è un indicatore professionale per MetaTrader pensato per chi desidera leggere il mercato in modo più chiaro, veloce e ordinato. Il suo obiettivo è trasformare il grafico in una mappa operativa completa, dove supporti, resistenze, aree chiave, medie e conferme visive lavorano insieme per aiutare il trader a interpretare meglio il comportamento del prezzo e a individuare con maggiore consapevolezza le zone più interessanti del mercato. Il cuore di   MA Extremes   è un sistema di anal
Atr Grid EA
Edoardo Centorame
ATR GRID EA Ciao trader, ti presento   ATR GRID EA , un Expert Advisor progettato per operare con disciplina, precisione e logica strutturata in condizioni di mercato ben definite. La forza di questo sistema è racchiusa in un elemento centrale:   l’ATR . ATR GRID EA   è stato sviluppato attorno alla lettura della volatilità del mercato attraverso l’ATR, che rappresenta il cuore della sua logica operativa. Il sistema ricerca opportunità in presenza di   forte tendenza , selezionando con attenzion
Filtro:
Nessuna recensione
Rispondi alla recensione