AutoChannels

  • "Manual channel drawing? Not anymore. Let the market structure reveal itself automatically."

  • "Track long-term price zones 24/7, in real-time."

❓ Real Trader Pain Points

  • Identifying pivot points manually takes huge time and effort

  • Difficult to adapt to high volatility and pinpoint reliable channels

💡 Copy Ideas

  • "Markets never sleep. Why should your analysis stop?"

  • "Dozens of assets a day—how do you keep up?"

🔥 Core Claim

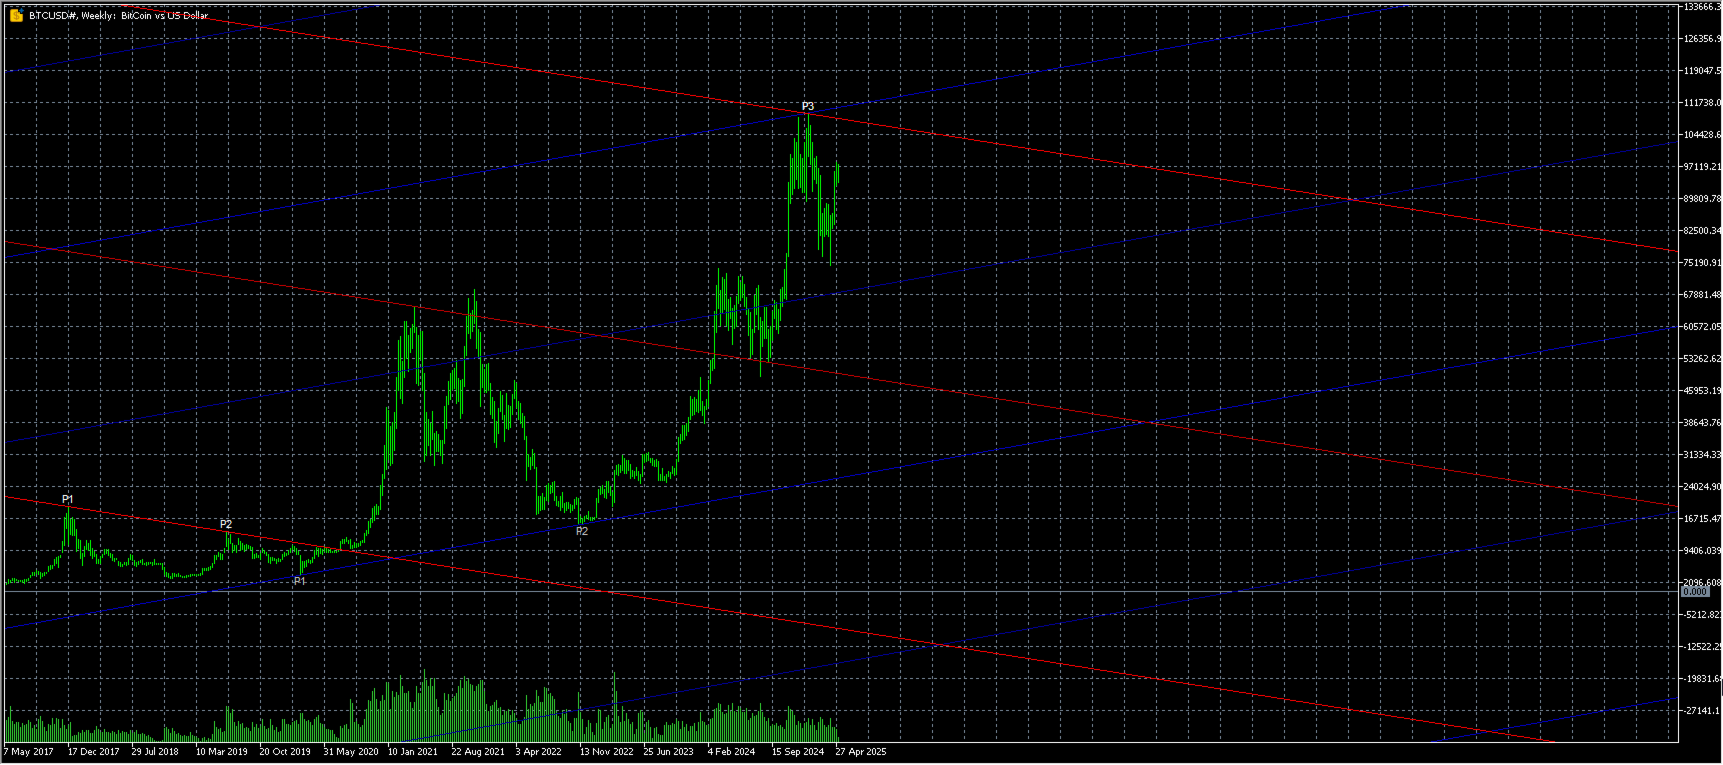
  • AutoChannels automatically reads market structure, reducing manual work.

  • "Analyze with machine precision and human intuition."

📊 Tech Breakdown

Key Feature Description
Auto Pivot Detection ZigZag-based real-time analysis
Multi-timeframe Analysis Leverages higher timeframes for stronger signals
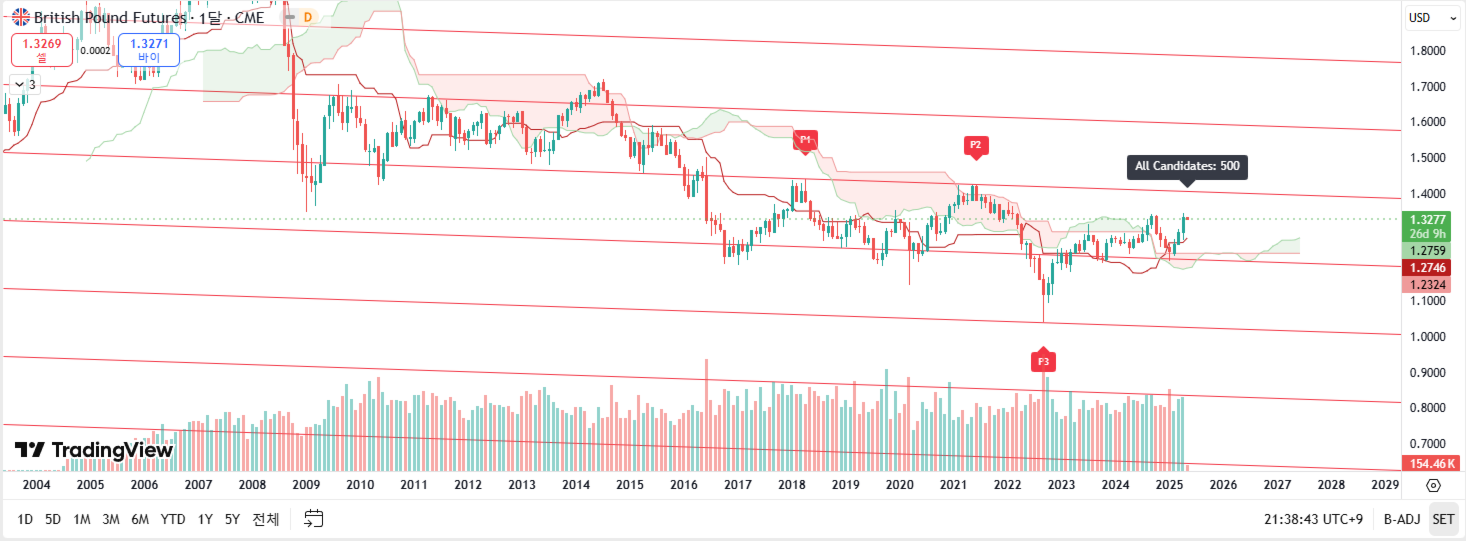
Channel Scoring System Evaluates volume, angle, length, importance, etc.
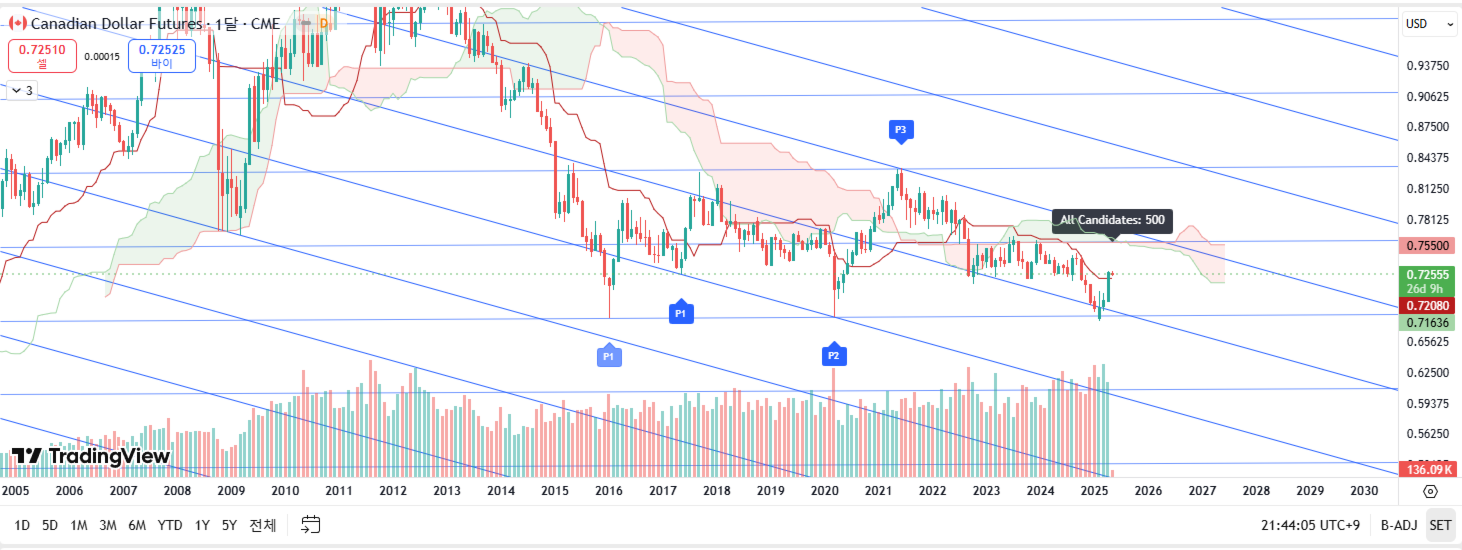
Similarity Filtering Removes redundant channels for clean UI
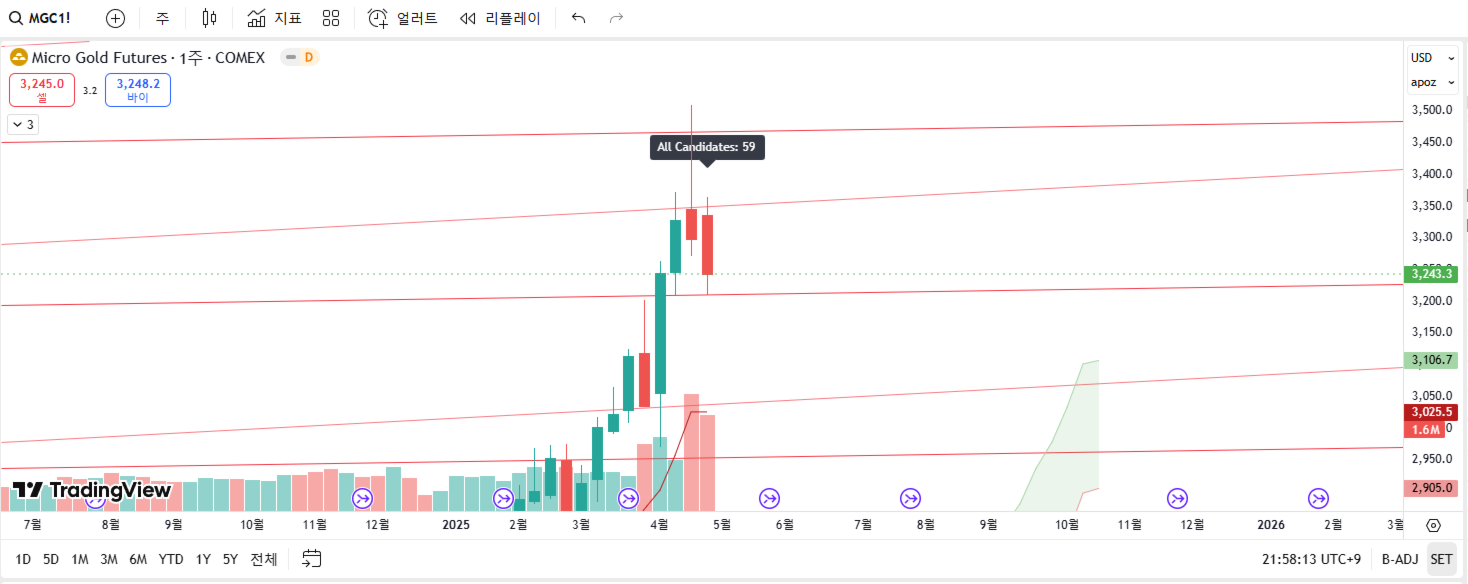
Dynamic ZigZag Sensitivity Adapts to market range & timeframe

💡 Visual Highlights

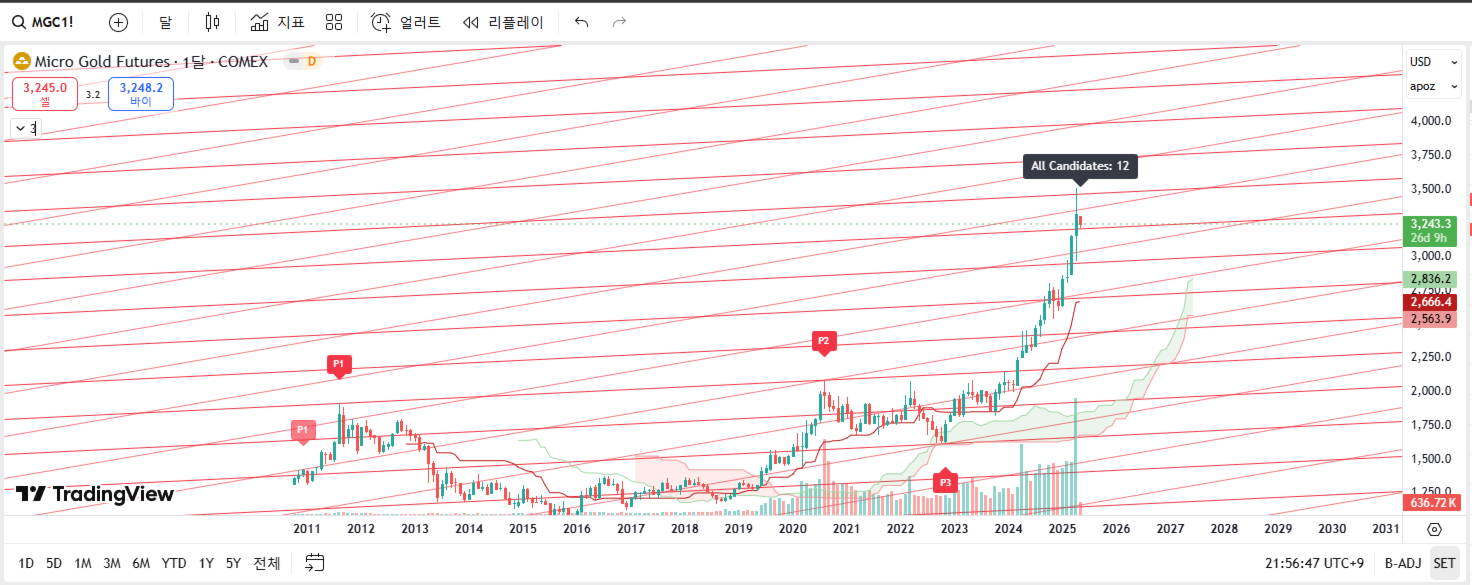
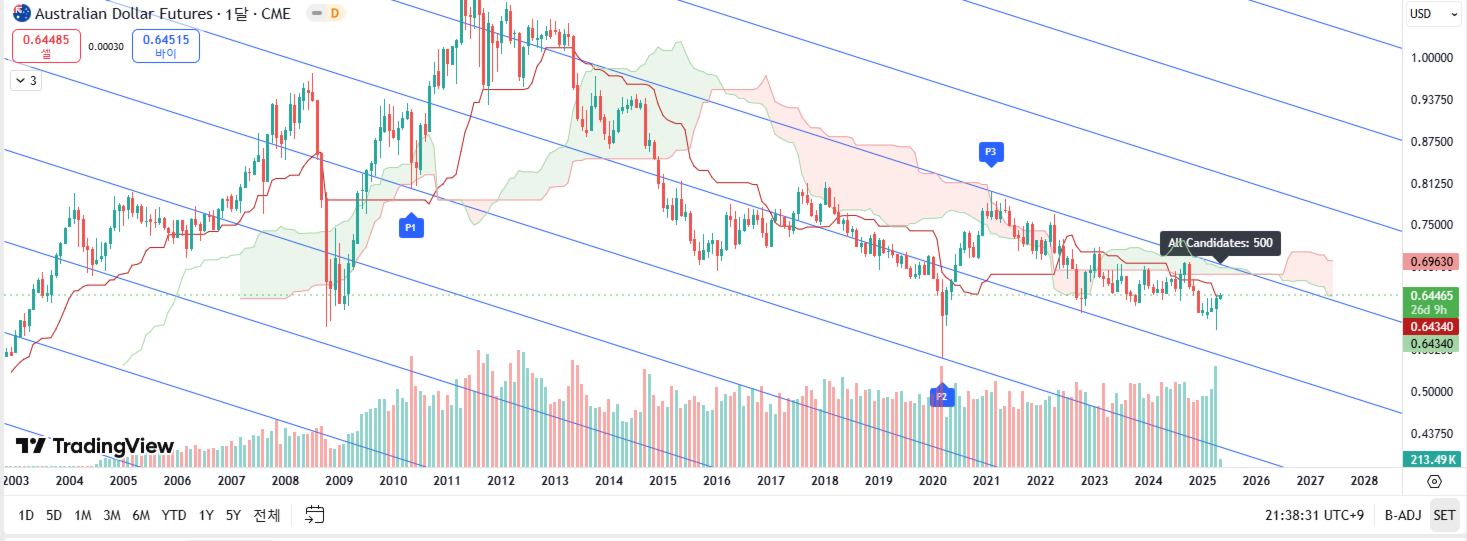
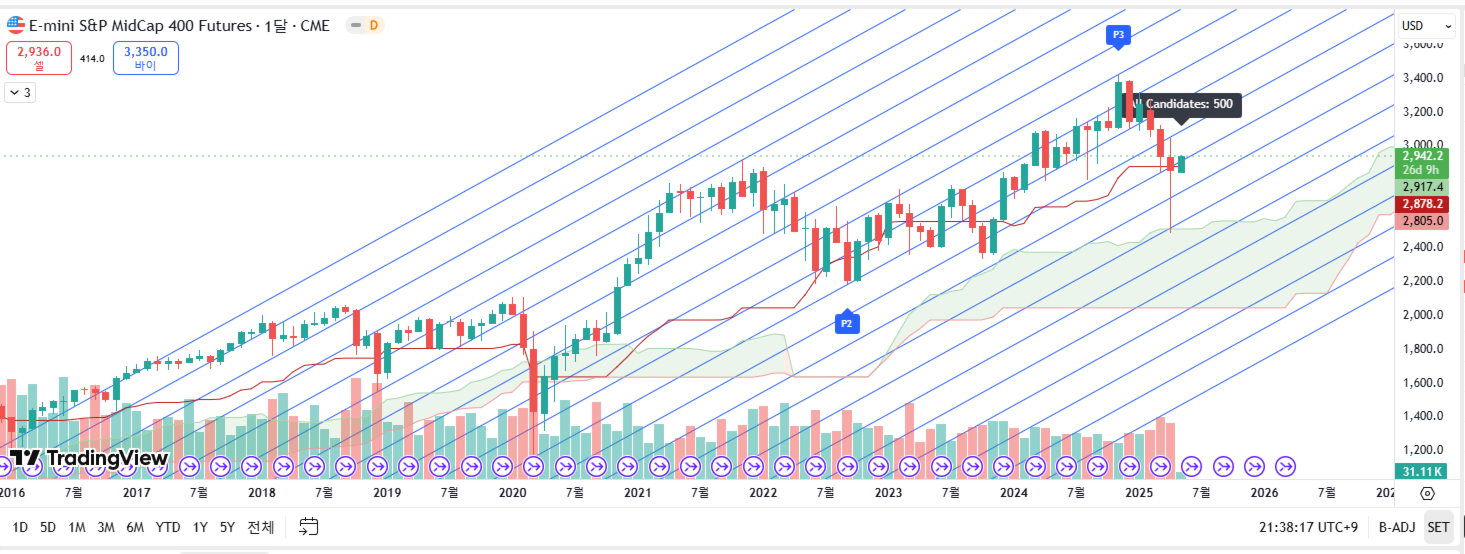
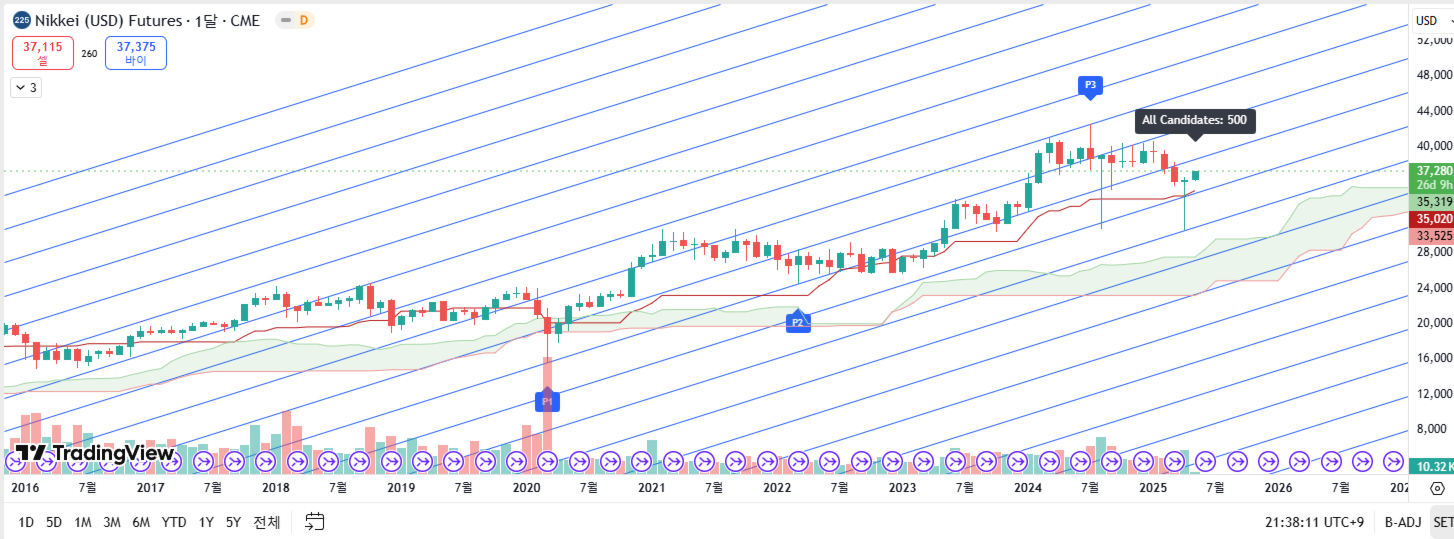
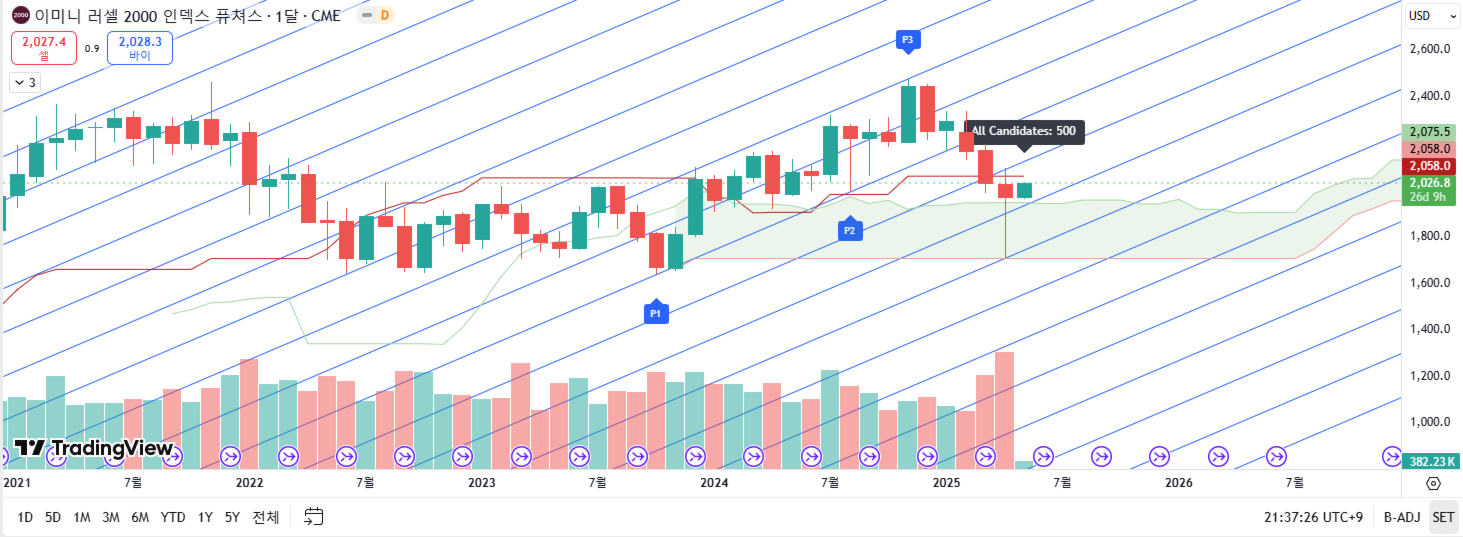
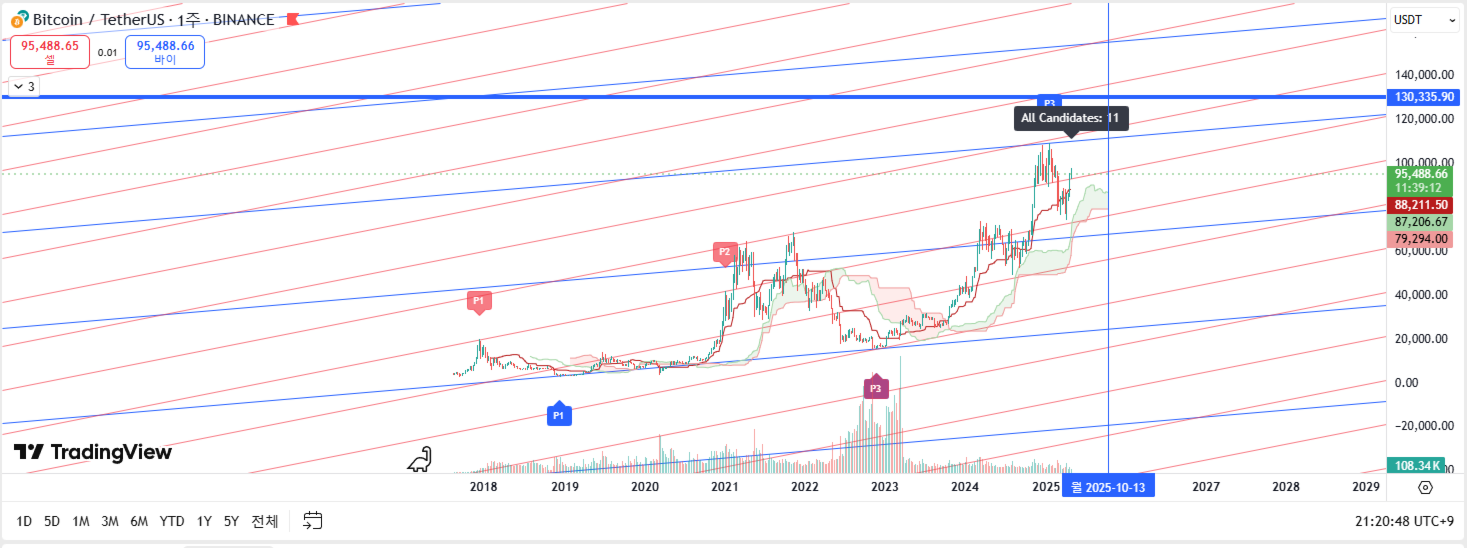
  • Channel transparency graded by importance

  • Theme auto-detect for dark/light backgrounds

  • Labeled P1/P2/P3 pivot points for learning structure

🚀 Expected Benefits

  • Analyze multiple assets automatically per day

  • Displays only high-confidence channels, reducing noise

  • Understand market structure 24/7 with minimal effort

💡 "Hands off. Mind on. AutoChannels draws it for you."

💡 

"Manual pivot drawing every day? Time to automate."


📜 Foundation & Evidence

  • ✅ Based on proven methods of trader, $3M profit in derivatives(2024)

  • ✅ Verified usage reviews (visualized via MQL5 star ratings)

  • ✅ Screenshots of auto-detection scenarios (2-3 examples)

❓ Partial FAQ Preview

Question Answer
Does it work with few bars? More bars = higher accuracy
Can I fully trust auto channels? Best channels highlighted; manual confirmation still advised
Is it reliable in volatile markets? Dynamic ZigZag adapts to shifting conditions

🌟 "Make your chart smarter. Start AutoChannels today."

🌟 "[Visit on MQL5] — your edge starts now."

💥 Promo

  • "Limited-time: Get 30% OFF ! (Discounted price applied)"

  • "Buy before next update → Get Multi-Timeframe module free!"

❗ Objection Handling
Objection Counter Message
Not sure auto indicators are reliable → Scoring + P1-P3 labels + built based on a $3M trader
Looks too complex → Video guide, customization UI included
Unsure if it fits my chart → Compatible brokers using MT5 platform
✅ Final Recap CTA

Channel drawing isn't about time—it's about strategy.
Try AutoChannels today.
Accuracy, visualization, automation—fully built in.


Prodotti consigliati
Smart Money Structure & Precision Trading Indicator (MT5) Smart Money Structure & Precision Trading Indicator  is a powerful Smart Money Concepts (SMC) indicator for MetaTrader 5, designed to help traders identify high-probability entries with institutional logic . This indicator automatically detects market structure in real time , highlights key liquidity levels , and provides clear, non-repainting signals so you can trade with confidence and precision. Whether you are a scalper, day trader, o
Signal Eskiya, in addition to channel lines, reflects entry signals in the form of arrows. Trading strategies using the channel indicator belong to the classic methods of technical analysis, are easy to execute, and therefore available even to beginners. Price ranges work equally well on any trading assets and timeframes, they can be used both independently and with additional confirmation from oscillators and market volumes. American traders say: “Trend is your friend”, which means “Trend is
Simple indicator to calculate fibonacci retracement levels on time. Add to chart and move trend line to set the fibonacci retracement levels. Inputs Levels  - levels for which to calculate values, separated by space, default are fibonacci levels Show time  - if true, time will be shown on levels Show date  - if true, date will be shown on levels Show fibonacci level  - if true, value of levels will be shown Fibonacci lines color  - color of levels Trend line color  - color of trend line which de
FREE
mql4 version:  https://www.mql5.com/en/market/product/44606   Simple indicator to calculate profit on fibonacci retracement levels with fixed lot size, or calculate lot size on fibonacci levels with fixed profit. Add to chart and move trend line to set the fibonacci retracement levels. Works similar as default fibonacci retracement line study in Metatrader. Inputs Fixed  - select what value will be fix, lot or profit Fixed value  - value that will be fix on all levels Levels  - levels for which
Liquidity Map
Alex Amuyunzu Raymond
Liquidity Map  Overview The Liquidity Map indicator is an advanced visualization tool based on ICT Smart Money Concepts . It automatically identifies daily Buy Zones , Sell Zones , and Liquidity Levels , showing where price is likely to reverse or continue based on institutional order flow. It calculates key levels from the daily session — such as the previous day’s high, low, and midpoint — then derives a premium (sell bias) and discount (buy bias) structure. When price trades into these mapped
Moving pivot Average Fibonacci The  indicator compares the selected period with its counterpart from the previous period. The indicator determines the moving Fibonacci levels for the day or any time interval to assess the price movement range from the time average. The indicator helps predict the expected high or low for the day based on historical time data. The pivot line can be considered an average trend line and use it in a variety of trading strategies. If you have any question about the
Autorithm AI
Zaha Feiz
4.21 (14)
Autorithm AI Descrizione Tecnica AUTORITHM è un sistema di trading avanzato basato sull’intelligenza artificiale, progettato per MetaTrader 5, che implementa 10 livelli specializzati di IA per un’analisi completa del mercato. L’Expert Advisor utilizza algoritmi sofisticati di IA che lavorano in sinergia per elaborare i dati di mercato, identificare opportunità di trading ed eseguire operazioni con protocolli intelligenti di gestione del rischio. [guide line]     [SET FILES] Caratteristiche Prin
Wave Synchronizer: indicatore visivo dell'analisi delle onde. Combina sequenze di movimenti di candele e produce modelli di onde direzionali, producendo movimenti sincroni con il mercato. L'inizio di ogni ondata è segnalato da una freccia e sono presenti anche delle notifiche. L'indicatore non ridisegna né sposta mai le frecce nella cronologia passata. Le frecce segnaletiche compaiono alla chiusura della candela. Si adatta a qualsiasi strumento di trading e intervallo di tempo. Facile da usare
The indicator ‘Probability Range Bands’ gives a prediction of the amount, how much the asset is moving from its current price. The range bands give probabilities, that the candle close will not exceed this certain price level. It is also called the expected move for the current candle close.   This Indicator is based on statistical methods, probabilities and volatility. Asset price is assumed to follow a log-normal distribution. Therefore, log returns are used in this indicator to determine the
Cypher invest
Arnold Byarufu
Introducing "CypherInvest," your trusted Expert Advisor in the dynamic world of financial markets.  With cutting-edge technology and advanced algorithms, CypherInvest analyzes market data, identifies patterns, and uncovers hidden opportunities to help you make informed investment decisions. Our innovative approach combines the power of cryptography and data analysis, unlocking the secrets of the market to maximize your returns. Powered by the Secret algorithm, CypherInvest leverages support an
Considering the main theories of Forex (Dow Theory, support lines, chart patterns, and Fibonacci retracements), It tells you the price range where whales (large investors) are likely to appear. You can trade at the price points that professionals also aim for. You no longer have to warry about where to aim next. We are live-streaming the actual operation of the system. Please check for yourself if it is usable. Please check it out for yourself. https://www.youtube.com/@ganesha_forex We do not
SMA Fibonacci EA
Christoph Kreher
Simple EA with 1 SMA and Fibonacci. The Expertadvisor opens positions in the direction of the trend when price levels have exceeded or fallen below the Fibonacci levels. It depends on the market in question and which parameters to use. The EA is programmed in such a way that optimization runs consume little time. A news filter and filter by day of the week are built in.
Introduction to Fractal Moving Average Fractal Moving Average indicator was designed as part of Fractal Pattern Scanner. Inside Fractal Pattern Scanner, Fractal Moving Average Indicator was implemented as multiple of chart objects. With over thousands of chart object, we find that it was not the best and efficient ways to operate the indicator. It was computationally too heavy for the indicator. Hence, we decide to implement the indicator version of Fractal Moving Average indicator to benefit ou
FREE
CSI Pro - Confluence Signal Intelligence A professional-grade trading signal system for MetaTrader 5 that analyzes market conditions across multiple dimensions to identify high-probability trade setups. CSI Pro cuts through market noise by requiring agreement among diverse analytical methods before generating a signal. Works Best With Our Complete Suite CSI Pro is designed to work alongside our companion indicators CSI Pro CEI (Cycle Exhaustion Index) and CSI Pro PRG (Probability Reversal Gauge
If you like this product, please give it a  5 star rating as a token of appreciation. This indicator calculates and draws pivot points and support/resistance levels for both daily and weekly timeframes: Pivot (central) level Support levels S1, S2, S3 Resistance levels R1, R2, R3 It allows showing daily, weekly, or both sets of pivots , giving traders visual references for potential support/resistance areas. Pivot mode: Choose which pivots to display (weekly, daily, or both). Colors and style: C
FREE
FIBO Trend PRO mt5
Evgenii Aksenov
4.5 (2)
The indicator allows you to instantly determine the current trend by color and FIBO levels. Higher Timeframe the panel shows the current trend of higher periods, helping to determine the strength of the trend. Trade according to the trend when changing the color of candles or trade against the trend when the price hit the extreme levels of the FIBO Trend PRO  indicator   Advantages of the FIBO Trend PRO Indicator never repaint and does not change their values Very easy to use and intuitive Appl
The ABC Indicator analyzes the market through waves, impulses, and trends, helping identify key reversal and trend-change points. It automatically detects waves A, B, and C, along with stop-loss and take-profit levels. A reliable tool to enhance the accuracy and efficiency of your trading. This product is also available for MetaTrader 4 =>  https://www.mql5.com/en/market/product/128179 Key Features of the Indicator: 1. Wave and Trend Identification:    - Automatic detection of waves based on mov
XAU Gold Trend Expert
Mabrook Mahdy Al Darby Mohammed
The EA uses a sophisticated "Triple-Filter" logic to identify high-probability entries: Trend Alignment: Uses a Dual EMA (50/200) Crossover system to identify the dominant market direction. It only trades in the direction of the long-term trend. Momentum Filter: Incorporates the Relative Strength Index (RSI) to ensure the price has enough velocity to reach its target, avoiding "flat" or sideways markets. Bar Execution: Operates strictly on New Bar Openings, which filters out market noise and sp
SMC Workflow Auto EA
Choawana Malaikitsanachalee
English – Product Description (V1.42) SMC Workflow Auto EA — SR / OB / FVG with BOS–CHOCH Confirmation Smart-Money-Concepts Expert Advisor that trades only when a clean SMC setup appears: Order-Block retest after Break of Structure (BOS / CHOCH) confirmation, with optional SR and Fair Value Gap (FVG) confluence. The EA uses pending limit orders, fixed SL/TP or RR-based exits, step-lock trailing and strict risk-controls designed to pass broker validation. What it does Detects swing structure usi
FREE
Ric
Sabina Fik
With this indicator, you can   predict future price behavior   for a certain number of bars ahead, giving you the ability to anticipate market dynamics. The indicator draws a   forecast line , which models potential future price values based on sophisticated algorithms analyzing past data. This information can be leveraged not only for market entry and exit decisions but also for setting or adjusting stop-loss levels to better manage your positions. Application of the Forecast The data provided
Dynamic SR Levels Pro
Vinutthapon Bumroong
Title: Dynamic SR Levels Pro Short Description: A next-generation, multi-timeframe Support & Resistance indicator that automatically detects, adapts, and invalidates key price zones based on real-time market volatility. Stop guessing, start seeing. Full Description: Tired of manually drawing support and resistance lines that quickly become outdated? Dynamic SR Levels Pro is the ultimate solution for traders who demand precision, adaptability, and a clean, clutter-free chart. This is not just ano
This indicator draws regular bullish and bearish divergences in real-time onto the charts. The algorithm to detect those divergences is based on my 10+ years experience of detecting divergences visually. The divergences are drawn as green and red rectangles on the charts. You can even do forward testing in the visual mode of the strategy tester. Parameters Fast EMA Period: The period of the fast EMA of the MACD. Default value is 12. Slow EMA Period: The period of the slow EMA of the MACD. Defau
Smart Pivot Points per MetaTrader 5: Livelli chiari per un trading intelligente Smart Pivot Points è un indicatore professionale per MetaTrader 5 che calcola e visualizza automaticamente un set completo di livelli di trading chiave sul grafico. Trasforma il caos dell'andamento dei prezzi in una mappa chiara e strutturata, evidenziando supporto, resistenza, equilibrio dei prezzi e potenziali zone target. Progettato per i trader che apprezzano la chiarezza, lo strumento funziona su qualsiasi merc
Automated Supply and Demand Tracker MT5. The following videos demonstrate how we use the system for trade setups and analysis.US PPI, Fed Interest Rates, and FOMC Trade Setup Time Lapse: U.S. dollar(DXY) and Australian dollar vs U.S. dollar(AUD/USD)  https://youtu.be/XVJqdEWfv6s  The EUR/USD Trade Setup time lapse 8/6/23.  https://youtu.be/UDrBAbOqkMY . US 500 Cash Trade Setup time lapse 8/6/23  https://youtu.be/jpQ6h9qjVcU .  https://youtu.be/JJanqcNzLGM ,  https://youtu.be/MnuStQGjMyg,&nbsp ;
Description ABC Trend Levels Pro  is an indicator that identifies market trends and important trend support and resistance levels. Recommendations You can use this indicator to determine the trend and, accordingly, to determine the direction of opening a position or closing an opposite position. Parameters ===== _INDICATOR_SETTINGS_ =====  - indicator settings Maximum History Bars  - maximum number of history bars for calculating the indicator. Average True Range Period  - ATR indicator pe
Atbot
Zaha Feiz
4.62 (55)
AtBot:  Come funziona e come usarlo ### Come funziona L'indicatore "AtBot" per la piattaforma MT5 genera segnali di acquisto e vendita utilizzando una combinazione di strumenti di analisi tecnica. Integra la Media Mobile Semplice (SMA), la Media Mobile Esponenziale (EMA) e l'indice di Gamma Vero Medio (ATR) per identificare opportunità di trading. Inoltre, può utilizzare le candele Heikin Ashi per migliorare la precisione dei segnali. Lascia una recensione dopo l'acquisto e ricevi un regalo bon
EA123 Sniper MACD MT5
Jose Francisco Flores Rojas
MACD Divergence Pro is an intelligent and adaptive Forex trading robot designed to capitalize on MACD signals and detect divergence patterns that often precede major price reversals. The EA automatically places   Buy and Sell trades   when:   Bearish divergence   is detected at market highs   Bullish divergence   is detected at market lows MACD crossover signals confirm potential entry points Key Features: Fully automated trading using MACD and divergence logic ️ Customizable MACD se
AI Pro Trader EA
Lucas Salinas Lozano
Introducing AI Pro Trader EA – The Ultimate Trading Companion Meet AI Pro Trader EA , an expertly crafted trading tool designed to automate your strategies with surgical precision. Built by blending advanced technical analysis with machine-like efficiency, this EA is not just another robot—it’s your personal trading assistant, engineered to deliver results. Why AI Pro Trader EA Stands Out The AI Pro Trader EA combines three powerful indicators— Exponential Moving Average (EMA) , Relative Strengt
NDX 100 Swing EA MT5
Carlos Osvaldo Delgado
NDX 100 Swing EA   We lower prices! This expert advisor trades the Nasdaq 100 index. The strategy buys dips by taking profit from bullish trends. The investment is long term (Swing). It uses the RSI daily indicator as a signal to open operations, the management of operations, the level of risk and capital management is carried out based on probability calculations based on statistics. To achieve this, this project has been in development for more than 5 years, during which large amounts of data
Glider
Vitalii Zakharuk
The Glider indicator gives accurate and timely signals to enter and exit the transaction that appear on the current candle. Using the indicator is very simple. When a dot and a blue line appear, open a buy deal. When a dot and a red line appear, open a sell deal. The main purpose of this indicator is to determine the moments of entry and exit from transactions, therefore the Glider indicator will display only the trend line and entry points, i.e. displays displays the entry points to the marke
Gli utenti di questo prodotto hanno anche acquistato
Ottieni l’indicatore AUX GRATUITO e il supporto EA Download diretto — Clicca qui [ D.I.C.E ] The DICE Indicator  Divergence in Chaos Environment è uno strumento MT5 specializzato per trader che applicano la Teoria delle Onde di Elliott nel contesto delle tecniche di Trading Chaos. Identifica divergenze nascoste e regolari nell’azione dei prezzi, sincronizzate con l’ambiente di mercato caotico descritto da Bill Williams. Caratteristiche principali Divergenza allineata alle Onde di Elliott: rilev
ARIPoint
Temirlan Kdyrkhan
1 (1)
ARIPoint is a powerful trading companion designed to generate high-probability entry signals with dynamic TP/SL/DP levels based on volatility. Built-in performance tracking shows win/loss stats, PP1/PP2 hits, and success rates all updated live. Key Features: Buy/Sell signals with adaptive volatility bands Real-time TP/SL/DP levels based on ATR Built-in MA Filter with optional ATR/StdDev volatility Performance stats panel (Success, Profit/Loss, PP1/PP2) Alerts via popup, sound, push, or email Cu
Rtc ML Ai Predictor
Muhammad Faisal Sagala
Rtc ML Ai | Predictor CORE MACHINE LEARNING ENGINE Adaptive ML Market Predictor – Multi-Bar Trend & Candle Forecast What This Indicator Does This indicator is a  real-time market prediction engine  designed to analyze price behavior and estimate  future market tendencies . Unlike conventional indicators, this system  does not rely on static parameters or historical curve-fitting , but adapts its internal state dynamically during live market operation. Instead of using static rules, the indic
L’indicatore analizza il volume da qualsiasi punto e calcola i livelli di esaurimento del mercato per quel volume. Linee principali di Meravith: Linea di esaurimento del volume rialzista – funge da obiettivo. Linea di esaurimento del volume ribassista – funge da obiettivo. Linea di tendenza – indica la tendenza del mercato. Cambia colore a seconda che il mercato sia rialzista o ribassista e funge da supporto di tendenza. Come utilizzarlo: fai doppio clic sulla linea verticale viola e spostala ne
L'indicatore " Dynamic Scalper System MT5 " è progettato per il metodo di scalping, ovvero per il trading all'interno di onde di trend. Testato sulle principali coppie di valute e sull'oro, è compatibile con altri strumenti di trading. Fornisce segnali per l'apertura di posizioni a breve termine lungo il trend, con ulteriore supporto al movimento dei prezzi. Il principio dell'indicatore. Le frecce grandi determinano la direzione del trend. Un algoritmo per generare segnali per lo scalping sott
Max Ribbon Mt5
Stefano Frisetti
ATTENZIONE: Questo indicatore è distribuito ESCLUSIVAMENTE su MQL5.com Versione MT4:   https://www.mql5.com/it/market/product/160363 Versione MT5:   https://www.mql5.com/it/market/product/160410 ================================================================================ MAX RIBBON ver 1.00 L'indicatore che ti mostra il TREND in modo chiaro e inequivocabile! ================================================================================ DESCRIZIONE MAX RIBBON è un indicatore di trend
TrendMaestro5
Stefano Frisetti
Attenzione alle truffe, questo indicatore e' distribuito esclusivamente su MQL5.com nota: questo indicatore e' per METATRADER5, se vuoi la versione per  METATRADER4 questo e' il link:   https://www.mql5.com/it/market/product/108106 TRENDMAESTRO ver 2.5 TRENDMAESTRO   riconosce un nuovo TREND sul nascere, non sbaglia mai. La sicurezza di identificare un nuovo TREND non ha prezzo. DESCRIZIONE TRENDMAESTRO identifica un nuovo TREND sul nascere, questo indicatore prende in esame la volatilita' i
Pantera Indicator
Temirlan Kdyrkhan
5 (1)
A tool for on-chart strategy backtesting and performance analysis. A utility for developing, debugging, and testing custom trading ideas and indicator functions. An indicator designed to quickly test trading concepts and visualize the effectiveness of different input parameters. An all-in-one sandbox for testing everything from simple crossovers to complex, multi-condition trading systems.
+++++++++++++++++++++++++++++++++++++++++++++++++++++++++++++++++++++++++++++++++++++++++++++++++ +++ Link to EURUSD Only Free Version -->  https://www.mql5.com/en/market/product/156904?source=Unknown +++++++++++++++++++++++++++++++++++++++++++++++++++++++++++++++++++++++++++++++++++++++++++++++++ Hallo Trader, This is a traditional GANN & FIBONACCI strategy based on detection of an impulsive move in the opposite direction. This is called a Breakout. At the moment of Breakout, the indicator draw
MATADOR GOLD – XAUUSD MT5 M5 Timeframe Scalp Signals MATADOR GOLD is a professional signal indicator designed for XAUUSD (Gold) scalping on the M5 timeframe , with optional higher-timeframe confirmation. This indicator does not open or manage trades automatically . It provides structured buy and sell signals, intelligent filtering, and alerts, allowing traders to execute trades using their own strategy and risk management rules. Core Concept (Multi-Concept Architecture) MATADOR GOLD is built
FXLAND Smart Reversal Indicator (MT5) FXLAND Smart Reversal Indicator is a professional technical analysis tool designed to help traders identify potential price reversal zones and key market turning points with clarity and precision. The best reversal indicator and price return by choosing only one ceiling or floor in each time frame A masterpiece of combining mathematics and Gann, fractal matrix, Fibonacci, movement angle and time. Completely intelligent Key Features Detects potenti
VTrende Pro
Andrii Diachenko
5 (1)
VTrende Pro - MTF indicator for trend trading with a display panel for MT5 *** Videos can be translated into any language using subtitles (video language - Russian) Although the signals of the VTrende Pro indicator can be used as signals of a full-fledged trading system, it is recommended to use them in conjunction with the Bill Williams TS. VTrende Pro is an extended version of the VTrende indicator. Difference between Pro version and VTrende: - Time zones - Signal V - signal 1-2 waves -    S
Hello I Want to introduce The Forex Buy Sell Arrow Premium MT5 i recently release this premium indicator! its 1000% Non Repaint Indicator, It Work Perfectly Well,, i tested it day by day, Just mind blowing Result,  Including Powerful trend Algorithm! How It Work? well, it work market trend formula, when trend Bullish Or when trend Bearish,  Recommend Timeframe M30, H1 it work all timeframe, and all currency pair, 100% non repaint, How to take signal From Forex Buy Sell Arrow Premium Ind
WanaScalper
Isaac Wanasolo
1 (1)
A scalping indicator based on mathematical patterns, which on average gives signals with relatively small SL, and also occasionally helps to catch big moves in the markets (more information in the video) This indicator has three main types of notifications: The first type warns of a possible/upcoming signal on the next bar The second type indicates the presence of a ready signal to enter the market/open a position The third type is for SL and TP levels - you will be notified every time price re
##   ONLY GOLD ##   Тiльки Золото ## **Mercaria Professional Trading Zones - Complete Guide** ## **Mercaria Professional Trading Zones - Повний посібник** ### **How Mercaria Zones Work / Як працюють зони Mercaria** **English:** Mercaria Zones is an advanced trading indicator that identifies high-probability support and resistance areas using ZigZag extremes combined with mathematical zone calculations. The indicator works on multiple timeframes simultaneously, providing a comprehensive view
Frontier Pivots
Nestor Jose Mendez Boza
FRONTIER PIVOTS - Geometric Levels Indicator This indicator plots support and resistance levels/ranges on the chart using mathematical calculations. It helps traders identify potential price reaction zones based on geometric patterns. Main Features: Automatically calculates and displays key price levels Plots both support and resistance lines Uses daily price data for level calculation Clean visual presentation with different colors for different level types No repainting - levels remain static
Scalping Winning Signals Pro SWS
Muhammad Usman Siddique
5 (1)
UZFX SWS {Scalping Winning Signals} Pro v1.0 è un potente indicatore non ridipingente sviluppato da Usman Zabir (UZFX LABS) appositamente per scalper, day trader e swing trader alla ricerca di segnali di ingresso precisi in mercati in rapido movimento. Ideale per i trader che richiedono segnali affidabili e in tempo reale senza ritardi o false ridipinture. I MIEI INTERVALLI DI TEMPO CONSIGLIATI*: 30 M E OLTRE. {1H} È IL MIO PREFERITO. E I RISULTATI SONO SORPRENDENTI...! Le caratteristiche prin
Enigma 112
issam rahhal sabour
Enigma 112 Indicator - User Manual Enigma 112 Indicator Complete User Manual - Ultimate Trading Solution Introduction The Enigma 112 is a comprehensive multi-timeframe trading indicator that combines advanced technical analysis concepts including Tesla 3-6-9 Gates, Huddleston Theory, PO3 Dealing Ranges, and sophisticated risk management systems. Tesla 3-6-9 Gates Based on Nikola Tesla's vortex mathematics for precise support and resistance levels Huddleston Theory Volume-based market
The Expert Advisor and the video are attached in the Discussion tab . The robot applies only one order and strictly follows the signals to evaluate the indicator efficiency. Pan PrizMA CD Phase is an option based on the Pan PrizMA indicator. Details (in Russian). Averaging by a quadric-quartic polynomial increases the smoothness of lines, adds momentum and rhythm. Extrapolation by the sinusoid function near a constant allows adjusting the delay or lead of signals. The value of the phase - wave s
Классификатор силы тренда. Показания на истории не меняет. Изменяется классификация только незакрытого бара. По идее подобен полной системе ASCTrend, сигнальный модуль которой, точнее его аппроксимация в несколько "урезанном" виде, есть в свободном доступе, а также в терминале как сигнальный индикатор SilverTrend . Точной копией системы ASCTrend не является. Работает на всех инструментах и всех временных диапазонах. Индикатор использует несколько некоррелируемых между собой алгоритмов для класси
FFx Universal Strength Meter PRO is more than a basic strength meter. Instead of limiting the calculation to price, it can be based on any of the 19 integrated strength modes + 9 timeframes. With the FFx USM, you are able to define any period for any combination of timeframes. For example, you can set the dashboard for the last 10 candles for M15-H1-H4… Full flexibility! Very easy to interpret... It gives a great idea about which currency is weak and which is strong, so you can find the best pai
The FFx Universal MTF alerter shows on a single chart all the timeframes (M1 to Monthly) with their own status for the chosen indicator. 9 indicators mode (MACD-RSI-Stochastic-MA-ADX-Ichimoku-Candles-CCI-PSAR). Each can be applied multiple times on the same chart with different settings. Very easy to interpret. Confirm your BUY entries when most of the timeframes are showing green color. And confirm your SELL entries when most of the timeframes are showing red color. 2 Alert Options : input to s
The FFx Watcher PRO is a dashboard displaying on a single chart the current direction of up to 15 standard indicators and up to 21 timeframes. It has 2 different modes: Watcher mode: Multi Indicators User is able to select up to 15 indicators to be displayed User is able to select up to 21 timeframes to be displayed Watcher mode: Multi Pairs User is able to select any number of pairs/symbols User is able to select up to 21 timeframes to be displayed This mode uses one of the standard indicators
FFx Patterns Alerter gives trade suggestions with Entry, Target 1, Target 2 and StopLoss .... for any of the selected patterns (PinBar, Engulfing, InsideBar, OutsideBar) Below are the different options available: Multiple instances can be applied on the same chart to monitor different patterns Entry suggestion - pips to be added over the break for the entry 3 different options to calculate the SL - by pips, by ATR multiplier or at the pattern High/Low 3 different options to calculate the 2 TPs -
MetaTrader 4 version available here : https://www.mql5.com/en/market/product/24881 FFx Basket Scanner is a global tool scanning all pairs and all timeframes over up to five indicators among the 16 available. You will clearly see which currencies to avoid trading and which ones to focus on. Once a currency goes into an extreme zone (e.g. 20/80%), you can trade the whole basket with great confidence. Another way to use it is to look at two currencies (weak vs strong) to find the best single pairs
MetaTrader 4 version available here: https://www.mql5.com/en/market/product/25793 FFx Pivot SR Suite PRO is a complete suite for support and resistance levels. Support and Resistance are the most used levels in all kinds of trading. Can be used to find reversal trend, to set targets and stop, etc. The indicator is fully flexible directly from the chart 4 periods to choose for the calculation: 4Hours, Daily, Weekly and Monthly 4 formulas to choose for the calculation: Classic, Camarilla, Fibonac
Il livello Premium è un indicatore unico con una precisione superiore all'80% delle previsioni corrette! Questo indicatore è stato testato dai migliori Specialisti di Trading per più di due mesi! L'indicatore dell'autore che non troverai da nessun'altra parte! Dagli screenshot puoi vedere di persona la precisione di questo strumento! 1 è ottimo per il trading di opzioni binarie con un tempo di scadenza di 1 candela. 2 funziona su tutte le coppie di valute, azioni, materie prime, criptovalu
ClassicSBA
Umri Azkia Zulkarnaen
this indicator very simple and easy if you understand and agree with setup and rule basic teknical sba you can cek in link : please cek my youtube channel for detail chanel : an for detail info  contact me  basicly setup buy (long) for this indicator is Magenta- blue and green candle or magenta - green  and green candlestik and for setup sell (short) is Black - yellow - and red candle or black - red  and red candlestik
Pendiente de Precio
Cesar Juan Flores Navarro
Indicador en base a la pendiente de la linea de precio, dibuja una línea de color cuando sube a base de los precios que previamente has sido procesados o linealizados, y cuando baja la pendiente la linea linealizada toma otro color. En este caso se a considerado 6 lineas de diferentes procesos desde pendientes largas hacia las cortas, observándose que cuando coincidan las pendientes se produce un máximo o mínimo, lo que a simple vista nos permitirá hacer una COMPRA O VENTA.
Индикатор Coefficient Of Determination (COD) представляет собой значение коэффициента детерминации или квадрат коэффициента корреляции между зависимой переменной — ценой и объясняющей переменной — тиковым объемом. Что это дает нам на практике? COD отлично распознает кульминацию трендовых движений, что позволяет подбирать оптимальные точки и ловить развороты рынка. Как использовать индикатор: Наиболее популярная торговая стратегия строится совместно с трендовым индикатором Moving Average (MA), пе
Filtro:
Nessuna recensione
Rispondi alla recensione