Cycles Plotter
- Göstergeler
-
Edoardo Centorame
 Ben profesyonel bir trader ve MT5 geliştiricisiyim, trading ve karar destek araçlarının geliştirilmesinde yıllara dayanan deneyime sahibim. Trader’ların piyasa trendlerini analiz etmelerine ve ticaret stratejilerini geliştirmelerine yardımcı olmak için sistemler ve görsel araçlar oluşturuyorum.
 - Sürüm: 1.0
- Etkinleştirmeler: 5
Cycles Plotter Hareketli Ortalamalar ve Başlangıç Tarihi ile Özelleştirilebilir Döngüler Göstergesi
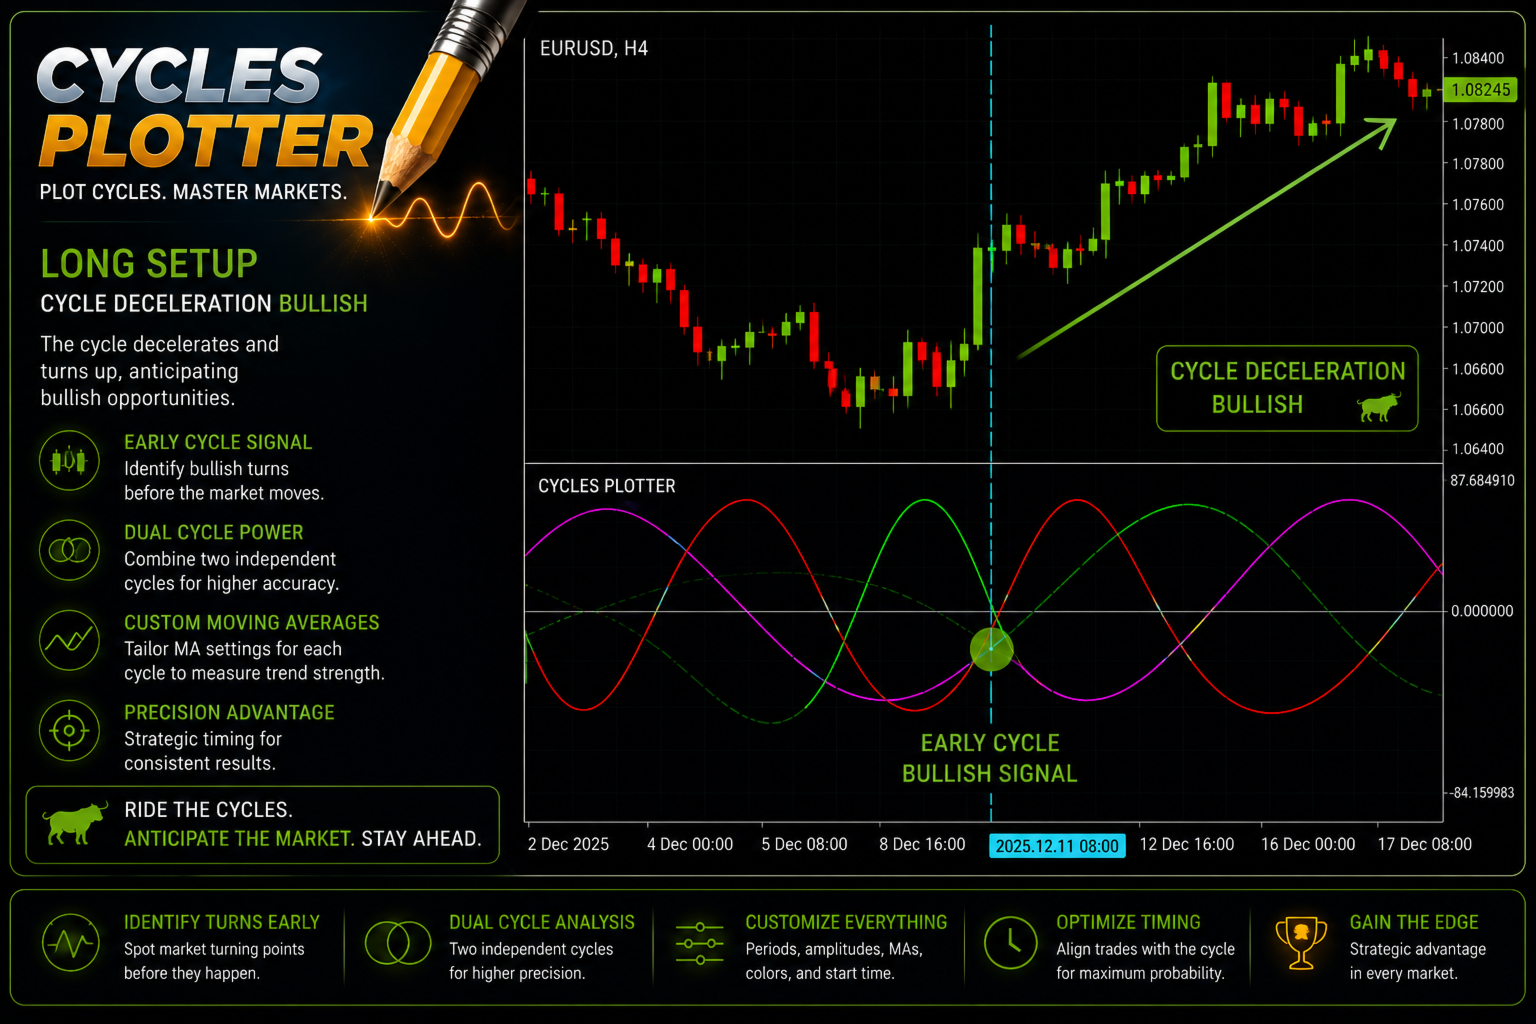
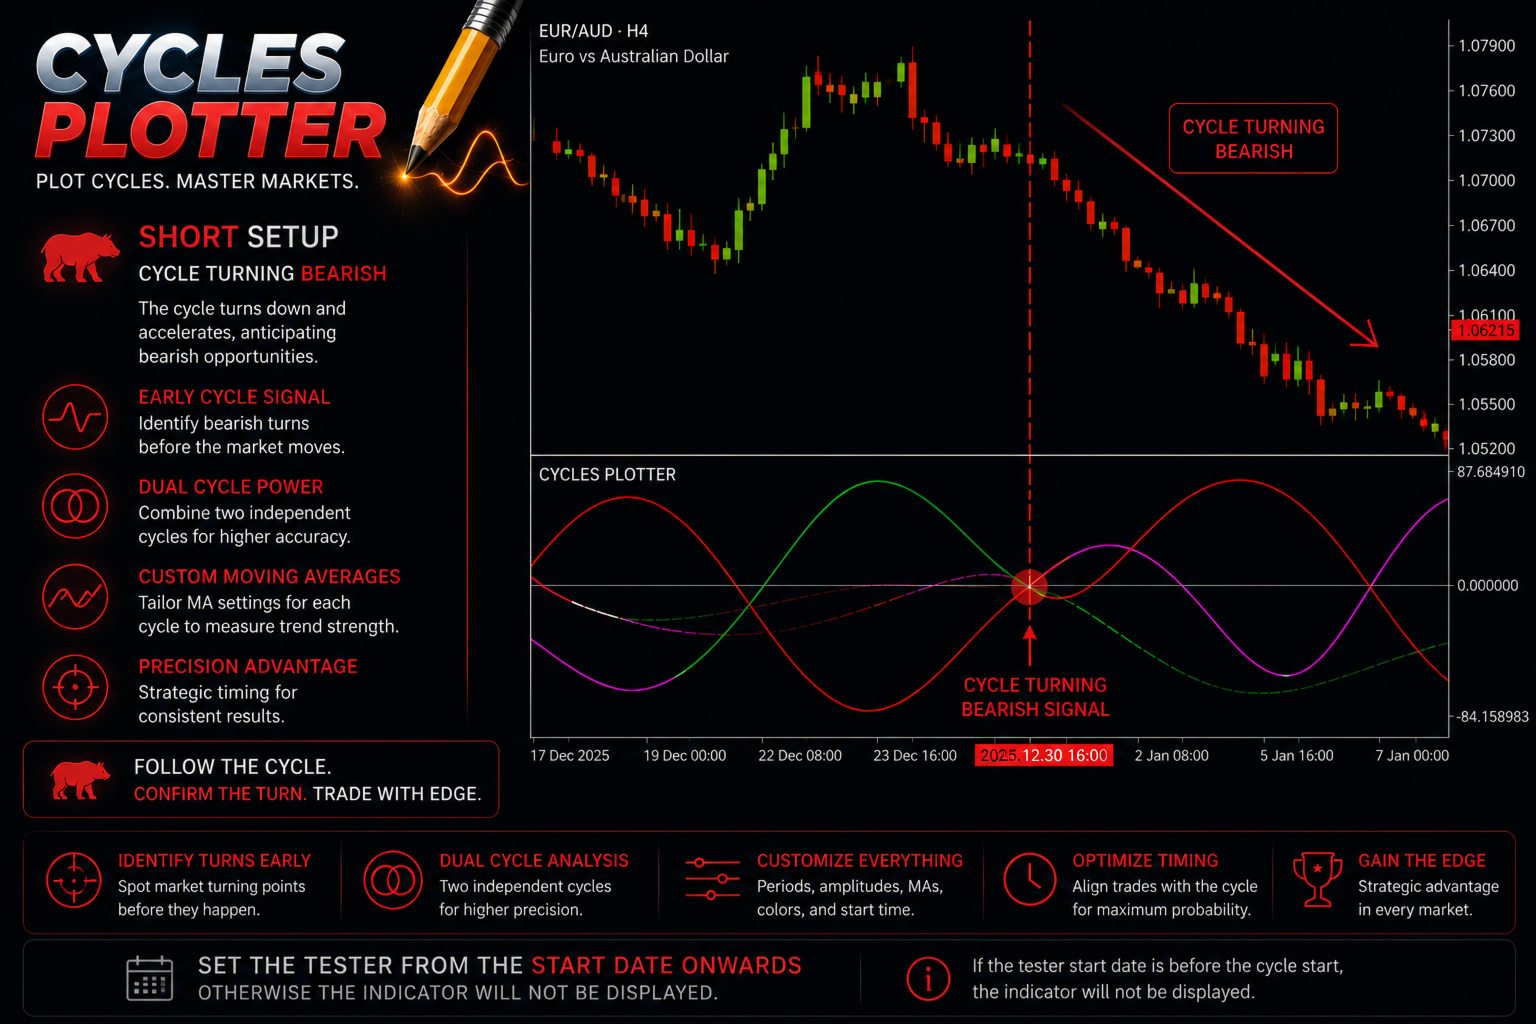
Cycles Plotter, yalnızca kullanıcının inputuna bağlı olarak tamamen özelleştirilebilir iki sinüzoidal döngü çizen gelişmiş bir teknik göstergedir. Döngüleri otomatik olarak üretmez: tüm döngüler yalnızca kullanıcı tarafından ayarlanan parametrelere göre hesaplanır, traderlara fiyat salınımlarını ve potansiyel trend değişikliklerini incelemek için görsel bir araç sunar, otomatik sinyaller veya tahminler üretmez.
Ana noktalar:
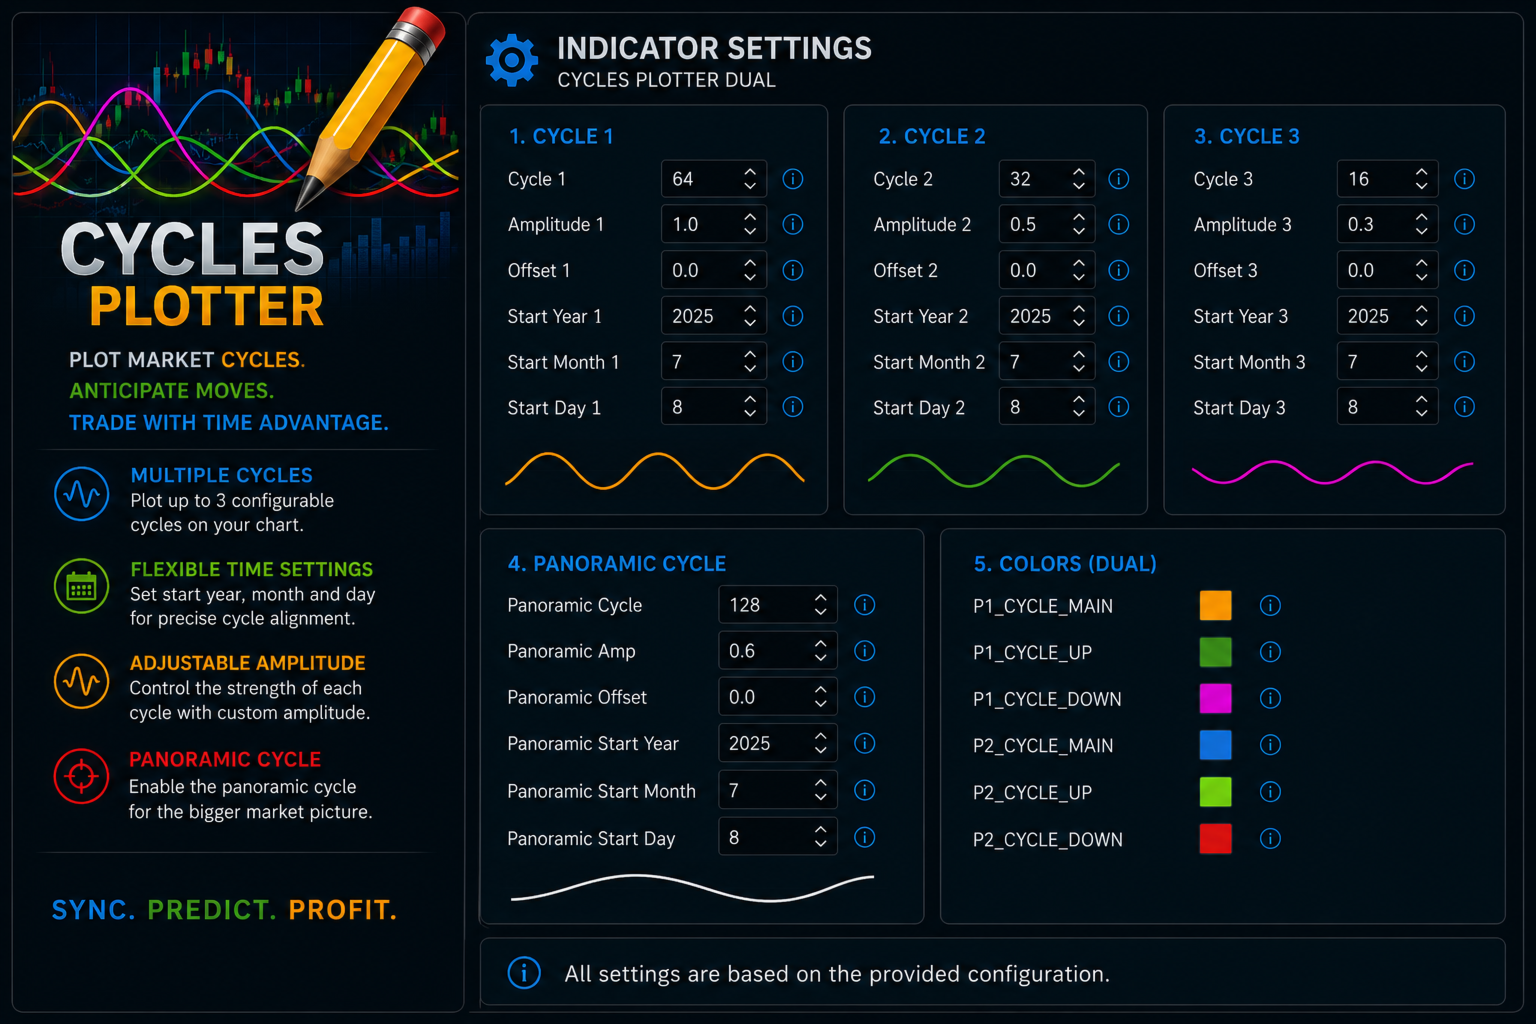
Kullanıcı tarafından tanımlanan döngüler: Döngüler 1 P1 ve 2 P2 tamamen kullanıcı tarafından yapılandırılabilir. Döngü uzunluğu, genlik, hareketli ortalamalar ve kesin başlangıç tarihi ve saati ayarlanabilir. Kullanıcı parametreleri girmezse hiçbir döngü çizilmez.
Genlik kontrolü: Her döngü farklı bir genliğe sahip olabilir, bu da referans hareketli ortalamaya göre salınımların yüksekliğini ayarlamayı sağlar.
Trend tespiti: Hızlı ve yavaş hareketli ortalamalar döngünün yönünü gösterir:
Fast MA, Slow MA’dan büyük yükseliş aşaması yeşil lime
Fast MA, Slow MA’dan küçük düşüş aşaması magenta kırmızı
Fast MA yaklaşık olarak Slow MA’ya eşit yatay aşama flat turuncu mavi
Döngü çizimleri: Her döngünün üç ayrı çizgisi vardır:
Yükseliş aşaması yeşil lime
Düşüş aşaması magenta kırmızı
Yatay aşama flat turuncu mavi
Özelleştirilebilir başlangıç tarihi ve saati: Her döngünün çizilmeye başladığı kesin anı tanımlamak mümkündür, piyasa olayları veya tarihsel patternlerle hassas hizalama için.
Kime yöneliktir?
Bu gösterge özellikle şu kişiler için tavsiye edilir:
piyasa döngülerini inceleyen veya zaten incelemiş olanlar,
tradinge uygulanan döngüler hakkındaki bilgisini derinleştirmek isteyenler,
döngüleri trading sistemlerinde kullanan veya kendi sistemlerine entegre etmek isteyenler.
Bu nedenle Cycles Plotter, fiyatların döngüsel hareketlerini analiz etmek isteyen deneyimli traderlar için de, öğrenme veya araştırma aşamasında olanlar için de faydalıdır. Döngü tekniği güvenilir bir araçtır, uzun yıllardır sağlamlaşmıştır ve başlıca teknik analiz ve profesyonel trading sistemlerinde mevcuttur.
Önemli: Gösterge otomatik sinyaller veya tahminler üretmez. Tüm hesaplamalar ve döngüler yalnızca kullanıcı tarafından sağlanan inputlara dayanır.