Cycles Plotter

  • 지표
  • Edoardo Centorame
    Edoardo Centorame
    저는 전문 트레이더이자 MT5 개발자로, 트레이딩 및 의사결정 지원을 위한 고급 도구 개발에 다년간의 경험을 보유하고 있습니다. 트레이더가 시장 트렌드를 분석하고 거래 전략을 개선할 수 있도록 시스템과 시각적 도구를 제공합니다.

    제 도구는 자동 신호를 생성하지 않지만, 경험 있는 트레이더와 초보자 모두에게 명확하고 즉각적인 기술 분석 지원을 제공합니다.

    MT5 거래 도구의 고급 사용법, 전략 및 최적화에 관한 제 기사와 업데이트를 확인하세요
  • 버전: 1.0
  • 활성화: 5

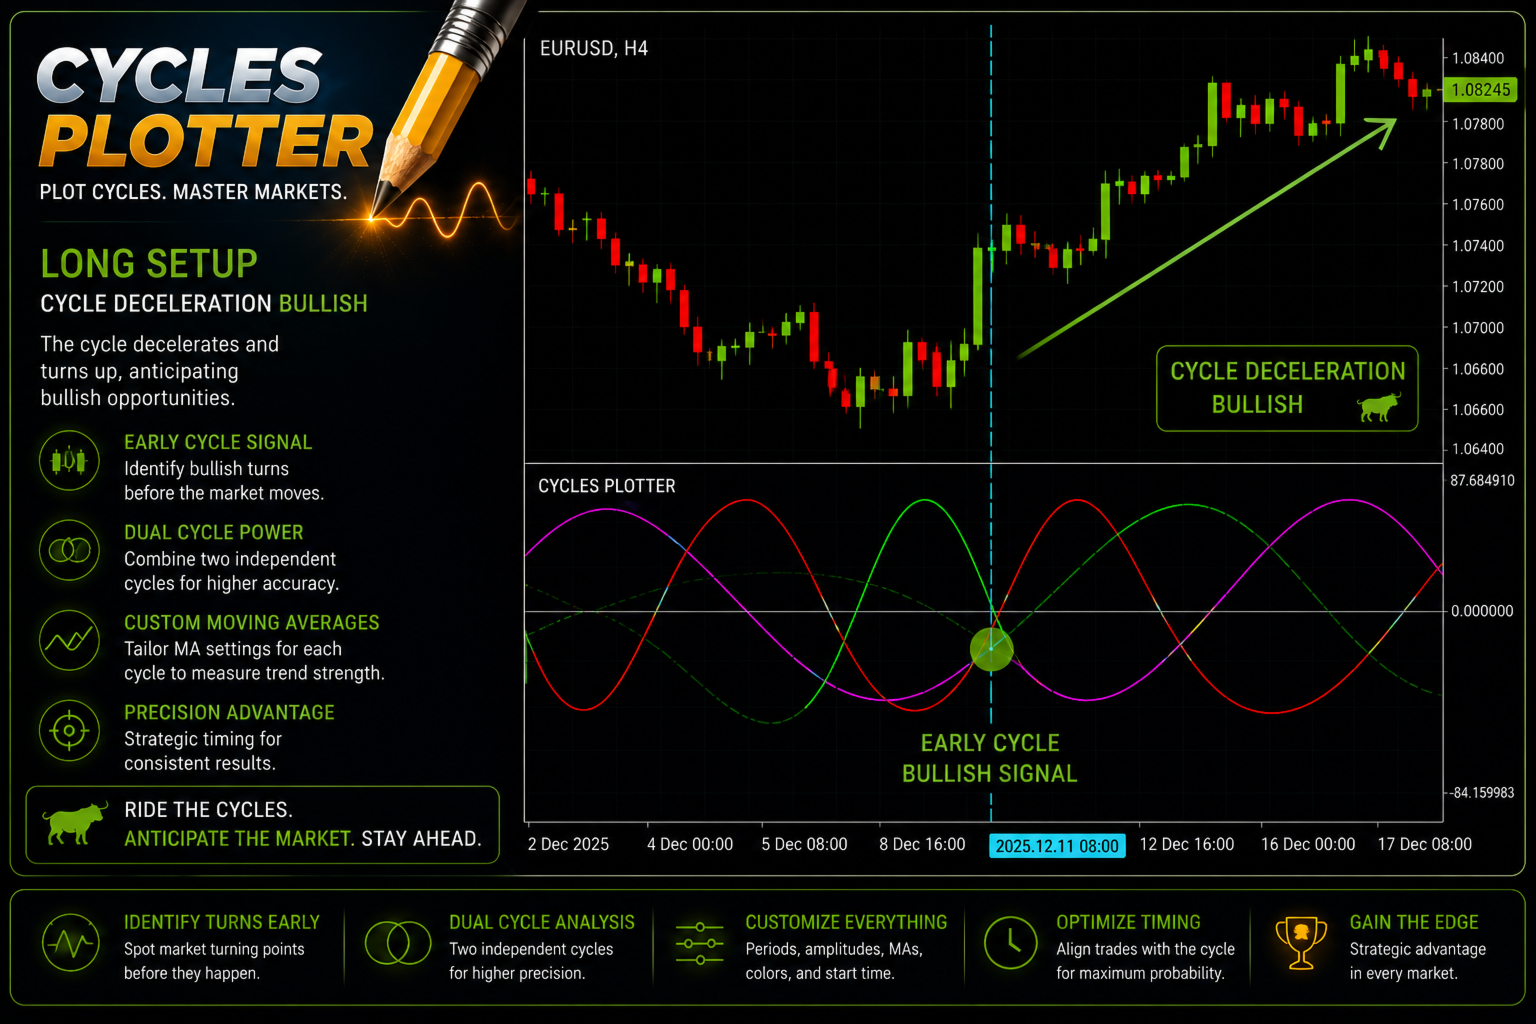
Cycles Plotter 이동 평균과 시작 날짜가 있는 사용자 지정 가능 사이클 지표

Cycles Plotter는 사용자의 입력에 의해서만 완전히 사용자 지정 가능한 두 개의 사인파 사이클을 그리는 고급 기술 지표입니다. 사이클을 자동으로 생성하지 않습니다. 모든 사이클은 사용자가 설정한 매개변수에만 기반하여 계산되며, 자동 신호나 예측을 생성하지 않고 가격 진동과 잠재적인 추세 변화를 연구하기 위한 시각적 도구를 트레이더에게 제공합니다.

핵심 사항:

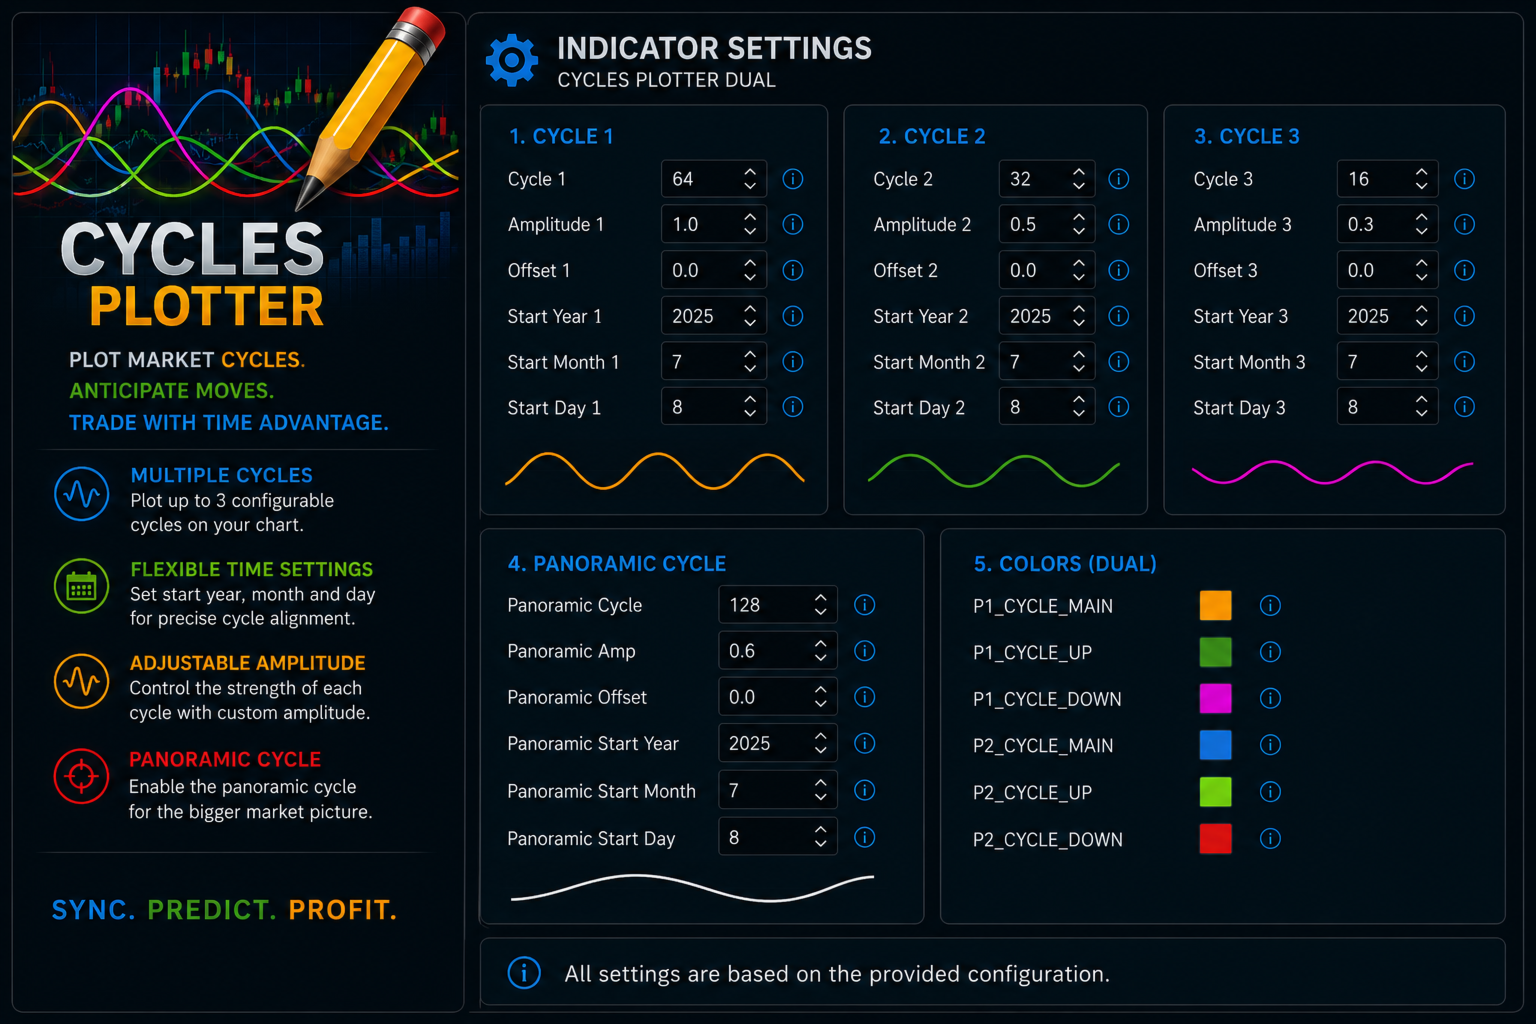
사용자 정의 사이클: 사이클 1 P1 및 2 P2는 사용자가 완전히 구성할 수 있습니다. 사이클 길이, 진폭, 이동 평균, 정확한 시작 날짜와 시간을 설정할 수 있습니다. 사용자가 매개변수를 입력하지 않으면 어떤 사이클도 그려지지 않습니다.

진폭 제어: 각 사이클은 다른 진폭을 가질 수 있어 기준 이동 평균에 대한 진동의 높이를 조정할 수 있습니다.

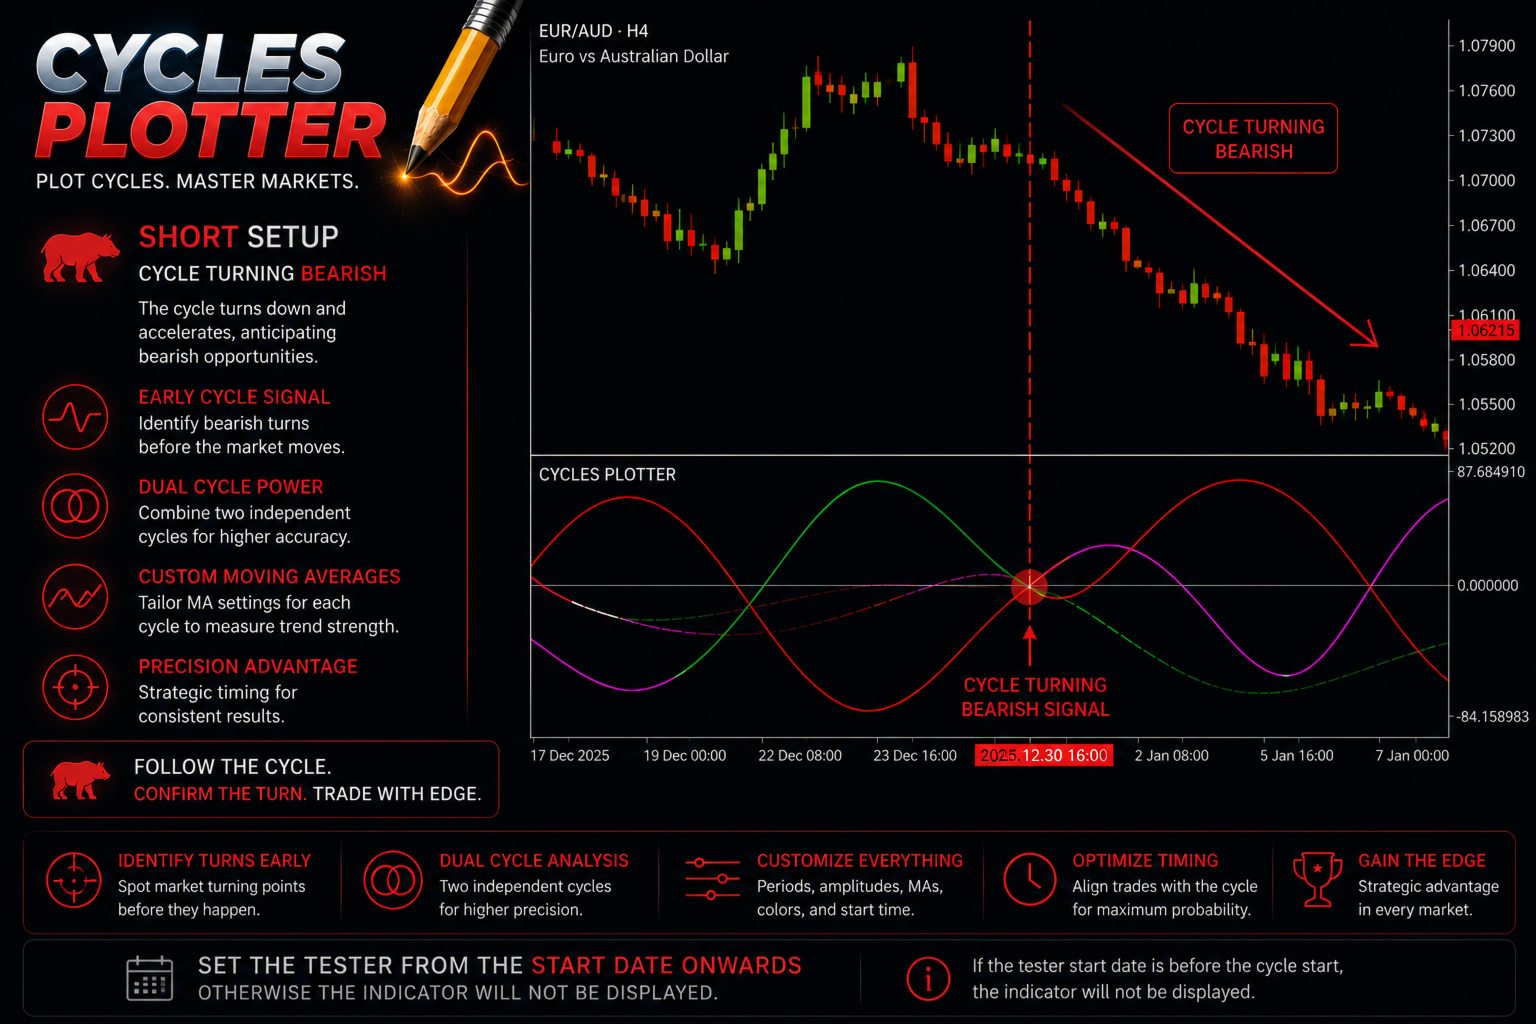
추세 감지: 빠른 이동 평균과 느린 이동 평균은 사이클의 방향을 나타냅니다:

Fast MA가 Slow MA보다 큼 상승 단계 녹색 lime

Fast MA가 Slow MA보다 작음 하락 단계 magenta 빨간색

Fast MA가 Slow MA와 거의 같음 횡보 단계 flat 주황색 파란색

사이클 플롯: 각 사이클에는 세 개의 별도 선이 있습니다:

상승 단계 녹색 lime

하락 단계 magenta 빨간색

횡보 단계 flat 주황색 파란색

사용자 지정 가능한 시작 날짜와 시간: 시장 이벤트 또는 과거 패턴과 정확하게 정렬하기 위해 각 사이클이 그려지기 시작하는 정확한 순간을 정의할 수 있습니다.

누구를 위한 것인가?
이 지표는 특히 다음과 같은 사람들에게 권장됩니다:

시장 사이클을 공부하고 있거나 이미 공부한 사람,

trading에 적용되는 사이클에 대한 자신의 지식을 심화하고 싶은 사람,

자신의 trading 시스템에서 사이클을 사용하거나 자신의 시스템에 통합하고 싶은 사람.

따라서 Cycles Plotter는 가격의 주기적 움직임을 분석하고자 하는 경험 많은 트레이더에게도 유용하며, 학습 또는 연구 단계에 있는 사람에게도 유용합니다. 사이클 기법은 신뢰할 수 있는 도구이며, 오랜 세월 동안 확립되어 왔고, 주요 기술 분석 및 전문 trading 시스템에 존재합니다.

중요: 이 지표는 자동 신호나 예측을 생성하지 않습니다. 모든 계산과 사이클은 사용자가 제공한 입력에만 기반합니다.


추천 제품
CosmiCLab FIBO
Kirils Subins
CosmiCLab SMC FIBO CosmiCLab SMC FIBO is a professional trading indicator designed for traders who use Smart Money Concepts (SMC), market structure analysis and Fibonacci retracement levels. The indicator automatically detects market swings and builds Fibonacci levels based on the latest impulse movement. It also identifies market structure changes such as BOS (Break of Structure) and CHOCH (Change of Character), helping traders understand the current market direction. CosmiCLab SMC FIBO also pr
Zone Structure Scanner Panel for MT5 Find better setups faster — without scanning charts for hours. The Zone Structure Scanner Panel for MT5 helps you automatically scan multiple symbols, detect key weekly and daily support/resistance zones, read market structure, highlight confluence, and flag H4 rejection-confirmed setups from one powerful panel. Instead of jumping from chart to chart, you get ranked opportunities in one place so you can focus on the setups that matter most. Why it stands
Introducing "X Marks the Spot" – Your Ultimate MetaTrader 5 Indicator for Perfect Trades! Are you tired of the guesswork in trading? Ready to take your MetaTrader 5 experience to a whole new level? Look no further – "X Marks the Spot" is here to revolutionize your trading strategy! What is "X Marks the Spot"? "X Marks the Spot" is not just another indicator – it's your personal trading compass that works seamlessly on all timeframes . Whether you're a beginner or an experienced trader,
MercariaPattern1-2-3 відстежує рух ціни, знаходить трьоххвильові структури 1-2-3 та підсвічує момент, коли сценарій підтверджується пробоєм ключового рівня. MercariaPattern1-2-3 tracks price movement, detects three-leg 1-2-3 structures and highlights the moment when the scenario is confirmed by a key level breakout. Індикатор збирає локальні свінги в компактну фігуру 0–1–2–3 , чекає підтвердженого пробою та будує стрілку входу з готовими рівнями SL/TP. The indicator combines local swings into a
Phantom Edge SMC
Nattapon Chuekamhod
Phantom Edge SMC — The Ultimate Smart Money Indicator for MT5 Tired of manually drawing structures while trading SMC or ICT concepts? Let Phantom Edge SMC do the heavy lifting for you. Key Features Internal & Swing Structure: Automatically detects BOS and CHoCH across two structural levels. Order Blocks (OB): Identifies Internal and Swing OBs with automated mitigation tracking. Equal Highs / Lows: Highlights EQH / EQL to pinpoint Liquidity pools. Fair Value Gaps (FVG): Displays FVGs with
RAD Real Acummulation and Distribution
Jose Alejandro Jacome Jimenez
RAD CRITICAL LEVES RAD indicator tracks “Relevant Volume” in real time, identifying accumulation and distribution processes, projecting them in the chart as SUPPORT or RESISTANCE zones. Natural   support   and resistance levels are generated by Volume Accumulation and Distribution processes. As these processes evolve, levels at which the relevant volume in the market place is positioned, become difficult areas to cross upwards or downwards. By using this information, traders can identify very s
Blahtech Market Profile MT5
Blahtech Limited
5 (10)
Was: $249  Now: $99   Market Profile defines a number of day types that can help the trader to determine market behaviour. A key feature is the Value Area, representing the range of price action where 70% of trading took place. Understanding the Value Area can give traders valuable insight into market direction and establish the higher odds trade. It is an excellent addition to any system you may be using. Inspired by Jim Dalton’s book “Mind Over Markets”, this indicator is designed to suit the
RBreaker
Zhong Long Wu
RBreaker Gold Indicators는 금 선물을 위한 단기 데이 트레이딩 전략으로, 추세 추종과 데이 내 반전의 두 가지 거래 방식을 결합합니다. 추세 장에서 수익을 포착할 수 있을 뿐만 아니라, 시장이 반전될 때 적시에 이익을 확정하고 추세에 맞춰 반대 포지션을 잡을 수 있습니다. 이 전략은 미국 잡지 Futures Truth에서 15년 연속으로 가장 수익성 높은 트레이딩 전략 상위 10위 안에 선정되었습니다. 긴 라이프사이클을 자랑하며, 현재까지 국내외에서 널리 사용되고 연구되고 있습니다. 본 지표는 2026년 금 선물의 움직임을 반영하여 14일 ATR 지표를 기반으로 돌파 계수 A, 관찰 계수 B, 반전 계수 R을 보다 합리적인 값으로 정의했습니다. 매우 훌륭한 지표이며, 안정적인 연간 수익성을 달성했습니다. 강력히 추천합니다~ 위 지표는 변동성이 높은 상품에 적합하며, 매개변수는 금 선물, 주가 지수 선물 등에 적합합니다. 다른 상품이 필요한 경우 돌파 계수 A
Trade smarter, not harder: Empower your trading with Harmonacci Patterns This is arguably the most complete harmonic price formation auto-recognition indicator you can find for the MetaTrader Platform. It detects 19 different patterns, takes fibonacci projections as seriously as you do, displays the Potential Reversal Zone (PRZ) and finds suitable stop-loss and take-profit levels. [ Installation Guide | Update Guide | Troubleshooting | FAQ | All Products  ] It detects 19 different harmonic pric
Master Osi
Norapan Tonphim
OSS ULTIMATE ELITE 2026 – Institutional Smart Money System Stop chasing price. Start trading like smart money.  Why Traders Are Switching to OSS Elite Most indicators react after the move. OSS ULTIMATE ELITE is designed to help you position before the move happens. This is not just another signal tool — it’s a complete trading framework combining momentum, structure, and liquidity behavior.  What Makes This Different? Not lagging signals Not random arrows Not overfitted strategies  Built
Overview The Market Perspective Structure Indicator is a comprehensive MetaTrader indicator designed to provide traders with a detailed analysis of market structure across multiple timeframes. It identifies and visualizes key price action elements, including swing highs and lows, Break of Structure (BOS), Change of Character (CHOCH), internal structures, equal highs/lows, premium/discount levels, previous levels from higher timeframes, and trading session zones. With extensive customization opt
VOLUME PROFILE SAF-XII MT5용 전문가급 마켓 프로파일 분석 도구 (그리드 스타일 트레이더를 위한 드림 인디케이터) 볼륨 프로파일(Volume Profile)이란? 볼륨 프로파일은 단순히 '시간'에 따른 거래량을 보여주는 일반 지표와 달리, 특정 '가격 수준'에서의 거래 활동을 표시하는 전문 기관용 도구입니다. 설정한 기간 내에 거래가 '어디서' 발생했는지를 시각화하여 다음을 식별할 수 있도록 돕습니다. 가치 영역 (VAH/VAL) – 전체 거래의 대부분이 발생한 가격대. 제어 지점 (POC) – 거래량이 가장 많이 집중된 단일 가격 수준. 유동성 불균형 – 각 가격대에서의 매수(Bull) vs 매도(Bear) 지배력. 지지/저항 – 실제 거래 활동에 기반한 자연적인 가격 지지 및 저항선. 3가지 작동 모드 – "설정 후 방치(Set and Forget)" 가능 VP_MANUAL (스윙 트레이딩 및 주요 레벨 분석) 사용자가 수직선을 드래그하여 분석 범위를 직접
Chỉ báo này sẽ thông báo cho bạn nếu cấu hình xu hướng thành công. Tín hiệu theo xu hướng không nên được tăng theo, nhưng tín hiệu mua ở mức giá thấp theo mô hình giao dịch thông thường của bạn, hoặc tín hiệu bán ở mức giá tốt, là một lựa chọn rất tốt. Hãy thiết lập nó trên khung thời gian lớn hơn và theo dõi các khung thời gian nhỏ hơn, bám sát các xu hướng chính. Tôi thường thiết lập ba khung thời gian gần nhau nhất và không bao giờ đi ngược tín hiệu của INdicator này. INdicator   này không có
표시기는 현재 시세를 작성하여 과거 시세와 비교할 수 있으며 이를 바탕으로 가격 변동을 예측합니다. 표시기에는 원하는 날짜로 빠르게 이동할 수 있는 텍스트 필드가 있습니다. 옵션: 기호 - 표시기가 표시할 기호 선택. SymbolPeriod - 지표가 데이터를 가져올 기간 선택. IndicatorColor - 표시기 색상. HorisontalShift - 지시자가 그린 따옴표를 지정된 막대 수만큼 이동합니다. Inverse - true는 인용 부호를 반대로, false - 원래 보기를 반전합니다. ChartVerticalShiftStep - 차트를 수직으로 이동합니다(키보드의 위/아래 화살표). 다음은 날짜를 입력할 수 있는 텍스트 필드의 설정으로, '엔터'를 누르면 즉시 이동할 수 있습니다.
Has rsi signal
Evgenii Savinov
HAS RSI Signal — SL/TP 자동 계산 기능이 포함된 전문 트렌드 지표 HAS RSI Signal 은 검증된 클래식 지표와 현대적인 노이즈 필터링 알고리즘을 결합한 강력한 트레이딩 도구입니다. 이 지표는 Heiken Ashi Smoothed (HAS) 캔들과 RSI 오실레이터를 통해 시장을 분석하며, 추세 반전이나 과매수/과매도 구간 이탈 시 트레이더에게 명확한 진입 신호를 제공합니다. 주요 장점: 이중 필터링: Heiken Ashi Smoothed를 사용하여 시장의 '노이즈'를 제거하고, RSI를 통해 모멘텀의 강도를 확인합니다. 자동 레벨 계산: 단순히 신호만 주는 것이 아니라, 변동성( ATR )을 기반으로 최적의 손절매(Stop Loss) 및 이익 실현(Take Profit) 레벨을 자동으로 계산합니다. 시각적 편의성: 신호가 차트 위에 컬러 캔들 형태로 직접 표시되어 복잡하지 않고 직관적으로 추세를 파악할 수 있습니다. 알림 시스템: 터미널 알람, 사운드, 스마
AutoTrend Pro
Aram Hussein Mohammed
TL Method — Automatic Trendline Detection & Strength Indicator Tired of drawing trendlines manually? TL Method does it for you — automatically detecting, drawing, and scoring trendlines in real time. What it does: Scans up to 1000 bars to find valid support and resistance trendlines Scores each trendline by counting confirmed anchor touches Generates buy/sell signal arrows when price approaches strong trendlines Alerts you via popup, push notification, or sound — with smart cooldown to avoid spa
Premium level Pro
Dmitriy Kashevich
Premium level is a unique indicator with more than 80% accuracy of correct predictions! This indicator has been tested for more than two months by the best Trading Specialists! The author's indicator you will not find anywhere else! From the screenshots you can see for yourself the accuracy of this tool! 1 is great for trading binary options with an expiration time of 1 candle. 2 works on all currency pairs, stocks, commodities, cryptocurrencies Instructions: As soon as the red arrow app
SMC Venom Model BPR 지표는 Smart Money(SMC) 개념 내에서 일하는 트레이더를 위한 전문 도구입니다. 가격 차트에서 두 가지 주요 패턴을 자동으로 식별합니다. FVG (공정 가치 갭)는 3개의 캔들의 조합으로, 첫 번째와 세 번째 캔들 사이에 갭이 있습니다. 이는 볼륨 지원이 없는 레벨 사이에 구역을 형성하여 종종 가격 수정으로 이어집니다. BPR (균형 가격 범위)은 두 개의 FVG 패턴의 조합으로, "브리지"를 형성합니다. 이는 가격이 낮은 볼륨 활동으로 움직일 때 브레이크아웃과 레벨로의 복귀 구역으로, 캔들 사이에 갭을 생성합니다. 이러한 패턴은 거래자가 차트에서 거래량과 가격 역학을 분석하여 주요 지지/저항 수준, 돌파 구역 및 진입 지점을 식별하는 데 도움이 되며, 여기서 대형 시장 참여자와 일반 참여자 간의 상호 작용이 발생합니다. 이 지표는 사각형과 화살표 형태로 패턴을 시각화하며 유연한 경고 설정도 지원합니다. 주요 특징: 패턴 표시 모드
MetaTrader 4 version available here: https://www.mql5.com/en/market/product/25793 FFx Pivot SR Suite PRO is a complete suite for support and resistance levels. Support and Resistance are the most used levels in all kinds of trading. Can be used to find reversal trend, to set targets and stop, etc. The indicator is fully flexible directly from the chart 4 periods to choose for the calculation: 4Hours, Daily, Weekly and Monthly 4 formulas to choose for the calculation: Classic, Camarilla, Fibonac
Unlock powerful breakout opportunities The 123 Pattern is one of the most popular, powerful and flexible chart patterns. The pattern is made up of three price points: a bottom, a peak or valley, and a Fibonacci retracement between 38.2% and 71.8%. A pattern is considered valid when the price breaks beyond the last peak or valley, moment at which the indicator plots an arrow, rises an alert, and the trade can be placed. [ Installation Guide | Update Guide | Troubleshooting | FAQ | All Products  ]
Cumulative Delta NG
Anton Polkovnikov
Cumulative delta indicator As most traders believe, the price moves under the pressure of market buying or selling. When someone redeems an offer standing in the cup, the deal is a "buy". If someone pours into the bid standing in the cup - the deal goes with the direction of "sale". The delta is the difference between purchases and sales. A cumulative delta - the difference between the cumulative sum of purchases and sales for a certain period of time. It allows you to see who is currently contr
Price Magnet — Price Density and Attraction Levels Indicator Price Magnet is a professional analytical tool designed to identify key support and resistance levels based on statistical Price Density. The indicator analyzes a specified historical period and detects price levels where the market spent the most time. These zones act as “magnets,” attracting price action or forming a structural base for potential reversals. Unlike traditional Volume Profile tools, Price Magnet focuses on price-time d
FX-AIEA Smart Supply and Demand Zone Identification Indicator (Supply and Demand Indicators MT5) Version: 2.51 | Compatible Platform: MetaTrader 5  Why do trades need supply and demand zones? Supply and demand zones are the core manifestation of institutional order flow, reflecting real buying and selling power more accurately than traditional support and resistance. However, manual drawing is not only time-consuming but also highly subjective and prone to missing key areas. FX-AIEA Supp
Potential Reversal Price (PRP) Indicator - Ultimate Sniper Entries for XAUUSD Discounted   Price   !!     Secure your lifetime access   now   before it switches to   subscription-only ! Welcome to the Potential Reversal Price (PRP) Indicator , your ultimate trading tool designed to catch high-probability market reversals with extreme precision. Built for serious traders who demand accuracy, the PRP Indicator combines advanced market structure analysis with momentum exhaustion to pinpoint the exa
The Super Arrow Indicator provides non-repainting buy and sell signals with exceptional accuracy. Key Features No repainting – confirmed signals remain fixed Clear visual arrows: green for buy, red for sell Real-time alerts via pop-up, sound, and optional email Clean chart view with no unnecessary clutter Works on all markets: Forex, gold, oil, indices, crypto Adjustable Parameters TimeFrame Default:   "current time frame" Function:   Sets the time frame for indicator calculation Options:   Can
Volume Profile Canvas
Mauro Italo Gaspari
Volume Profile Canvas - Professional Volume Profile Indicator for MetaTrader 5 DESCRIPTION Volume Profile Canvas is a professional volume profile indicator for MetaTrader 5 that renders directly on the chart using a high-performance Canvas engine. It calculates and displays the volume distribution across price levels, identifying the Point of Control (POC), Value Area High (VAH) and Value Area Low (VAL) in real time. This is a pure analysis tool. It does not trade. It gives you an instant vi
Footprint is an indicator for order flow and volume analysis. It helps identify market structure at the cluster level, find key zones with increased activity, and work with filters directly on the chart without constantly opening the settings window. Footprint Indicator Features cluster-based Bid x Ask and Delta charts; on-chart control panel; sliders for filter adjustments; Absorption; Initiative; Stacked Imbalances; Big Trades; dPOC / Dynamic Point of Control; Delta; side market profile; cumul
Looking for reliable levels on a price chart? Already tired of searching for similar indicators? Are the levels not working out as they should? Then this is the indicator for you. Volume Prices Universal is a reliable indicator of horizontal volumes. What does it show? First of all, the main idea of ​​the indicator is to display at which price mark the price has been for the longest time. Thus, the display of price volumes on the price chart is formed. With the help of which you can very simpl
GorMaster Pro
Manuel Damian Ortiz Fernandez
GorMaster_Pro — Sesgo confiable, noticias y técnica en una sola pantalla Visión GorMaster_Pro es una herramienta indispensable para cualquier tipo de trader (scalper, intradía o swing) porque combina información fundamental y técnica para darte una lectura fiel y accionable del mercado. En una sola vista verás: sesgo direccional BUY/SELL/RANGO , ventanas de noticias en tiempo real que congelan la operativa, métricas técnicas clave (ATR_Z, RangeRatio, ADX, SpreadZ), sesiones y alertas . Todo org
Deriv Boom sell
Yaovi Inoussa Atchou
Our BOOM SELL ALERT indicator is specifically engineered to   take candles on BOOM 1000 , BOOM 500 is tool is optimized for M1 (1-minute) timeframe, ensuring you receive timely and actionable insights.   The indicator is a combination of   many indicators. -        AO Oscillator -        Stochastic   HOW TO USE THIS INDICATOR To use well this indicator , it   need to use SCHAFF TREND RSX ( 5 MIN OR M5) IF SCHAFF trend RSX is GREEN and you have a signal then SELL when you have ENTRY and out with
이 제품의 구매자들이 또한 구매함
PrimeScalping
Temirlan Kdyrkhan
PrimeScalping is a powerful trading companion designed to generate high-probability entry signals with dynamic TP/SL/DP levels based on volatility. Built-in performance tracking shows win/loss stats, PP1/PP2 hits, and success rates — all updated live. Key Features: Buy/Sell signals with adaptive volatility bands Real-time TP/SL/DP levels based on ATR Built-in MA Filter with optional ATR/StdDev volatility Performance stats panel (Success, Profit/Loss, PP1/PP2) Alerts via popup, sound, push, or e
SmartScalping
Temirlan Kdyrkhan
SmartScalping is a powerful trading companion designed to generate high-probability entry signals with dynamic TP/SL/DP levels based on volatility. Built-in performance tracking shows win/loss stats, PP1/PP2 hits, and success rates — all updated live. Key Features: Buy/Sell signals with adaptive volatility bands Real-time TP/SL/DP levels based on ATR Built-in MA Filter with optional ATR/StdDev volatility Performance stats panel (Success, Profit/Loss, PP1/PP2) Alerts via popup, sound, push, or e
ARIPoint
Temirlan Kdyrkhan
1 (1)
ARIPoint is a powerful trading companion designed to generate high-probability entry signals with dynamic TP/SL/DP levels based on volatility. Built-in performance tracking shows win/loss stats, PP1/PP2 hits, and success rates all updated live. Key Features: Buy/Sell signals with adaptive volatility bands Real-time TP/SL/DP levels based on ATR Built-in MA Filter with optional ATR/StdDev volatility Performance stats panel (Success, Profit/Loss, PP1/PP2) Alerts via popup, sound, push, or email Cu
TrendProMaster
Temirlan Kdyrkhan
MasterTrend Indicator for MT5 A powerful trend-following and signal-evaluation tool MasterTrend   is a custom MT5 indicator that combines Moving Averages and ATR-based risk/reward logic to generate clear buy/sell signals. It visualizes dynamic SL/TP levels, evaluates past trade outcomes, and displays win/loss statistics in a clean on-chart panel. Key features include: Buy/Sell signals based on MA crossovers ATR-based SL/TP1/TP2/TP3 levels with visual lines and labels Signal outcome tracking wit
ScalpPoint
Temirlan Kdyrkhan
ScalpPoint is a powerful trading companion designed to generate high-probability entry signals with dynamic TP/SL/DP levels based on volatility. Built-in performance tracking shows win/loss stats, PP1/PP2 hits, and success rates — all updated live. Key Features: Buy/Sell signals with adaptive volatility bands Real-time TP/SL/DP levels based on ATR Built-in MA Filter with optional ATR/StdDev volatility Performance stats panel (Success, Profit/Loss, PP1/PP2) Alerts via popup, sound, push, or emai
MasterTrend
Temirlan Kdyrkhan
MasterTrend Indicator for MT5 A powerful trend-following and signal-evaluation tool MasterTrend   is a custom MT5 indicator that combines Moving Averages and ATR-based risk/reward logic to generate clear buy/sell signals. It visualizes dynamic SL/TP levels, evaluates past trade outcomes, and displays win/loss statistics in a clean on-chart panel. Key features include: Buy/Sell signals based on MA crossovers ATR-based SL/TP1/TP2/TP3 levels with visual lines and labels Signal outcome tracking wit
ARICoins
Temirlan Kdyrkhan
ARICoin is a powerful trading companion designed to generate high-probability entry signals with dynamic TP/SL/DP levels based on volatility. Built-in performance tracking shows win/loss stats, PP1/PP2 hits, and success rates all updated live. Key Features: Buy/Sell signals with adaptive volatility bands Real-time TP/SL/DP levels based on ATR Built-in MA Filter with optional ATR/StdDev volatility Performance stats panel (Success, Profit/Loss, PP1/PP2) Alerts via popup, sound, push, or email Cust
AriX
Temirlan Kdyrkhan
1 (4)
AriX Indicator for MT5 A powerful trend-following and signal-evaluation tool AriX is a custom MT5 indicator that combines Moving Averages and ATR-based risk/reward logic to generate clear buy/sell signals. It visualizes dynamic SL/TP levels, evaluates past trade outcomes, and displays win/loss statistics in a clean on-chart panel. Key features include: Buy/Sell signals based on MA crossovers ATR-based SL/TP1/TP2/TP3 levels with visual lines and labels Signal outcome tracking with real-time stat
The Zain GOLD indicator
Haitham Gamal Abdelnaser Mohamed
Specializing in (All brokers supported): Professional Trading Tools Want the same tools used by professional traders? Get them now and start dominating the markets! Join our premium communities for free: Specializing in (All brokers supported): Gold (XAUUSD) - Unmatched accuracy Forex Pairs - Comprehensive global market coverage Binary Options - Highly accurate signals ️ Synthetic Derivatives - Trade pairs using Drive Cryptocurrencies - Professional cryptocurrency trad
CGE Trading Suite
Carl Gustav Johan Ekstrom
5 (2)
Institutional-Grade Analytics for MT5 C GE Trading Suite delivers the analytical edge typically reserved for professional trading desks. The platform integrates a full suite of analytical tools into one seamless workflow: dynamic grid mapping, liquidity behavior analysis, ECM, trend lines, MIDAS, trade cycles, and directional channel projections. Together, these provide a unified view of market structure and momentum. Directional clarity is further enhanced by the capital flow index, which meas
Big Player Range
Thalles Nascimento De Carvalho
5 (3)
BigPlayerRange – MT5 최고의 지표 BigPlayerRange 는 MetaTrader 5에서 미니 인덱스와 미니 달러를 위한 최고의 지표 로 평가받고 있습니다. 이 도구는 주요 기관 투자자들의 전략적 영역을 강조하여 높은 정확도의 기관 기술 분석을 제공합니다. BigPlayerRange 사용법: 이 지표는 매수 구간(녹색선)과 매도 구간(빨간선)을 표시합니다. 가격이 이 구간 밖에서 마감되면 추세 움직임이 예상됩니다. 녹색선 위에서 마감: 강한 매수세와 상승 추세 가능성. 빨간선 아래에서 마감: 매도 압력과 하락 가능성. 범위 내에서 마감: 횡보 시장, 돌파 신호 대기. 주요 혜택: 기관 투자자 영역 매핑: 주요 투자자들의 활동 구간을 식별합니다. 자동 목표 지점 산출: 거래 종료에 적합한 목표 지점을 제공합니다. 풀백 분석: 리스크 관리를 위한 가격 반등 가능성 평가. 활용 방법: BigPlayerRange와 함께 Imba
MetaTrader 5용 스마트 다층 브레이크아웃 및 풀백 탐지기 "스마트하고, 간단하고, 빠르게!" 고확률 브레이크아웃 진입을 놓치는 것에 지치셨나요? 여러 차트를 몇 시간씩 스캔하면서 브레이크아웃을 추세 방향과 통화 모멘텀에 맞추려고 하지만 — 결국 움직임을 놓치고 마나요? Break Pullback은 하나의 지표로 이 모든 문제를 해결합니다. Break Pullback이란 무엇인가요? Break Pullback은 시장 구조, 브레이크아웃, 추세 지속 설정을 거래하는 트레이더를 위해 특별히 설계된 전문가급 MetaTrader 5 지표입니다. 실시간으로 여러 통화 쌍에 걸쳐 Break와 Pullback 형성을 자동으로 감지하고 — 세 가지 확인 레이어를 통해 모든 신호를 필터링합니다: 구조적 브레이크아웃 탐지 — 차트의 주요 브레이크 레벨 식별 HTF 일봉 바이어스 — 진입을 지배적인 일봉 추세 방향에 맞춤 통화 강도 지수 — 쌍을 이룬 통화 간의 모멘텀 불균형 확인 결과: 오
Gold Xausd Hunter
Metin Erkamoglu
5 (1)
MATADOR GOLD XAUUSD M5 Scalp Signals for MT5 MATADOR GOLD is a decision-support indicator for MetaTrader 5, designed for traders who analyze short-term Gold movement on the M5 timeframe. The indicator does not open, close, or manage trades automatically. It provides buy and sell signal guidance so the user can make their own trading decisions according to their risk plan, broker conditions, and trade management rules. Main purpose MATADOR GOLD is built to help traders avoid noisy signal flow and
+++++++++++++++++++++++++++++++++++++++++++++++++++++++++++++++++++++++++++++++++++++++++++++++++ +++ Link to EURUSD Only Free Version -->  https://www.mql5.com/en/market/product/156904?source=Unknown +++++++++++++++++++++++++++++++++++++++++++++++++++++++++++++++++++++++++++++++++++++++++++++++++ Hallo Trader, This is a traditional GANN & FIBONACCI strategy based on detection of an impulsive move in the opposite direction. This is called a Breakout. At the moment of Breakout, the indicator draw
Btcusd Pro
Metin Erkamoglu
BTCUSD PRO Signal Solution for MT5 BTCUSD PRO is a decision-support indicator for MetaTrader 5, designed for traders who analyze BTCUSD or BTCUSD# with a structured signal workflow. The product is not an automated trading system. It does not open, close, or manage trades automatically. It provides analytical buy and sell signal information and displays a visual trade plan on the chart so the user can make their own trading decisions. Main purpose BTCUSD PRO is designed for traders who prefe
이 위치가 매수에 적합한지 판단하는 데 도움을 줍니다. 이 위치가 매도에 적합한지 판단하는 데 도움을 줍니다. 네 개의 지표가 동시에 바닥에 도달하면 반등 기회를 중점적으로 살펴보시기 바랍니다. 네 개의 지표가 동시에 상단에 위치하면 하락 기회를 중점적으로 살펴보시기 바랍니다. 이 시스템은 중국의 첨단 알고리즘 기술과 고급 수학 모델링 체계를 기반으로 구축되었습니다. 저는 주로 XAUUSD M5 주기에서 이 지표를 사용하며, 이 주기가 가장 좋은 결과를 보여줍니다. 이 지표의 알고리즘과 수학 공식은 매우 복잡하기 때문에 테스트 시 진행 속도가 느릴 수 있습니다. 테스트할 때는 지표가 리페인트되는지, 지연되는지만 확인하시면 됩니다. 정식 버전은 실제 사용 시 더 안정적입니다. 이 지표 시스템은 절대 리페인트하지 않으며 미래 데이터를 사용하지 않습니다. 구매 전에 직접 테스트하고 확인하실 수 있습니다. 이 지표에는 완전히 개인화된 알림 시스템이 포함되어 있으며, 아래 링크를 통해 확인하
ZIVA Signal Intelligence
Hassan Abdullah Hassan Al Balushi
ZIVA Signal Intelligence An Adaptive, Modular Market Intelligence System ZIVA Signal Intelligence is not positioned as a conventional trading indicator. It is a fully integrated, proprietary market intelligence system engineered to deliver structured, high-precision interpretation of price behavior within a controlled analytical environment. Developed through an independent architectural approach, ZIVA does not rely on, derive from, or replicate existing indicators. It represents a standalone
SunSignal ML — AI Gold Signals with Multi-Timeframe Confluence SunSignal ML is an advanced AI-powered signal indicator purpose-built for XAUUSD gold trading. It combines a proprietary adaptive trend algorithm with six machine learning models trained on confirmed price pivots to produce high-confidence entry signals with multi-timeframe validation. The indicator runs efficiently on M1, M5 and M15 timeframes and is designed for traders who want precision entries guided by data rather than guesswor
FX Analysis
Lee Teik Hong
FX Analysis is an all-in-one MT5 indicator dashboard that combines eight analytical tools in a single panel, helping traders identify high-probability setups without switching between charts or indicators. Designed for standard forex pairs on MetaTrader 5. Best results on M15 - H4 timeframes when all components are used together as part of the included workflow. Components Volatility Analyzer Displays historical average movement by hour and by day of the week. A real-time Pip Balance shows the
IVISTscalp5
Vadym Zhukovskyi
5 (6)
[iVISTscalp5]: 시간을 통한 시장 행동 연구소 TLV Framework | Liquidity Activation Points ⸻ 개요 iVISTscalp5는 VISTmany 프로젝트 내에서 개발된 다중 레벨 타이밍 및 가격 구조 인디케이터입니다. 이 시스템은 Liquidity Activation Points(타이밍)를 통해: 움직임이 발생하는 시간 방향 가격 움직임의 범위 를 예측합니다. iVISTscalp5 인디케이터는 기본 설정만으로도 모든 금융상품에 사용할 수 있습니다. ⸻ 실질적 가치 iVISTscalp5는 일반적인 기술적 지표로 만들어진 것이 아닙니다. 개발의 핵심 아이디어는 다음과 같습니다. 누구나 시간을 통해 시장 행동을 연구할 수 있도록 하는 것. ⸻ Time Language VISTmany (TLV) — 프로젝트의 핵심 개념 t(p) t(p)는 타이밍이 활성화되는 가격 레벨입니다. ⸻ p(p) p(
VTrende Pro
Andrii Diachenko
5 (1)
VTrende Pro - MTF indicator for trend trading with a display panel for MT5 *** Videos can be translated into any language using subtitles (video language - Russian) Although the signals of the VTrende Pro indicator can be used as signals of a full-fledged trading system, it is recommended to use them in conjunction with the Bill Williams TS. VTrende Pro is an extended version of the VTrende indicator. Difference between Pro version and VTrende: - Time zones - Signal V - signal 1-2 waves -    S
Red and Green Light – Intelligent Trading Signal Indicator Product Overview Red and Green Light is a professional trading signal indicator based on the multi-stage T3 smoothing algorithm. It integrates a visual traffic light system, intelligent signal recognition, risk alerts, and multiple notification features. Whether you're a manual trader or an Expert Advisor (EA) developer, this indicator helps you capture market opportunities with greater precision and effectively avoid the risks of
Pan PrizMA CD Phase
Aleksey Panfilov
The Expert Advisor and the video are attached in the Discussion tab . The robot applies only one order and strictly follows the signals to evaluate the indicator efficiency. Pan PrizMA CD Phase is an option based on the Pan PrizMA indicator. Details (in Russian). Averaging by a quadric-quartic polynomial increases the smoothness of lines, adds momentum and rhythm. Extrapolation by the sinusoid function near a constant allows adjusting the delay or lead of signals. The value of the phase - wave s
Классификатор силы тренда. Показания на истории не меняет. Изменяется классификация только незакрытого бара. По идее подобен полной системе ASCTrend, сигнальный модуль которой, точнее его аппроксимация в несколько "урезанном" виде, есть в свободном доступе, а также в терминале как сигнальный индикатор SilverTrend . Точной копией системы ASCTrend не является. Работает на всех инструментах и всех временных диапазонах. Индикатор использует несколько некоррелируемых между собой алгоритмов для класси
FFx Universal Strength Meter PRO is more than a basic strength meter. Instead of limiting the calculation to price, it can be based on any of the 19 integrated strength modes + 9 timeframes. With the FFx USM, you are able to define any period for any combination of timeframes. For example, you can set the dashboard for the last 10 candles for M15-H1-H4… Full flexibility! Very easy to interpret... It gives a great idea about which currency is weak and which is strong, so you can find the best pai
The FFx Universal MTF alerter shows on a single chart all the timeframes (M1 to Monthly) with their own status for the chosen indicator. 9 indicators mode (MACD-RSI-Stochastic-MA-ADX-Ichimoku-Candles-CCI-PSAR). Each can be applied multiple times on the same chart with different settings. Very easy to interpret. Confirm your BUY entries when most of the timeframes are showing green color. And confirm your SELL entries when most of the timeframes are showing red color. 2 Alert Options : input to s
FFx Watcher Pro MT5
Eric Venturi-Bloxs
The FFx Watcher PRO is a dashboard displaying on a single chart the current direction of up to 15 standard indicators and up to 21 timeframes. It has 2 different modes: Watcher mode: Multi Indicators User is able to select up to 15 indicators to be displayed User is able to select up to 21 timeframes to be displayed Watcher mode: Multi Pairs User is able to select any number of pairs/symbols User is able to select up to 21 timeframes to be displayed This mode uses one of the standard indicators
FFx Patterns Alerter gives trade suggestions with Entry, Target 1, Target 2 and StopLoss .... for any of the selected patterns (PinBar, Engulfing, InsideBar, OutsideBar) Below are the different options available: Multiple instances can be applied on the same chart to monitor different patterns Entry suggestion - pips to be added over the break for the entry 3 different options to calculate the SL - by pips, by ATR multiplier or at the pattern High/Low 3 different options to calculate the 2 TPs -
FFx Basket Scanner MT5
Eric Venturi-Bloxs
MetaTrader 4 version available here : https://www.mql5.com/en/market/product/24881 FFx Basket Scanner is a global tool scanning all pairs and all timeframes over up to five indicators among the 16 available. You will clearly see which currencies to avoid trading and which ones to focus on. Once a currency goes into an extreme zone (e.g. 20/80%), you can trade the whole basket with great confidence. Another way to use it is to look at two currencies (weak vs strong) to find the best single pairs
ClassicSBA
Umri Azkia Zulkarnaen
this indicator very simple and easy if you understand and agree with setup and rule basic teknical sba you can cek in link : please cek my youtube channel for detail chanel : an for detail info  contact me  basicly setup buy (long) for this indicator is Magenta- blue and green candle or magenta - green  and green candlestik and for setup sell (short) is Black - yellow - and red candle or black - red  and red candlestik
제작자의 제품 더 보기
LongTerm
Edoardo Centorame
5 (1)
LongTerm은 중장기 trend의 힘과 품질을 해석하도록 설계된 방향성 분석 지표이며, long oriented 분석에 특정 초점을 둡니다. 이는 진입 지표도 운영 timing 도구도 아니며, 단기 변동의 전형적인 노이즈를 줄이면서 시장이 long trend에 유리하거나 불리한 조건을 제공하는 시점을 트레이더가 이해하도록 돕기 위해 설계된 도구입니다. 목표 LongTerm은 다음을 위해 만들어졌습니다: 강하고 구조화된 long trends 식별 확장, 둔화 및 소진 단계 구분 지배적인 방향성 맥락의 명확한 해석 제공 이는 swing trading 및 long term 분석 지향 트레이더에게 이상적인 도구입니다. 색상 및 시장 조건 해석 LongTerm은 long trend의 다양한 단계를 즉시 읽을 수 있도록 설계된 색상 구조를 사용하며, 시장의 최상의 조건과 최악의 조건을 명확하게 강조합니다. 녹색 선 양의 기울기이며 파란색 선 위 이 구성은 최상의 조건을 나타냅니다. Long
FREE
Multi-Timeframe Alignment PRO는 여러 시간대를 동시에 분석하여 시장의 정렬 상태를 파악하고, 이 정보를 명확하고 시각적이며 쉽게 해석할 수 있는 퍼센트 값으로 변환하도록 설계된 고급 지표입니다 이 지표의 목적은 간단합니다: 여러 시간대가 같은 방향으로 움직이고 있는 순간을 파악하여 트레이딩 의사결정의 품질을 높이는 것입니다 이 PRO 버전은 기본 버전의 단순한 그래픽 확장이 아니라, 더 깊이 있는 분석, 더 높은 제어력, 그리고 실제 전문적인 사용을 위해 설계된 지능형 알림 시스템을 제공합니다. 멀티 타임프레임 정렬이란 무엇인가 (쉽게 설명) 각 시간대는 서로 다른 이야기를 들려줄 수 있습니다. 짧은 시간대는 상승 추세일 수 있고, 중간 시간대는 중립, 긴 시간대는 하락 추세일 수 있습니다. 여러 시간대가 같은 이야기를 들려줄 때, 시장은 더 질서정연해지고 읽기 쉬워집니다. 이 지표는 선택한 시간대들이 LONG, SHORT 또는 FLAT 상태에서 얼마나 정렬
Trend Direction Filter: 우리는 이것을 시장의 지배적인 방향을 식별하도록 설계된 전문 지표로 정의할 수 있으며, 트레이더가 전체적인 맥락을 이해하고 더 의식적으로 운영하도록 돕습니다. 이것은 진입 지표가 아니라, trend의 구조를 강조하고 시장 노이즈의 영향을 줄이기 위해 설계된 고급 방향 필터입니다. 작동 방식 지표는 발전된 smoothing 구조를 통해 가격 행동을 분석하며, 다음을 구분할 수 있습니다: 명확하게 정의된 방향성 단계 둔화 또는 전환 단계 시장의 indecision 단계 그 결과는 우세한 방향에 대한 명확하고 안정적인 표현이며, 운영할 맥락을 평가하는 데 유용합니다. 시각적 해석 Trend Direction Filter는 단순하지만 매우 정보가 풍부한 그래픽 표현을 사용합니다: 진한 녹색 선 시장의 주요 방향을 나타냅니다. 위쪽으로 기울어져 있으면 진행 중인 상승 구조를 나타내며, 기울기를 잃으면 추진력의 약화를 신호합니다. 녹색 점선 상승 추세
FREE
Trend Sniper Follow
Edoardo Centorame
Trend Sniper Follow 추세의 명확성, 구조 및 통제 Trend Sniper는 중장기 추세에 대한 명확하고 질서 있으며 노이즈가 적은 해석을 제공하도록 설계된 추세 분석 지표입니다. 주요 강점 깨끗하고 즉각적인 추세 해석 단순하지만 강력한 계층 구조 차트 위의 시각적 과부하 없음 Daily, Weekly 및 Monthly에 이상적 swing trading 및 trend following에 완벽 감정적 해석을 피하면서 시장 맥락에 맞춰 유지하는 데 도움 Trend Sniper Follow는 운영 타이밍 도구가 아니며 진입 또는 청산 신호를 제공하지 않습니다. 시장의 구조를 예측하는 것이 아니라 이해하고자 하는 사람을 위해 설계되었습니다. 어디서 그리고 어떻게 사용하는가 Trend Sniper Follow는 가격 차트에 직접 적용됩니다 가격과 같은 창에서 작동합니다 다른 중첩 지표와 함께 사용하도록 설계되지 않았습니다 이 선택은 전문적인 추세 분석에 이상적인 깨끗하고 읽기
Zeta Trend
Edoardo Centorame
Zeta Trend 동적 타이밍이 있는 추세선 지표 Zeta Trend는 빠른 추세선과 느린 추세선을 자동으로 그리며, 추가 보조 지표에서 파생된 타이밍 신호와 결합하는 고급 기술 지표입니다. 자동 매수 또는 매도 신호를 생성하지 않습니다. 모든 선과 지표는 트레이더에게 시장 방향과 잠재적인 추세 변화를 해석하는 데 도움이 되는 시각적 도구를 제공하기 위해 계산됩니다. 핵심 사항: 동적 추세선: Zeta Trend는 빠른 추세선과 느린 추세선을 사용하여 가격의 주요 방향과 보조 방향을 강조합니다. Zeta Period라고 불리는 주요 주황색 선은 장기 기준 추세를 나타냅니다. 빠른 선은 더 빠르고 순간적인 움직임 신호를 나타내며, 느린 선은 기본 추세를 보여줍니다. 방향 감지: 선들의 조합은 시장 단계를 식별할 수 있게 합니다: 가격이 기준선 위에 있고 빠른 선이 녹색 확인된 상승 단계 가격이 기준선 아래에 있고 느린 선이 빨간색 확인된 하락 단계 파란색 또는 흰색 선 가능한 lon
Directional Force Histogram DFH는 시장 상태를 반영하고 트레이더가 방향성 압력, 움직임의 힘, 둔화 또는 전환 단계를 즉시 해석할 수 있도록 설계된 히스토그램 지표입니다. DFH는 자동 매수 또는 매도 신호를 제공하지 않습니다. 그 목적은 운영적 맥락을 제공하여 의사결정의 질과 포지션 관리를 개선하는 것입니다. DFH가 측정하는 것 상승 압력과 하락 압력 움직임의 강도 둔화와 추진력 상실 전환 및 중립 단계 추세의 품질과 성숙도 정보는 읽기 쉽고 재량 트레이딩에 적합한 색상 히스토그램으로 표시됩니다. 색상과 막대 동역학의 해석 Directional Force Histogram은 시장 상태를 설명하기 위해 색상과 막대의 움직임을 사용합니다. 증가하는 녹색 막대 상승 압력 증가 점진적으로 증가하는 녹색 막대는 상승 압력이 확장되고 있음을 나타냅니다. 시장은 좋은 참여와 함께 상승 방향으로 가속하고 있습니다. 일반적인 사용: long 포지션 유지에 유리한 맥락 증
Market Pulse Dual
Edoardo Centorame
Market Pulse Colored Dual 이중 시간축 시장 임펄스 지표 동적 색상 Market Pulse Dual 은 RSI CCI 그리고 ATR 기반의 에너지 변동성 조절을 가중 결합하여 시장의 임펄스를 측정하고 시각화하도록 설계된 고급 기술 지표입니다. 이 지표는 주문을 생성하지 않으며 자동 매매를 실행하지 않습니다. 시장 모멘텀의 방향성과 질을 명확하게 요약해 보여주는 시각적 도구이며 특정 색상을 통해 상승 하락 중립 그리고 약화 가능성이나 방향 전환 가능성이 있는 구간을 강조합니다. 출력은 별도의 창에 표시되며 고정 스케일은 100 에서 100 이고 기준선으로 0.0 제로 라인을 사용합니다. 1 지표 구조: 두 개의 Pulse 두 개의 라인 이 지표는 두 개의 색상 라인을 표시합니다. Pulse 1 Market Pulse 더 얇은 라인 width 2 이것은 메인 pulse 로 더 민감하게 반응하며 표준 감도로 모멘텀 방향을 포착하는 데 적합합니다. 사용자가 설정한 기간의
CCI Fixed Dual
Edoardo Centorame
CCI FIXED DUAL이란 무엇인가 CCI FIXED DUAL은 전문적인 Trend Direction Filter로서, 다음 요소를 정확하게 식별하도록 설계되었습니다. 시장의 지배적인 방향 움직임의 구조적 품질 주요 추세와 가속 구간 사이의 일관성 이것은 직접적인 진입 지표가 아닙니다. 이것은 전통적인 오실레이터가 아닙니다. 이것은 컨텍스트 도구로서, 트레이더가 언제 거래해야 하고 언제 거래하지 말아야 하는지를 결정하도록 돕기 위해 설계되었으며, 시장의 노이즈와 해석 오류를 크게 줄여줍니다. CCI FIXED DUAL의 기본 철학 CCI FIXED DUAL이 기반으로 하는 원칙은 단순하지만 강력합니다. 신호는 시장 구조와 일치할 때만 가치가 있습니다. 이러한 이유로 이 지표는 단일 값을 사용하지 않습니다 가격에 충동적으로 반응하지 않습니다 억지 반전 지점을 찾지 않습니다 대신 다음 요소를 기반으로 계층적인 추세 해석을 구축합니다. Typical Price 기반 CCI 서로 다른
Trend Vision PRO 1
Edoardo Centorame
TREND VISION PRO란 무엇인가 TREND VISION PRO는 고급 적응형 멀티 타임프레임 Trend Direction Filter로서, 거의 모든 주요 운용 타임프레임에서 시장 방향에 대한 구조적이고 계층적이며 맥락적인 해석을 자동적이고 일관된 방식으로 제공하도록 설계되었습니다. TREND VISION PRO는 TREND VISION DAILY의 직접적인 진화 버전입니다. DAILY 버전이 단순하고 집중된 해석을 제공하기 위해 의도적으로 D1 차트에만 제한되었다면, PRO 버전은 동일한 철학을 완전한 멀티 타임프레임 구조로 확장하여 차트의 타임프레임에 따라 동적으로 적응할 수 있도록 만들었습니다. 이것은 진입 지표가 아닙니다. 이것은 전통적인 오실레이터가 아닙니다. TREND VISION PRO는 시장이 실제 방향성 우위를 제공하는 시점과, 반대로 거래 활동이 통계적으로 불리한 시점을 정의하기 위해 설계된 전문적인 컨텍스트 도구입니다. 기본 철학 TREND VISION
Ma Extremes
Edoardo Centorame
MA Extremes   는 시장을 더 명확하고 빠르며 체계적으로 읽고자 하는 사람들을 위해 설계된 전문 MetaTrader 인디케이터입니다. 이 도구의 목적은 차트를 완전한 분석 지도처럼 바꾸어 지지선, 저항선, 핵심 구간, 이동평균선, 시각적 확인 요소가 함께 작동하도록 함으로써 트레이더가 가격 움직임을 더 잘 해석하고 시장에서 가장 중요한 구간을 더 분명하게 인식할 수 있도록 돕는 것입니다. MA Extremes   의 핵심은 고급 분석 시스템입니다. 이 시스템은 다양한 시장 요소, 추세 구조, 가격 움직임, 내부 확인 조건을 결합하여 더 깔끔하고 더 선별적인 차트 해석을 제공합니다. 차트에 나타나는 화살표는 임의로 생성되는 것이 아니며 하나의 요소에만 의존하지도 않습니다. 그것들은 전체 시장 상황을 더 깊이 평가한 결과입니다. 이런 구조 덕분에 이 도구는 실제로 주목할 가치가 있는 구간에 집중하고 싶은 트레이더에게 특히 유용합니다. MA Extremes   는 차트 위에 두
Atr Grid EA
Edoardo Centorame
ATR GRID EA 안녕하세요, 트레이더 여러분. ATR GRID EA 는 명확하게 정의된 시장 조건에서 규율, 정밀성, 그리고 구조화된 로직으로 작동하도록 설계된 Expert Advisor입니다. 이 시스템의 강점은 하나의 핵심 요소에 있습니다. 바로   ATR 입니다. ATR GRID EA 는 ATR을 통해 시장 변동성을 해석하는 것을 중심으로 개발되었으며, 이것이 운영 로직의 핵심을 이룹니다. 이 시스템은   강한 추세 가 존재할 때 기회를 찾고, 시장 진입에 가장 적합한 순간을 신중하게 선택합니다. 불필요한 거래를 억지로 수행하기 위해 만들어진 것이 아니라, 시장이 그 구조에 부합하는 조건을 보여줄 때 작동하도록 설계되었습니다. 무작위로 거래하지 않습니다. 시장 노이즈를 쫓지 않습니다. 명확한 기준 없이 진입하지 않습니다. ATR GRID EA는 올바른 시장 환경을 감지할 때만 기다리고, 분석하고, 행동합니다. 운영 구조는   grid   로직에 기반하지만, 한 가지 중요한
필터:
리뷰 없음
리뷰 답변