Cycles Plotter

Cycles Plotter Indicador de Ciclos Personalizáveis com Médias Móveis e Data de Início

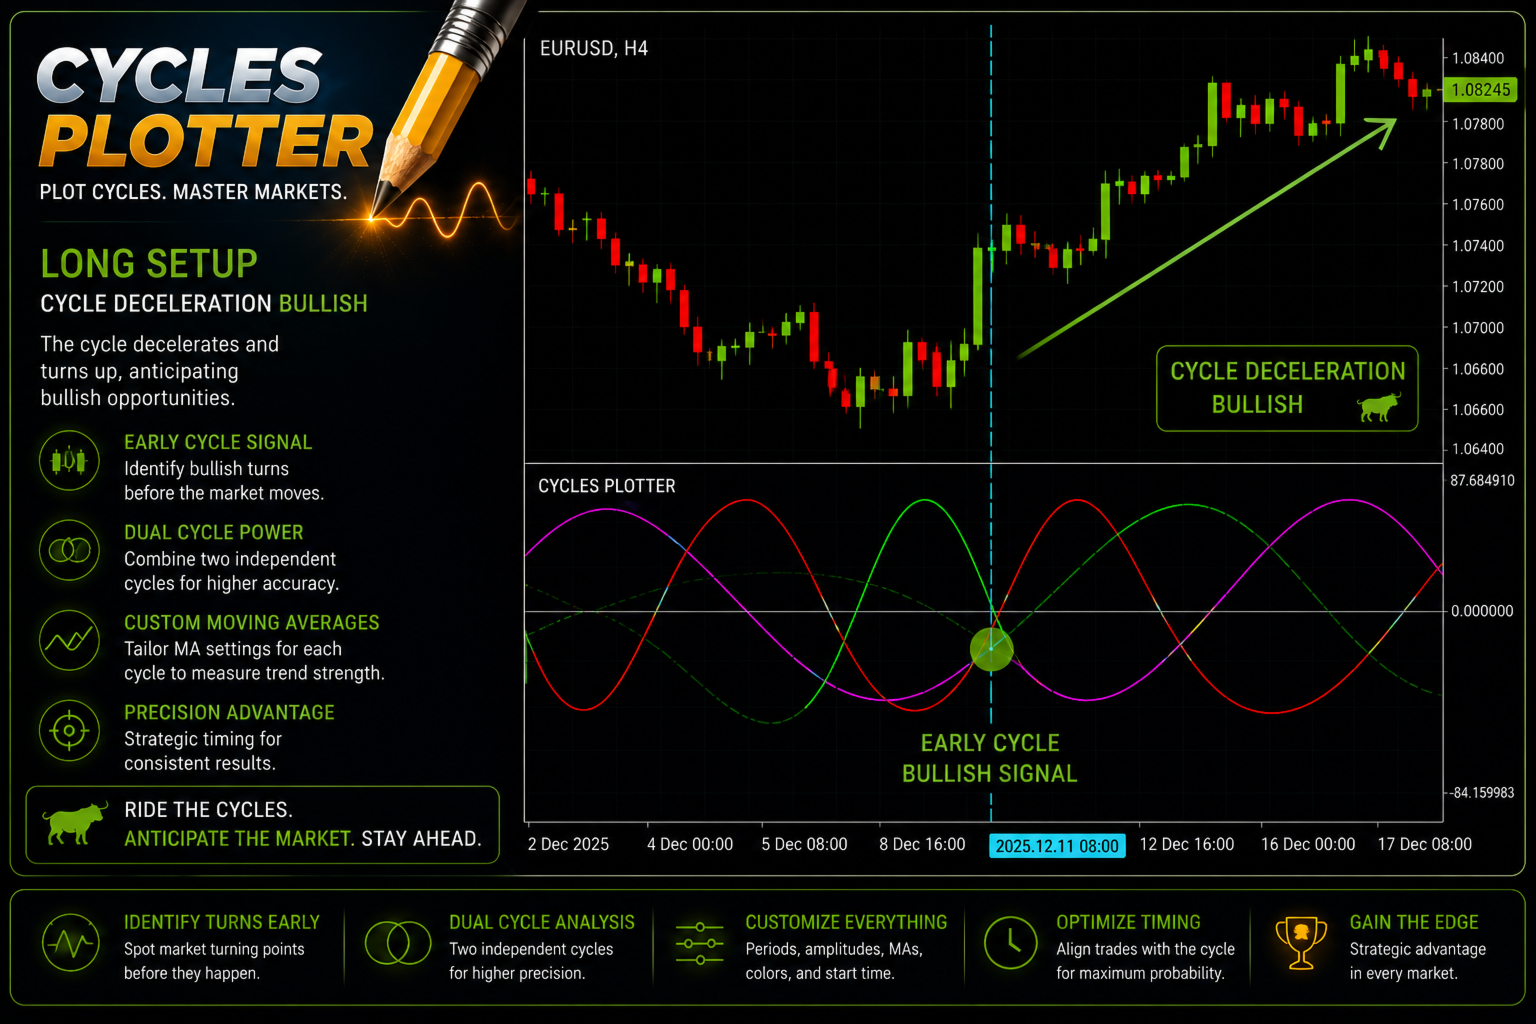
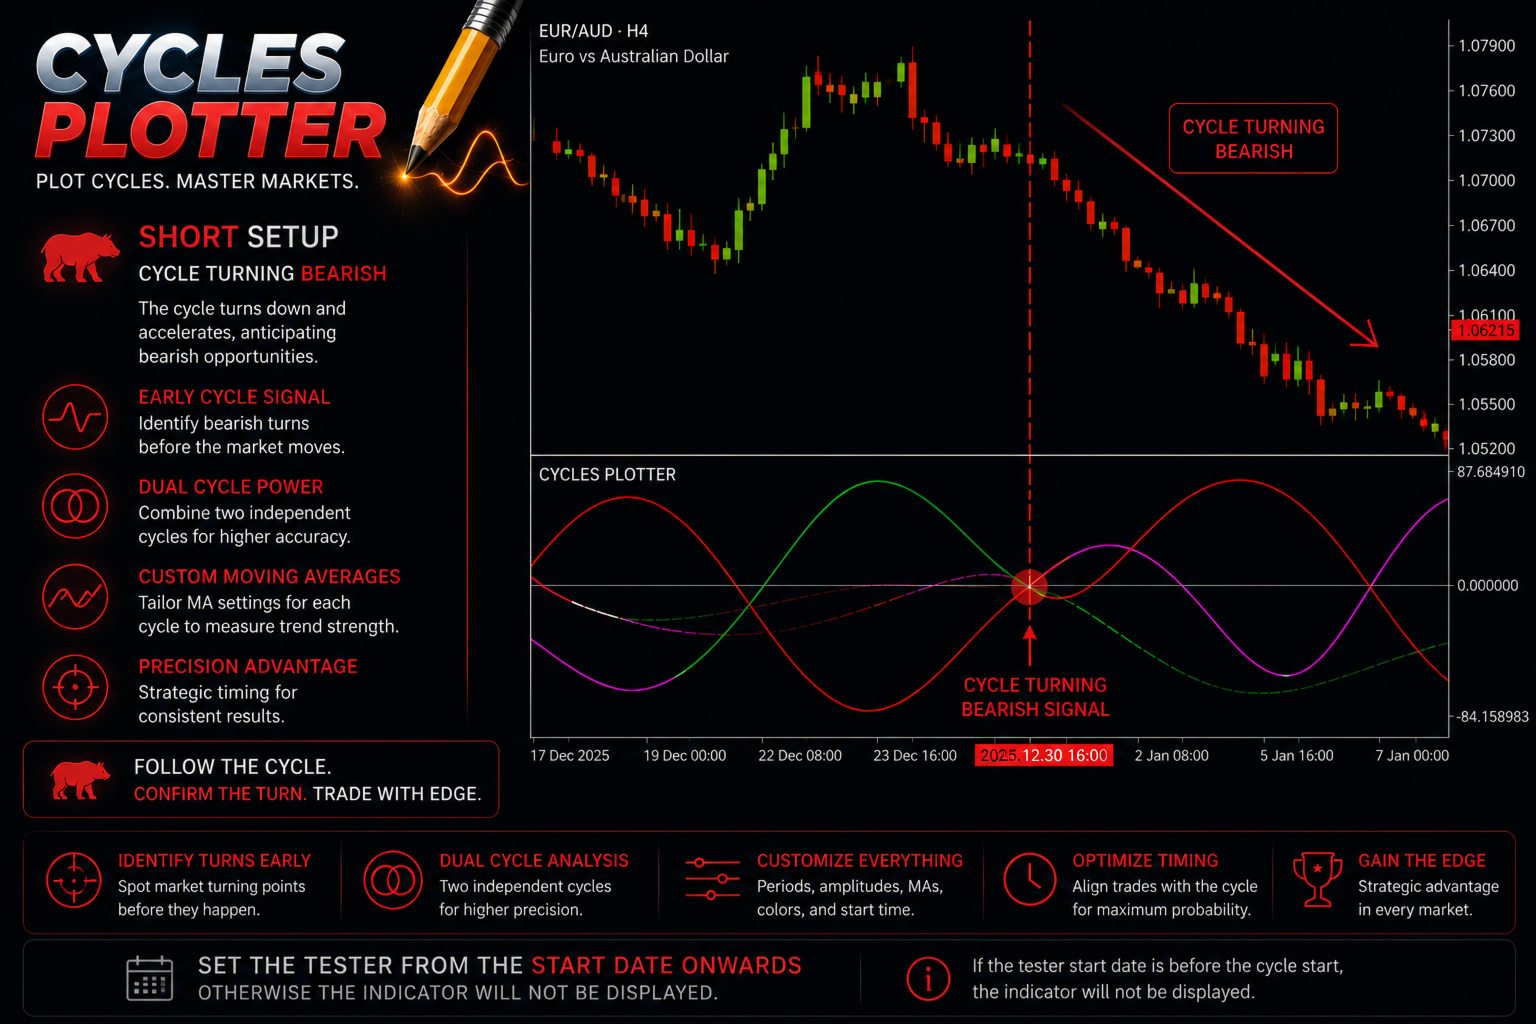
O Cycles Plotter é um indicador técnico avançado que traça dois ciclos sinusoidais completamente personalizáveis, somente mediante input do usuário. Não gera ciclos automaticamente: todos os ciclos são calculados exclusivamente com base nos parâmetros definidos pelo usuário, oferecendo aos traders uma ferramenta visual para estudar as oscilações de preço e as potenciais mudanças de tendência, sem produzir sinais ou previsões automáticas.

Pontos chave:

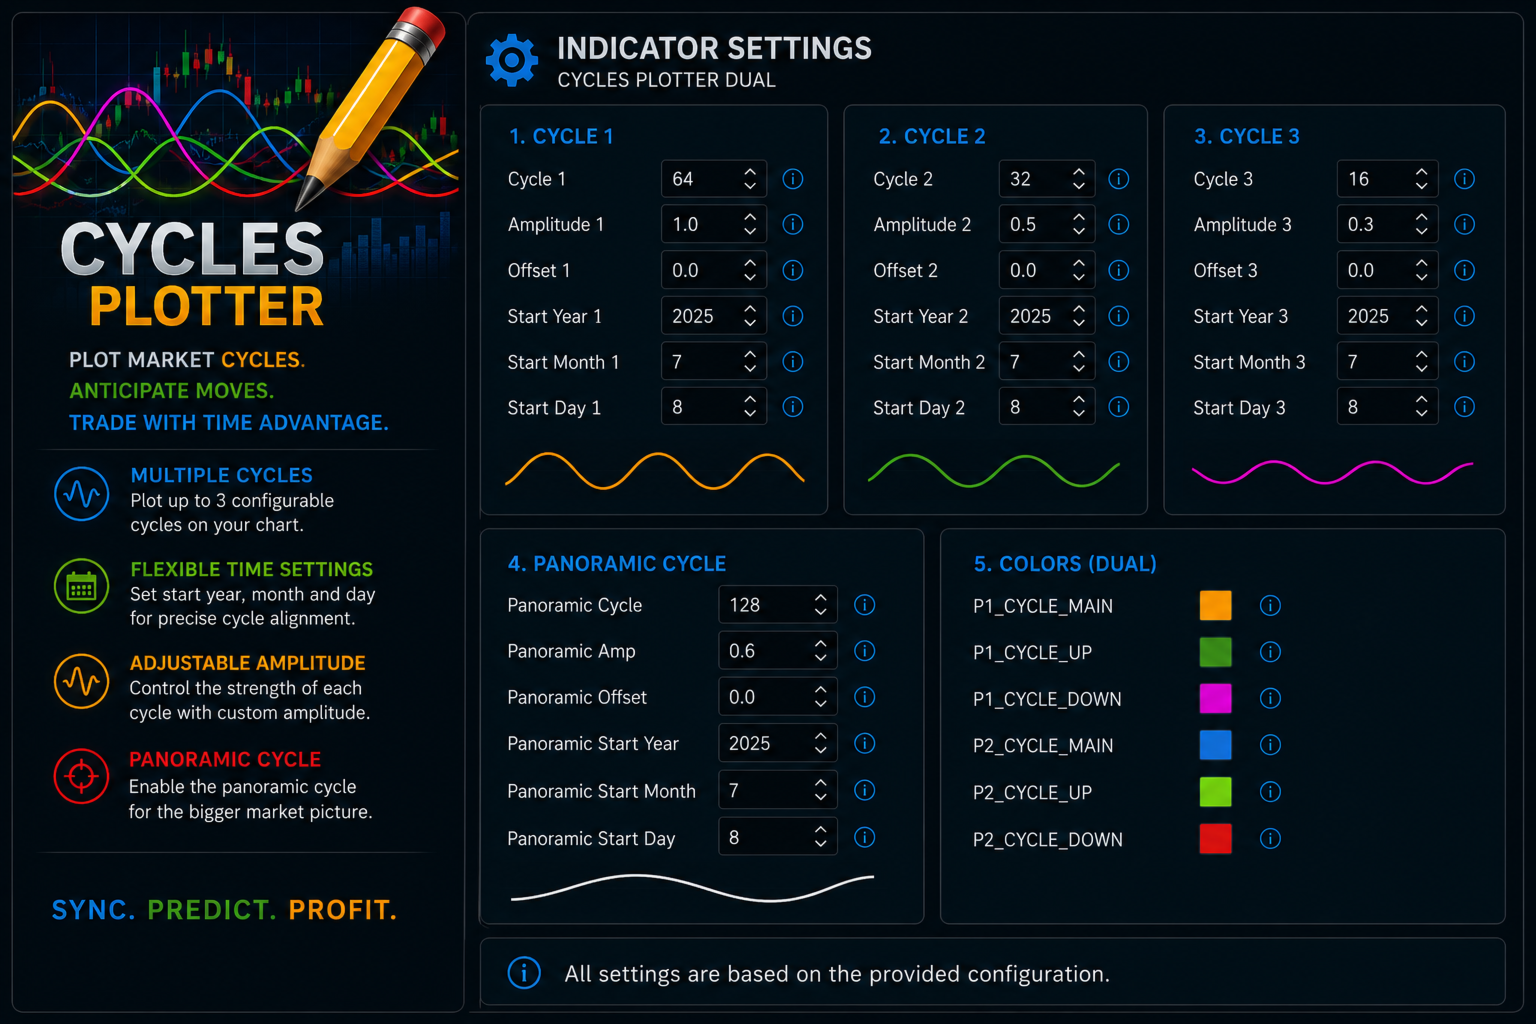
Ciclos definidos pelo usuário: Os ciclos 1 P1 e 2 P2 são totalmente configuráveis pelo usuário. É possível definir comprimento do ciclo, amplitude, médias móveis e data e hora exata de início. Nenhum ciclo é traçado se o usuário não inserir os parâmetros.

Controle da amplitude: Cada ciclo pode ter uma amplitude diferente, permitindo regular a altura das oscilações em relação à média móvel de referência.

Detecção da tendência: As médias móveis rápidas e lentas indicam a direção do ciclo:

Fast MA maior que Slow MA fase altista verde lime

Fast MA menor que Slow MA fase baixista magenta vermelho

Fast MA aproximadamente igual a Slow MA fase lateral flat laranja azul

Traçados dos ciclos: Cada ciclo tem três linhas separadas:

Fase altista verde lime

Fase baixista magenta vermelho

Fase lateral flat laranja azul

Data e hora de início personalizável: É possível definir o momento exato em que cada ciclo começa a ser traçado, para um alinhamento preciso com eventos de mercado ou padrões históricos.

A quem é dirigido?
Este indicador é recomendado particularmente para aqueles que:

estão estudando os ciclos de mercado ou já os estudaram,

querem aprofundar o próprio conhecimento dos ciclos aplicados ao trading,

utilizam os ciclos em seus sistemas de trading ou desejam integrá-los aos próprios sistemas.

O Cycles Plotter é portanto útil tanto para traders experientes que querem analisar os movimentos cíclicos dos preços, quanto para quem está em fase de aprendizagem ou pesquisa. A técnica dos ciclos é uma ferramenta confiável, consolidada há muitos anos, e presente nos maiores sistemas de análise técnica e trading profissional.

Importante: O indicador não gera sinais automáticos nem previsões. Todos os cálculos e os ciclos são baseados exclusivamente nos inputs fornecidos pelo usuário.


Produtos recomendados
CosmiCLab SMC FIBO CosmiCLab SMC FIBO is a professional trading indicator designed for traders who use Smart Money Concepts (SMC), market structure analysis and Fibonacci retracement levels. The indicator automatically detects market swings and builds Fibonacci levels based on the latest impulse movement. It also identifies market structure changes such as BOS (Break of Structure) and CHOCH (Change of Character), helping traders understand the current market direction. CosmiCLab SMC FIBO also pr
Zone Structure Scanner Panel for MT5 Find better setups faster — without scanning charts for hours. The Zone Structure Scanner Panel for MT5 helps you automatically scan multiple symbols, detect key weekly and daily support/resistance zones, read market structure, highlight confluence, and flag H4 rejection-confirmed setups from one powerful panel. Instead of jumping from chart to chart, you get ranked opportunities in one place so you can focus on the setups that matter most. Why it stands
Introducing "X Marks the Spot" – Your Ultimate MetaTrader 5 Indicator for Perfect Trades! Are you tired of the guesswork in trading? Ready to take your MetaTrader 5 experience to a whole new level? Look no further – "X Marks the Spot" is here to revolutionize your trading strategy! What is "X Marks the Spot"? "X Marks the Spot" is not just another indicator – it's your personal trading compass that works seamlessly on all timeframes . Whether you're a beginner or an experienced trader,
MercariaPattern1-2-3 відстежує рух ціни, знаходить трьоххвильові структури 1-2-3 та підсвічує момент, коли сценарій підтверджується пробоєм ключового рівня. MercariaPattern1-2-3 tracks price movement, detects three-leg 1-2-3 structures and highlights the moment when the scenario is confirmed by a key level breakout. Індикатор збирає локальні свінги в компактну фігуру 0–1–2–3 , чекає підтвердженого пробою та будує стрілку входу з готовими рівнями SL/TP. The indicator combines local swings into a
Phantom Edge SMC
Nattapon Chuekamhod
Phantom Edge SMC — The Ultimate Smart Money Indicator for MT5 Tired of manually drawing structures while trading SMC or ICT concepts? Let Phantom Edge SMC do the heavy lifting for you. Key Features Internal & Swing Structure: Automatically detects BOS and CHoCH across two structural levels. Order Blocks (OB): Identifies Internal and Swing OBs with automated mitigation tracking. Equal Highs / Lows: Highlights EQH / EQL to pinpoint Liquidity pools. Fair Value Gaps (FVG): Displays FVGs with
RAD CRITICAL LEVES RAD indicator tracks “Relevant Volume” in real time, identifying accumulation and distribution processes, projecting them in the chart as SUPPORT or RESISTANCE zones. Natural   support   and resistance levels are generated by Volume Accumulation and Distribution processes. As these processes evolve, levels at which the relevant volume in the market place is positioned, become difficult areas to cross upwards or downwards. By using this information, traders can identify very s
Was: $249  Now: $99   Market Profile defines a number of day types that can help the trader to determine market behaviour. A key feature is the Value Area, representing the range of price action where 70% of trading took place. Understanding the Value Area can give traders valuable insight into market direction and establish the higher odds trade. It is an excellent addition to any system you may be using. Inspired by Jim Dalton’s book “Mind Over Markets”, this indicator is designed to suit the
RBreaker
Zhong Long Wu
RBreaker Gold Indicators é uma estratégia de negociação intradiária de curto prazo para futuros de ouro que combina duas abordagens: o seguimento de tendência e as reversões intradiárias. Ela permite capturar lucros durante mercados em tendência e também realizar lucros oportunamente e operar na direção oposta quando o mercado se reverte. Esta estratégia foi classificada por 15 anos consecutivos entre as dez estratégias de negociação mais lucrativas pela revista americana Futures Truth. Ela pos
Este é sem dúvida o indicador de reconhecimento automático de formação de preço harmônico mais completo que você pode encontrar para a MetaTrader Platform. Ele detecta 19 padrões diferentes, leva as projeções de Fibonacci tão a sério quanto você, exibe a Zona de Reversão Potencial (PRZ) e encontra níveis adequados de stop loss e take-profit. [ Guia de instalação | Guia de atualização | Solução de problemas | FAQ | Todos os produtos ] Detecta 19 formações harmônicas de preços diferentes Traça
Master Osi
Norapan Tonphim
OSS ULTIMATE ELITE 2026 – Institutional Smart Money System Stop chasing price. Start trading like smart money.  Why Traders Are Switching to OSS Elite Most indicators react after the move. OSS ULTIMATE ELITE is designed to help you position before the move happens. This is not just another signal tool — it’s a complete trading framework combining momentum, structure, and liquidity behavior.  What Makes This Different? Not lagging signals Not random arrows Not overfitted strategies  Built
Overview The Market Perspective Structure Indicator is a comprehensive MetaTrader indicator designed to provide traders with a detailed analysis of market structure across multiple timeframes. It identifies and visualizes key price action elements, including swing highs and lows, Break of Structure (BOS), Change of Character (CHOCH), internal structures, equal highs/lows, premium/discount levels, previous levels from higher timeframes, and trading session zones. With extensive customization opt
VOLUME PROFILE SAF-XII Análise de Perfil de Mercado Profissional para MT5 (O indicador dos sonhos para traders de Grade/Grid) O QUE É O PERFIL DE VOLUME (VOLUME PROFILE)? O Perfil de Volume é uma ferramenta institucional profissional que exibe a atividade de negociação em níveis de preços específicos, ao contrário dos indicadores de volume tradicionais que mostram o volume ao longo do tempo. Ele revela ONDE a negociação ocorreu dentro da janela de sua escolha, ajudando a identificar: ÁREAS DE V
Chỉ báo này sẽ thông báo cho bạn nếu cấu hình xu hướng thành công. Tín hiệu theo xu hướng không nên được tăng theo, nhưng tín hiệu mua ở mức giá thấp theo mô hình giao dịch thông thường của bạn, hoặc tín hiệu bán ở mức giá tốt, là một lựa chọn rất tốt. Hãy thiết lập nó trên khung thời gian lớn hơn và theo dõi các khung thời gian nhỏ hơn, bám sát các xu hướng chính. Tôi thường thiết lập ba khung thời gian gần nhau nhất và không bao giờ đi ngược tín hiệu của INdicator này. INdicator   này không có
O indicador cria cotações atuais, que podem ser comparadas com as históricas e, com base nisso, fazer uma previsão do movimento dos preços. O indicador possui um campo de texto para navegação rápida até a data desejada. Opções: Símbolo - seleção do símbolo que o indicador exibirá; SymbolPeriod - seleção do período do qual o indicador coletará dados; IndicatorColor - cor do indicador; HorisontalShift - deslocamento das cotações desenhadas pelo indicador pelo número especificado de barras; I
HAS RSI Signal — Indicador de Tendência Profissional com Cálculo de SL/TP O HAS RSI Signal é uma ferramenta de negociação poderosa que combina clássicos comprovados com algoritmos modernos de filtragem de ruído. O indicador analisa o mercado através das velas Heiken Ashi Smoothed (HAS) e do oscilador RSI , fornecendo sinais de entrada claros em momentos de reversão de tendência ou na saída de zonas de sobrecompra/sobrevenda. Principais Vantagens: Filtragem Dupla: O uso do Heiken Ashi Smoothed pe
AutoTrend Pro
Aram Hussein Mohammed
TL Method — Automatic Trendline Detection & Strength Indicator Tired of drawing trendlines manually? TL Method does it for you — automatically detecting, drawing, and scoring trendlines in real time. What it does: Scans up to 1000 bars to find valid support and resistance trendlines Scores each trendline by counting confirmed anchor touches Generates buy/sell signal arrows when price approaches strong trendlines Alerts you via popup, push notification, or sound — with smart cooldown to avoid spa
Multi-Timeframe PO3 Projection Multi-Timeframe PO3 Projection is a clean and practical MetaTrader 5 indicator designed to project multiple higher-timeframe candles directly on your active chart. Instead of switching between H1, H4, D1, and other higher timeframes, this indicator lets you view their live candle structure side by side. It helps traders track the current higher-timeframe open, high, low, close, and candle direction while staying on the chart timeframe they are actively trading. The
O nível Premium é um indicador único com mais de 80% de precisão nas previsões corretas! Este indicador foi testado pelos melhores Especialistas em Negociação por mais de dois meses! O indicador do autor você não encontrará em nenhum outro lugar! A partir das imagens você pode ver por si mesmo a precisão desta ferramenta! 1 é ótimo para negociar opções binárias com um tempo de expiração de 1 vela. 2 funciona em todos os pares de moedas, ações, commodities, criptomoedas Instruções: Assim
O indicador SMC Venom Model BPR é uma ferramenta profissional para os traders que trabalham com o conceito Smart Money (SMC). Identifica automaticamente dois padrões principais no gráfico de preços: FVG   (Fair Value Gap) é uma combinação de três velas, em que existe um gap entre a primeira e a terceira velas. Forma uma zona entre níveis onde não há suporte de volume, o que geralmente leva a uma correção de preço. BPR   (Balanced Price Range) é uma combinação de dois padrões FVG que formam uma
MetaTrader 4 version available here: https://www.mql5.com/en/market/product/25793 FFx Pivot SR Suite PRO is a complete suite for support and resistance levels. Support and Resistance are the most used levels in all kinds of trading. Can be used to find reversal trend, to set targets and stop, etc. The indicator is fully flexible directly from the chart 4 periods to choose for the calculation: 4Hours, Daily, Weekly and Monthly 4 formulas to choose for the calculation: Classic, Camarilla, Fibonac
O 123 Pattern é um dos padrões de gráficos mais populares, poderosos e flexíveis. O padrão é composto por três pontos de preço: fundo, pico ou vale e retração de Fibonacci entre 38,2% e 71,8%. Um padrão é considerado válido quando as quebras de preços além do último pico ou vale, momento em que o indicador traça uma flecha, sobe um alerta, e o comércio pode ser colocado. [ Guia de instalação | Guia de atualização | Solução de problemas | FAQ | Todos os produtos ] Sinais de negociação claros C
Cumulative delta indicator As most traders believe, the price moves under the pressure of market buying or selling. When someone redeems an offer standing in the cup, the deal is a "buy". If someone pours into the bid standing in the cup - the deal goes with the direction of "sale". The delta is the difference between purchases and sales. A cumulative delta - the difference between the cumulative sum of purchases and sales for a certain period of time. It allows you to see who is currently contr
Price Magnet — Price Density and Attraction Levels Indicator Price Magnet is a professional analytical tool designed to identify key support and resistance levels based on statistical Price Density. The indicator analyzes a specified historical period and detects price levels where the market spent the most time. These zones act as “magnets,” attracting price action or forming a structural base for potential reversals. Unlike traditional Volume Profile tools, Price Magnet focuses on price-time d
FX-AIEA Smart Supply and Demand Zone Identification Indicator (Supply and Demand Indicators MT5) Version: 2.51 | Compatible Platform: MetaTrader 5  Why do trades need supply and demand zones? Supply and demand zones are the core manifestation of institutional order flow, reflecting real buying and selling power more accurately than traditional support and resistance. However, manual drawing is not only time-consuming but also highly subjective and prone to missing key areas. FX-AIEA Supp
Potential Reversal Price (PRP) Indicator - Ultimate Sniper Entries for XAUUSD Discounted   Price   !!     Secure your lifetime access   now   before it switches to   subscription-only ! Welcome to the Potential Reversal Price (PRP) Indicator , your ultimate trading tool designed to catch high-probability market reversals with extreme precision. Built for serious traders who demand accuracy, the PRP Indicator combines advanced market structure analysis with momentum exhaustion to pinpoint the exa
The Super Arrow Indicator provides non-repainting buy and sell signals with exceptional accuracy. Key Features No repainting – confirmed signals remain fixed Clear visual arrows: green for buy, red for sell Real-time alerts via pop-up, sound, and optional email Clean chart view with no unnecessary clutter Works on all markets: Forex, gold, oil, indices, crypto Adjustable Parameters TimeFrame Default:   "current time frame" Function:   Sets the time frame for indicator calculation Options:   Can
Volume Profile Canvas - Professional Volume Profile Indicator for MetaTrader 5 DESCRIPTION Volume Profile Canvas is a professional volume profile indicator for MetaTrader 5 that renders directly on the chart using a high-performance Canvas engine. It calculates and displays the volume distribution across price levels, identifying the Point of Control (POC), Value Area High (VAH) and Value Area Low (VAL) in real time. This is a pure analysis tool. It does not trade. It gives you an instant vi
Footprint — é um indicador para análise de order flow e volume. Ele ajuda a identificar a estrutura do mercado no nível de clusters, encontrar zonas-chave com alta atividade e trabalhar com filtros diretamente no gráfico, sem a necessidade de abrir constantemente a janela de configurações. Recursos do indicador Footprint gráfico de clusters Bid x Ask, Delta; painel de controle no gráfico; controles deslizantes (sliders) para ajuste de filtros; Absorption; Initiative; Stacked Imbalances; Big Trad
Looking for reliable levels on a price chart? Already tired of searching for similar indicators? Are the levels not working out as they should? Then this is the indicator for you. Volume Prices Universal is a reliable indicator of horizontal volumes. What does it show? First of all, the main idea of ​​the indicator is to display at which price mark the price has been for the longest time. Thus, the display of price volumes on the price chart is formed. With the help of which you can very simpl
Os compradores deste produto também adquirem
PrimeScalping
Temirlan Kdyrkhan
PrimeScalping is a powerful trading companion designed to generate high-probability entry signals with dynamic TP/SL/DP levels based on volatility. Built-in performance tracking shows win/loss stats, PP1/PP2 hits, and success rates — all updated live. Key Features: Buy/Sell signals with adaptive volatility bands Real-time TP/SL/DP levels based on ATR Built-in MA Filter with optional ATR/StdDev volatility Performance stats panel (Success, Profit/Loss, PP1/PP2) Alerts via popup, sound, push, or e
ARIPoint
Temirlan Kdyrkhan
1 (1)
ARIPoint is a powerful trading companion designed to generate high-probability entry signals with dynamic TP/SL/DP levels based on volatility. Built-in performance tracking shows win/loss stats, PP1/PP2 hits, and success rates all updated live. Key Features: Buy/Sell signals with adaptive volatility bands Real-time TP/SL/DP levels based on ATR Built-in MA Filter with optional ATR/StdDev volatility Performance stats panel (Success, Profit/Loss, PP1/PP2) Alerts via popup, sound, push, or email Cu
Detector Inteligente Multicamada de Rompimento e Retração para MetaTrader 5 "Inteligente, Simples e Rápido!" Você está cansado de perder entradas de rompimento de alta probabilidade? Você gasta horas analisando vários gráficos, tentando alinhar rompimentos com a direção da tendência e o momentum das moedas — apenas para perder o movimento? Break Pullback resolve tudo isso em um único indicador. O que é o Break Pullback? Break Pullback é um indicador de nível profissional para MetaTrader 5, des
ARICoins
Temirlan Kdyrkhan
ARICoin is a powerful trading companion designed to generate high-probability entry signals with dynamic TP/SL/DP levels based on volatility. Built-in performance tracking shows win/loss stats, PP1/PP2 hits, and success rates all updated live. Key Features: Buy/Sell signals with adaptive volatility bands Real-time TP/SL/DP levels based on ATR Built-in MA Filter with optional ATR/StdDev volatility Performance stats panel (Success, Profit/Loss, PP1/PP2) Alerts via popup, sound, push, or email Cust
AriX
Temirlan Kdyrkhan
1 (4)
AriX Indicator for MT5 A powerful trend-following and signal-evaluation tool AriX is a custom MT5 indicator that combines Moving Averages and ATR-based risk/reward logic to generate clear buy/sell signals. It visualizes dynamic SL/TP levels, evaluates past trade outcomes, and displays win/loss statistics in a clean on-chart panel. Key features include: Buy/Sell signals based on MA crossovers ATR-based SL/TP1/TP2/TP3 levels with visual lines and labels Signal outcome tracking with real-time stat
The Zain GOLD indicator
Haitham Gamal Abdelnaser Mohamed
Specializing in (All brokers supported): Professional Trading Tools Want the same tools used by professional traders? Get them now and start dominating the markets! Join our premium communities for free: Specializing in (All brokers supported): Gold (XAUUSD) - Unmatched accuracy Forex Pairs - Comprehensive global market coverage Binary Options - Highly accurate signals ️ Synthetic Derivatives - Trade pairs using Drive Cryptocurrencies - Professional cryptocurrency trad
CGE Trading Suite
Carl Gustav Johan Ekstrom
5 (2)
Institutional-Grade Analytics for MT5 C GE Trading Suite delivers the analytical edge typically reserved for professional trading desks. The platform integrates a full suite of analytical tools into one seamless workflow: dynamic grid mapping, liquidity behavior analysis, ECM, trend lines, MIDAS, trade cycles, and directional channel projections. Together, these provide a unified view of market structure and momentum. Directional clarity is further enhanced by the capital flow index, which meas
Euro Escalper
Cristofher Robles
Euro Escalper— Indicador Profissional de Scalping Institucional Euro Escalper e um indicador de trading de alto desempenho projetado para traders que exigem precisao institucional em cada entrada. Funciona em Indices Sinteticos (Deriv), Forex e qualquer ativo disponivel no MetaTrader 5. Combina zonas de liquidez baseadas em Fibonacci, um motor SuperTrend integrado e um painel de controle profissional em tempo real. Vantagens Principais Sem Repintura: As setas de sinal aparecem apenas no fechamen
Big Player Range
Thalles Nascimento De Carvalho
5 (3)
BigPlayerRange — Melhor Indicador para Mini Índice e Mini Dólar | MT5 Descubra o poder do BigPlayerRange , considerado o melhor indicador para mini índice e mini dólar no MetaTrader 5. Esta ferramenta essencial destaca zonas estratégicas de atuação dos grandes players, proporcionando análise técnica institucional com altíssima precisão. Como Funciona na Prática: O BigPlayerRange desenha duas faixas horizontais baseadas em volume institucional: Faixa Verde — Região onde compradores instit
Gold Xausd Hunter
Metin Erkamoglu
5 (1)
MATADOR GOLD XAUUSD M5 Scalp Signals for MT5 MATADOR GOLD is a decision-support indicator for MetaTrader 5, designed for traders who analyze short-term Gold movement on the M5 timeframe. The indicator does not open, close, or manage trades automatically. It provides buy and sell signal guidance so the user can make their own trading decisions according to their risk plan, broker conditions, and trade management rules. Main purpose MATADOR GOLD is built to help traders avoid noisy signal flow and
+++++++++++++++++++++++++++++++++++++++++++++++++++++++++++++++++++++++++++++++++++++++++++++++++ +++ Link to EURUSD Only Free Version -->  https://www.mql5.com/en/market/product/156904?source=Unknown +++++++++++++++++++++++++++++++++++++++++++++++++++++++++++++++++++++++++++++++++++++++++++++++++ Hallo Trader, This is a traditional GANN & FIBONACCI strategy based on detection of an impulsive move in the opposite direction. This is called a Breakout. At the moment of Breakout, the indicator draw
Btcusd Pro
Metin Erkamoglu
BTCUSD PRO Signal Solution for MT5 BTCUSD PRO is a decision-support indicator for MetaTrader 5, designed for traders who analyze BTCUSD or BTCUSD# with a structured signal workflow. The product is not an automated trading system. It does not open, close, or manage trades automatically. It provides analytical buy and sell signal information and displays a visual trade plan on the chart so the user can make their own trading decisions. Main purpose BTCUSD PRO is designed for traders who prefe
Ajuda a determinar se este ponto é adequado para comprar. Ajuda a determinar se este ponto é adequado para vender. Quando os quatro indicadores atingem o fundo ao mesmo tempo, concentre-se nas oportunidades de repique. Quando os quatro indicadores estão simultaneamente no topo, concentre-se nas oportunidades de queda. Este sistema foi desenvolvido com base em tecnologia algorítmica chinesa avançada e em uma estrutura de modelagem matemática de alto nível. Eu uso este indicador principalmente no
ZIVA Signal Intelligence
Hassan Abdullah Hassan Al Balushi
ZIVA Signal Intelligence An Adaptive, Modular Market Intelligence System ZIVA Signal Intelligence is not positioned as a conventional trading indicator. It is a fully integrated, proprietary market intelligence system engineered to deliver structured, high-precision interpretation of price behavior within a controlled analytical environment. Developed through an independent architectural approach, ZIVA does not rely on, derive from, or replicate existing indicators. It represents a standalone
SunSignal ML — AI Gold Signals with Multi-Timeframe Confluence SunSignal ML is an advanced AI-powered signal indicator purpose-built for XAUUSD gold trading. It combines a proprietary adaptive trend algorithm with six machine learning models trained on confirmed price pivots to produce high-confidence entry signals with multi-timeframe validation. The indicator runs efficiently on M1, M5 and M15 timeframes and is designed for traders who want precision entries guided by data rather than guesswor
FX Analysis is an all-in-one MT5 indicator dashboard that combines eight analytical tools in a single panel, helping traders identify high-probability setups without switching between charts or indicators. Designed for standard forex pairs on MetaTrader 5. Best results on M15 - H4 timeframes when all components are used together as part of the included workflow. Components Volatility Analyzer Displays historical average movement by hour and by day of the week. A real-time Pip Balance shows the
IVISTscalp5
Vadym Zhukovskyi
5 (6)
[iVISTscalp5]: Um laboratório para estudar o comportamento do mercado através do tempo TLV Framework | Liquidity Activation Points ⸻ Descrição Geral iVISTscalp5 é um indicador multinível de timings e estrutura de preços desenvolvido dentro do projeto VISTmany. O sistema prevê o tempo, a direção e o alcance do movimento através dos Liquidity Activation Points (timings). O indicador iVISTscalp5 pode ser utilizado com os parâmetros padrão em qualquer instrumento financeiro. ⸻ Valor Prático
Recommended TimeFrame >= H1. 100% Non Repainted at any moment.  Use it carefully, only with Trend Direction. Trading Usage: 2 Variants: as Range System or as BreakOut System (Both Only With Trend Direction)::: (Always use StopLoss for minimise Risk); [1] as Range System: (Recommended) in UP TREND:  - BUY in Blue Line , then if price goes down by 50 points (on H1) open Second BUY.   Close in any Profit you wish: TrailingStop(45 points) or Close when Price touches upper Gold Line. in DOWN TREND
VTrende Pro
Andrii Diachenko
5 (1)
VTrende Pro - MTF indicator for trend trading with a display panel for MT5 *** Videos can be translated into any language using subtitles (video language - Russian) Although the signals of the VTrende Pro indicator can be used as signals of a full-fledged trading system, it is recommended to use them in conjunction with the Bill Williams TS. VTrende Pro is an extended version of the VTrende indicator. Difference between Pro version and VTrende: - Time zones - Signal V - signal 1-2 waves -    S
Red and Green Light – Intelligent Trading Signal Indicator Product Overview Red and Green Light is a professional trading signal indicator based on the multi-stage T3 smoothing algorithm. It integrates a visual traffic light system, intelligent signal recognition, risk alerts, and multiple notification features. Whether you're a manual trader or an Expert Advisor (EA) developer, this indicator helps you capture market opportunities with greater precision and effectively avoid the risks of
The Expert Advisor and the video are attached in the Discussion tab . The robot applies only one order and strictly follows the signals to evaluate the indicator efficiency. Pan PrizMA CD Phase is an option based on the Pan PrizMA indicator. Details (in Russian). Averaging by a quadric-quartic polynomial increases the smoothness of lines, adds momentum and rhythm. Extrapolation by the sinusoid function near a constant allows adjusting the delay or lead of signals. The value of the phase - wave s
Классификатор силы тренда. Показания на истории не меняет. Изменяется классификация только незакрытого бара. По идее подобен полной системе ASCTrend, сигнальный модуль которой, точнее его аппроксимация в несколько "урезанном" виде, есть в свободном доступе, а также в терминале как сигнальный индикатор SilverTrend . Точной копией системы ASCTrend не является. Работает на всех инструментах и всех временных диапазонах. Индикатор использует несколько некоррелируемых между собой алгоритмов для класси
FFx Universal Strength Meter PRO is more than a basic strength meter. Instead of limiting the calculation to price, it can be based on any of the 19 integrated strength modes + 9 timeframes. With the FFx USM, you are able to define any period for any combination of timeframes. For example, you can set the dashboard for the last 10 candles for M15-H1-H4… Full flexibility! Very easy to interpret... It gives a great idea about which currency is weak and which is strong, so you can find the best pai
The FFx Universal MTF alerter shows on a single chart all the timeframes (M1 to Monthly) with their own status for the chosen indicator. 9 indicators mode (MACD-RSI-Stochastic-MA-ADX-Ichimoku-Candles-CCI-PSAR). Each can be applied multiple times on the same chart with different settings. Very easy to interpret. Confirm your BUY entries when most of the timeframes are showing green color. And confirm your SELL entries when most of the timeframes are showing red color. 2 Alert Options : input to s
The FFx Watcher PRO is a dashboard displaying on a single chart the current direction of up to 15 standard indicators and up to 21 timeframes. It has 2 different modes: Watcher mode: Multi Indicators User is able to select up to 15 indicators to be displayed User is able to select up to 21 timeframes to be displayed Watcher mode: Multi Pairs User is able to select any number of pairs/symbols User is able to select up to 21 timeframes to be displayed This mode uses one of the standard indicators
FFx Patterns Alerter gives trade suggestions with Entry, Target 1, Target 2 and StopLoss .... for any of the selected patterns (PinBar, Engulfing, InsideBar, OutsideBar) Below are the different options available: Multiple instances can be applied on the same chart to monitor different patterns Entry suggestion - pips to be added over the break for the entry 3 different options to calculate the SL - by pips, by ATR multiplier or at the pattern High/Low 3 different options to calculate the 2 TPs -
MetaTrader 4 version available here : https://www.mql5.com/en/market/product/24881 FFx Basket Scanner is a global tool scanning all pairs and all timeframes over up to five indicators among the 16 available. You will clearly see which currencies to avoid trading and which ones to focus on. Once a currency goes into an extreme zone (e.g. 20/80%), you can trade the whole basket with great confidence. Another way to use it is to look at two currencies (weak vs strong) to find the best single pairs
ClassicSBA
Umri Azkia Zulkarnaen
this indicator very simple and easy if you understand and agree with setup and rule basic teknical sba you can cek in link : please cek my youtube channel for detail chanel : an for detail info  contact me  basicly setup buy (long) for this indicator is Magenta- blue and green candle or magenta - green  and green candlestik and for setup sell (short) is Black - yellow - and red candle or black - red  and red candlestik
Pendiente de Precio
Cesar Juan Flores Navarro
Indicador en base a la pendiente de la linea de precio, dibuja una línea de color cuando sube a base de los precios que previamente has sido procesados o linealizados, y cuando baja la pendiente la linea linealizada toma otro color. En este caso se a considerado 6 lineas de diferentes procesos desde pendientes largas hacia las cortas, observándose que cuando coincidan las pendientes se produce un máximo o mínimo, lo que a simple vista nos permitirá hacer una COMPRA O VENTA.
WanaScalper
Isaac Wanasolo
1 (1)
A scalping indicator based on mathematical patterns, which on average gives signals with relatively small SL, and also occasionally helps to catch big moves in the markets (more information in the video) This indicator has three main types of notifications: The first type warns of a possible/upcoming signal on the next bar The second type indicates the presence of a ready signal to enter the market/open a position The third type is for SL and TP levels - you will be notified every time price re
Mais do autor
LongTerm
Edoardo Centorame
5 (1)
LongTerm é um indicador de análise direcional projetado para interpretar a força e a qualidade do trend de médio longo prazo, com um foco específico na análise long oriented. Não é um indicador de entrada nem de timing operacional, mas uma ferramenta pensada para ajudar o trader a compreender quando o mercado oferece condições favoráveis ou desfavoráveis para o long trend, reduzindo o ruído típico das oscilações de curto prazo. Objetivos LongTerm nasce para: identificar long trends fortes e estr
FREE
Multi-Timeframe Alignment PRO é um indicador avançado projetado para analisar o alinhamento do mercado em vários timeframes ao mesmo tempo e transformar essas informações em percentuais claros, visuais e fáceis de interpretar O objetivo do indicador é simples: ajudar você a entender quando vários timeframes estão se movendo na mesma direção, aumentando a qualidade das decisões operacionais Esta versão PRO não é uma simples extensão gráfica da versão básica, mas introduz uma análise mais profund
Trend Direction Filter: Podemos defini-lo como um indicador profissional projetado para identificar a direção dominante do mercado, ajudando o trader a compreender o contexto geral e a operar de forma mais consciente. Não se trata de um indicador de entrada, mas de um filtro direcional avançado, estudado para evidenciar a estrutura do trend e reduzir a influência do ruído de mercado. Como funciona O indicador analisa o comportamento do preço através de uma estrutura de smoothing evoluída, capaz
FREE
Trend Sniper Follow Clareza, estrutura e controle da tendência Trend Sniper é um indicador de análise da tendência projetado para oferecer uma leitura clara, ordenada e sem ruído da tendência de médio longo prazo. Principais pontos fortes Leitura da tendência limpa e imediata Estrutura hierárquica simples mas poderosa Nenhuma sobrecarga visual no gráfico Ideal para Daily, Weekly e Monthly Perfeito para swing trading e trend following Ajuda a permanecer alinhado ao contexto de mercado, evitando i
Zeta Trend
Edoardo Centorame
Zeta Trend Indicador de Linhas de Tendência com Timing Dinâmico Zeta Trend é um indicador técnico avançado que traça automaticamente linhas de tendência rápidas e lentas, combinando-as com sinais de timing derivados de indicadores de suporte adicionais. Não produz sinais automáticos de compra ou venda: todas as linhas e indicadores são calculados para oferecer aos traders uma ferramenta visual que facilita a interpretação da direção do mercado e das potenciais mudanças de tendência. Pontos chave
Directional Force Histogram DFH é um indicador de histograma projetado para espelhar o estado do mercado e ajudar o trader a interpretar de forma imediata a pressão direcional, a força do movimento e as fases de desaceleração ou transição. DFH não fornece sinais automáticos de compra ou venda. O seu objetivo é oferecer contexto operacional, melhorando a qualidade das decisões e a gestão da posição. O que mede o DFH Pressão altista e baixista Intensidade do movimento Desacelerações e perda de imp
O que é Market Pulse Colored Dual Indicador de Impulso de Mercado de Duplo Horizonte Cores Dinamicas Market Pulse Dual é um indicador tecnico avançado projetado para medir e visualizar o impulso do mercado atraves de uma combinação ponderada de RSI, CCI e uma modulação de energia volatilidade baseada em ATR. O indicador não gera ordens e não executa trading automatico: é uma ferramenta visual que sintetiza de forma clara a direção e a qualidade do momentum, destacando com cores especificas as co
CCI Fixed Dual
Edoardo Centorame
O que é CCI FIXED DUAL CCI FIXED DUAL é um Trend Direction Filter profissional, projetado para identificar com precisão: a direção dominante do mercado a qualidade estrutural do movimento a coerência entre a tendência principal e as fases de aceleração Não é um indicador de entrada direta. Não é um oscilador clássico. É uma ferramenta de contexto, pensada para ajudar o trader a decidir quando operar e quando NÃO operar, reduzindo drasticamente o ruído e os erros de interpretação. Filosofia básic
O que é TREND VISION PRO TREND VISION PRO é um Trend Direction Filter adaptativo de nível avançado e multi timeframe, projetado para fornecer uma leitura estruturada, hierárquica e contextual da direção do mercado em quase todos os principais timeframes operacionais, de forma automática e coerente. TREND VISION PRO representa a evolução direta de TREND VISION DAILY. Enquanto a versão DAILY foi intencionalmente limitada ao gráfico D1 para oferecer uma leitura simples e focada, a versão PRO estend
Ma Extremes
Edoardo Centorame
MA Extremes   é um indicador profissional para MetaTrader pensado para quem deseja ler o mercado de forma mais clara, rápida e organizada. O seu objetivo é transformar o gráfico em um mapa operacional completo, onde suportes, resistências, áreas-chave, médias e confirmações visuais trabalham juntas para ajudar o trader a interpretar melhor o comportamento do preço e identificar com maior consciência as zonas mais interessantes do mercado. O coração de   MA Extremes   é um sistema de análise avan
Atr Grid EA
Edoardo Centorame
ATR GRID EA Olá trader, apresento-lhe o   ATR GRID EA , um Expert Advisor projetado para operar com disciplina, precisão e lógica estruturada em condições de mercado bem definidas. A força deste sistema está concentrada em um elemento central:   o ATR . O   ATR GRID EA   foi desenvolvido em torno da leitura da volatilidade do mercado por meio do ATR, que representa o coração de sua lógica operacional. O sistema busca oportunidades na presença de uma   forte tendência , selecionando com atenção o
Filtro:
Sem comentários
Responder ao comentário