Cycles Plotter

  • インディケータ
  • Edoardo Centorame
    Edoardo Centorame
    私はプロのトレーダーであり、MT5開発者です。トレーディングおよび意思決定支援のための高度なツール開発に数年の経験があります。市場のトレンドを分析し、トレーディング戦略を改善するためのシステムと視覚的ツールを作成しています。

    私のツールは自動売買シグナルを生成するものではありませんが、経験豊富なトレーダーや初心者の両方に明確で即時のテクニカル分析サポートを提供します。

    戦略、最適化、MT5の高度な取引ツールの使用に関する記事や更新をフォローしてください
  • バージョン: 1.0
  • アクティベーション: 5

Cycles Plotter 移動平均と開始日を備えたカスタマイズ可能なサイクルインジケーター

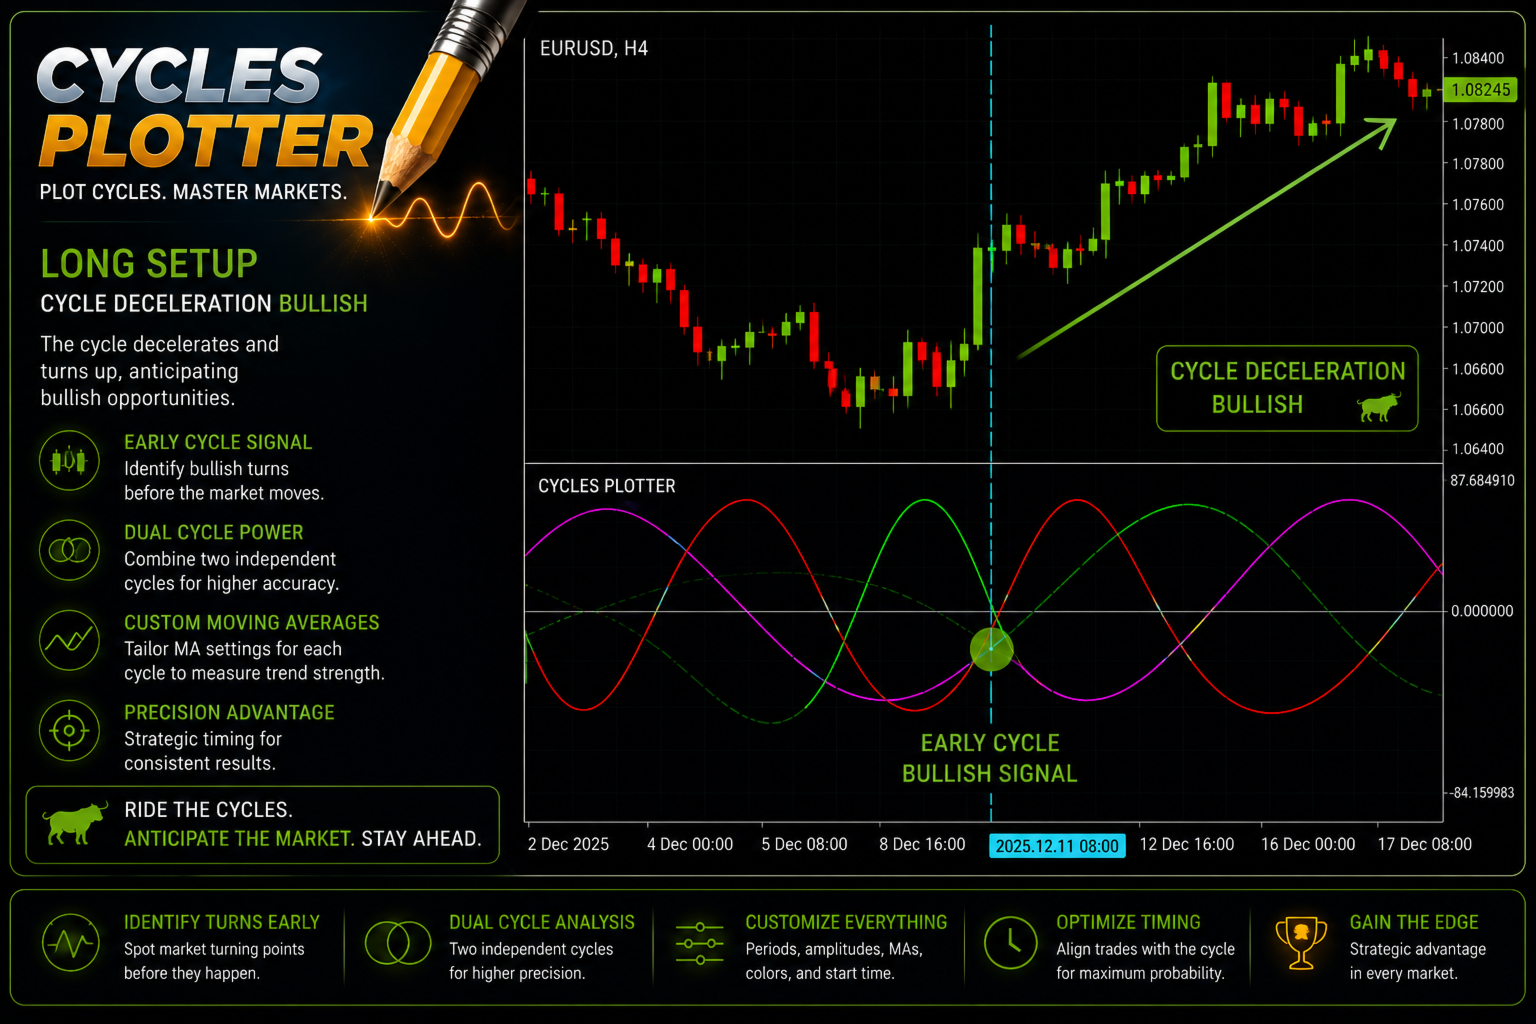
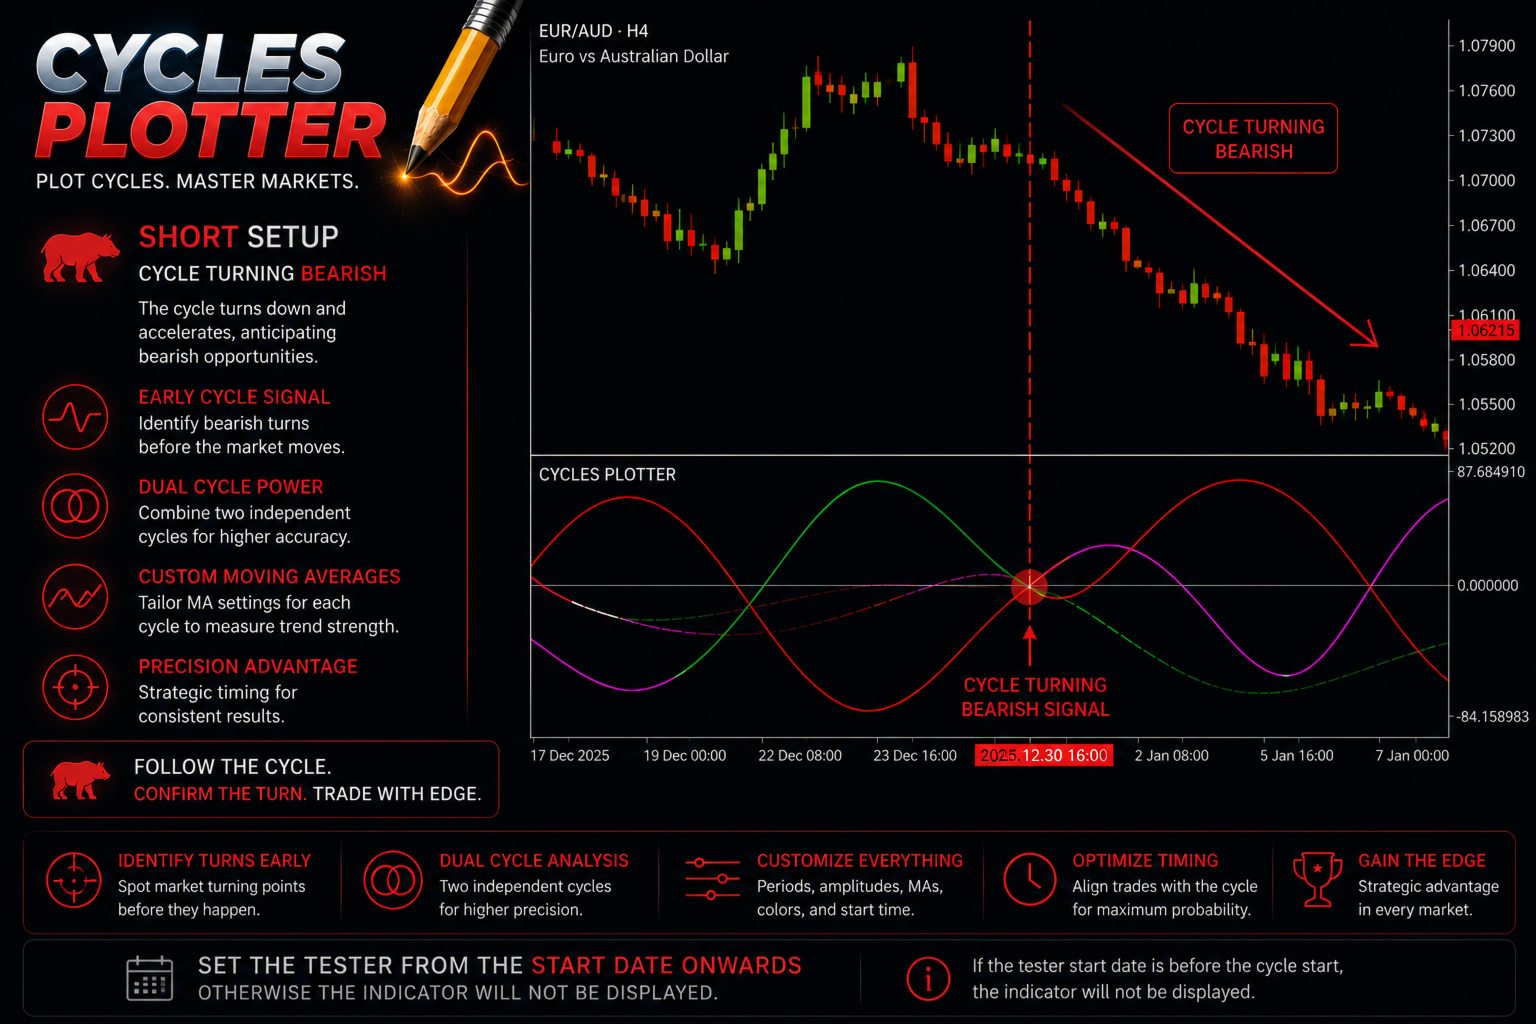
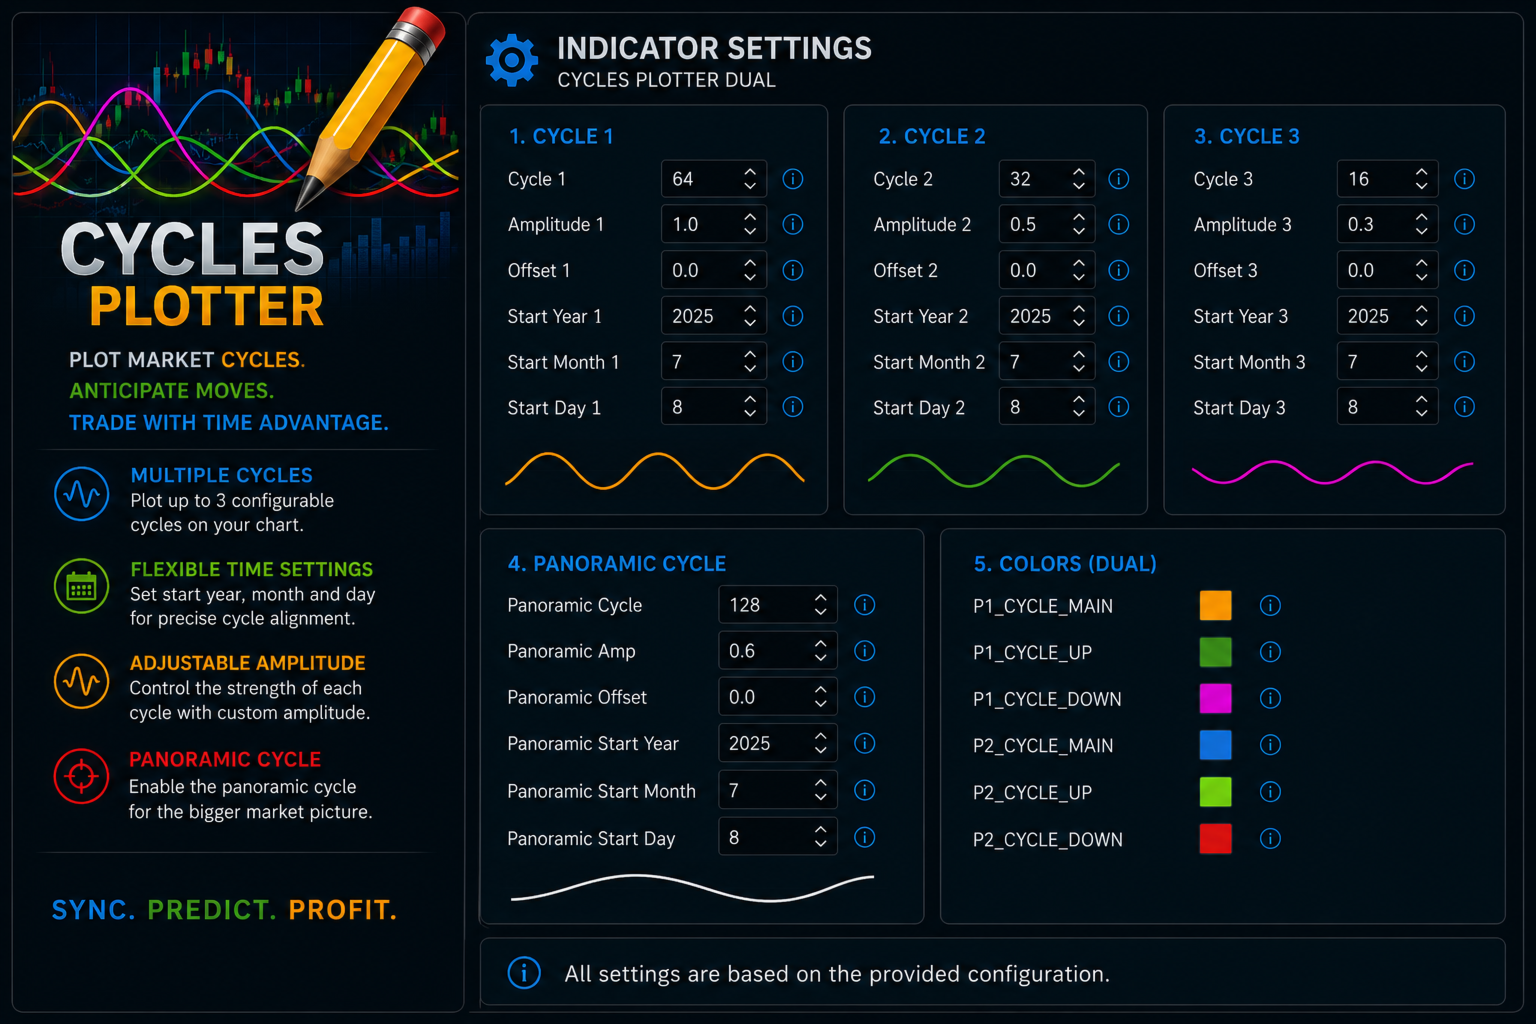
Cycles Plotter は、ユーザー入力のみに基づいて、完全にカスタマイズ可能な2つの正弦波サイクルを描画する高度なテクニカルインジケーターです。サイクルを自動生成しません。すべてのサイクルは、ユーザーが設定したパラメーターのみに基づいて計算され、価格の振動と潜在的なトレンド変化を研究するための視覚的ツールをトレーダーに提供し、自動シグナルや予測は生成しません。

重要なポイント:

ユーザー定義のサイクル: サイクル 1 P1 と 2 P2 はユーザーが完全に設定できます。サイクルの長さ、振幅、移動平均、正確な開始日と時刻を設定できます。ユーザーがパラメーターを入力しない場合、サイクルは描画されません。

振幅の制御: 各サイクルは異なる振幅を持つことができ、基準となる移動平均に対して振動の高さを調整できます。

トレンド検出: 高速および低速移動平均はサイクルの方向を示します:

Fast MA が Slow MA より大きい 上昇フェーズ 緑 lime

Fast MA が Slow MA より小さい 下降フェーズ magenta 赤

Fast MA が Slow MA とほぼ等しい 横ばいフェーズ flat オレンジ 青

サイクルの描画: 各サイクルには3つの独立したラインがあります:

上昇フェーズ 緑 lime

下降フェーズ magenta 赤

横ばいフェーズ flat オレンジ 青

カスタマイズ可能な開始日時: 各サイクルが描画され始める正確な瞬間を定義でき、市場イベントや過去のパターンと正確に整合させることができます。

誰に向いていますか?
このインジケーターは特に以下の人に推奨されます:

市場サイクルを研究している、またはすでに研究した人,

trading に適用されるサイクルの知識を深めたい人,

自分の trading システムでサイクルを使用している、または統合したい人.

したがって Cycles Plotter は、価格の周期的な動きを分析したい経験豊富なトレーダーにも、学習または研究段階にある人にも役立ちます。サイクル技術は信頼できるツールであり、長年にわたり確立されており、主要なテクニカル分析およびプロフェッショナル trading システムに存在しています。

重要: インジケーターは自動シグナルや予測を生成しません。すべての計算とサイクルは、ユーザーが提供した入力のみに基づいています。

おすすめのプロダクト
CosmiCLab SMC FIBO CosmiCLab SMC FIBO is a professional trading indicator designed for traders who use Smart Money Concepts (SMC), market structure analysis and Fibonacci retracement levels. The indicator automatically detects market swings and builds Fibonacci levels based on the latest impulse movement. It also identifies market structure changes such as BOS (Break of Structure) and CHOCH (Change of Character), helping traders understand the current market direction. CosmiCLab SMC FIBO also pr
Zone Structure Scanner Panel for MT5 Find better setups faster — without scanning charts for hours. The Zone Structure Scanner Panel for MT5 helps you automatically scan multiple symbols, detect key weekly and daily support/resistance zones, read market structure, highlight confluence, and flag H4 rejection-confirmed setups from one powerful panel. Instead of jumping from chart to chart, you get ranked opportunities in one place so you can focus on the setups that matter most. Why it stands
Introducing "X Marks the Spot" – Your Ultimate MetaTrader 5 Indicator for Perfect Trades! Are you tired of the guesswork in trading? Ready to take your MetaTrader 5 experience to a whole new level? Look no further – "X Marks the Spot" is here to revolutionize your trading strategy! What is "X Marks the Spot"? "X Marks the Spot" is not just another indicator – it's your personal trading compass that works seamlessly on all timeframes . Whether you're a beginner or an experienced trader,
MercariaPattern1-2-3 відстежує рух ціни, знаходить трьоххвильові структури 1-2-3 та підсвічує момент, коли сценарій підтверджується пробоєм ключового рівня. MercariaPattern1-2-3 tracks price movement, detects three-leg 1-2-3 structures and highlights the moment when the scenario is confirmed by a key level breakout. Індикатор збирає локальні свінги в компактну фігуру 0–1–2–3 , чекає підтвердженого пробою та будує стрілку входу з готовими рівнями SL/TP. The indicator combines local swings into a
Phantom Edge SMC — The Ultimate Smart Money Indicator for MT5 Tired of manually drawing structures while trading SMC or ICT concepts? Let Phantom Edge SMC do the heavy lifting for you. Key Features Internal & Swing Structure: Automatically detects BOS and CHoCH across two structural levels. Order Blocks (OB): Identifies Internal and Swing OBs with automated mitigation tracking. Equal Highs / Lows: Highlights EQH / EQL to pinpoint Liquidity pools. Fair Value Gaps (FVG): Displays FVGs with
RAD CRITICAL LEVES RAD indicator tracks “Relevant Volume” in real time, identifying accumulation and distribution processes, projecting them in the chart as SUPPORT or RESISTANCE zones. Natural   support   and resistance levels are generated by Volume Accumulation and Distribution processes. As these processes evolve, levels at which the relevant volume in the market place is positioned, become difficult areas to cross upwards or downwards. By using this information, traders can identify very s
Was: $249  Now: $99   Market Profile defines a number of day types that can help the trader to determine market behaviour. A key feature is the Value Area, representing the range of price action where 70% of trading took place. Understanding the Value Area can give traders valuable insight into market direction and establish the higher odds trade. It is an excellent addition to any system you may be using. Inspired by Jim Dalton’s book “Mind Over Markets”, this indicator is designed to suit the
RBreaker Gold Indicatorsは、金先物の短期日内取引戦略であり、トレンドフォローと日内反転の2つの取引手法を組み合わせたものです。トレンド相場での利益を捉えるだけでなく、相場が反転した際には迅速に利確し、その流れに沿ってポジションを反転させることができます。 この戦略は、アメリカの雑誌『Futures Truth』において、15年連続で最も収益性の高い取引戦略トップ10に選ばれた実績を持ち、非常に長いライフサイクルを誇り、現在も国内外で広く使用・研究されています。 本インディケーターは、2026年の金先物の値動きに対応し、14日間のATR指標に基づいて、ブレイクアウト係数A、観察係数B、リバーサル係数Rをより合理的な値で定義しています。非常に優れたインディケーターであり、安定的な年間収益を実現しています。ぜひおすすめします〜
これはほぼ間違いなく、MetaTraderプラットフォームで見つけることができる最も完全な調和価格形成自動認識インジケーターです。 19種類のパターンを検出し、フィボナッチプロジェクションをあなたと同じように真剣に受け止め、潜在的逆転ゾーン(PRZ)を表示し、適切なストップロスとテイクプロフィットレベルを見つけます。 [ インストールガイド | 更新ガイド | トラブルシューティング | よくある質問 | すべての製品 ] 19の異なる調和価格形成を検出します プライマリ、派生および補完フィボナッチ投影(PRZ)をプロットします 過去の価格行動を評価し、過去のすべてのパターンを表示します この指標は、独自の品質とパフォーマンスを分析します 適切なストップロスとテイクプロフィットのレベルを表示します ブレイクアウトを使用して適切な取引を通知します すべてのパターン比をグラフにプロットします 電子メール/音声/視覚アラートを実装します スコット・M・カーニーの本に着想を得て、この指標は最も純粋で急を要するトレーダーのニーズを満たすように設計されています。ただし、トレードを容易にする
OSS ULTIMATE ELITE 2026 – Institutional Smart Money System Stop chasing price. Start trading like smart money.  Why Traders Are Switching to OSS Elite Most indicators react after the move. OSS ULTIMATE ELITE is designed to help you position before the move happens. This is not just another signal tool — it’s a complete trading framework combining momentum, structure, and liquidity behavior.  What Makes This Different? Not lagging signals Not random arrows Not overfitted strategies  Built
Overview The Market Perspective Structure Indicator is a comprehensive MetaTrader indicator designed to provide traders with a detailed analysis of market structure across multiple timeframes. It identifies and visualizes key price action elements, including swing highs and lows, Break of Structure (BOS), Change of Character (CHOCH), internal structures, equal highs/lows, premium/discount levels, previous levels from higher timeframes, and trading session zones. With extensive customization opt
VOLUME PROFILE SAF-XII MT5専用プロフェッショナル・マーケットプロファイル分析ツール(グリッドトレードに最適な「ドリーム・インジケーター」) ボリュームプロファイル(価格帯別出来高)とは? ボリュームプロファイルは、従来の「時間軸」の出来高とは異なり、「特定の価格帯」での取引活動を表示するプロ仕様のツールです。選択した期間内の「どこで」取引が行われたかを可視化し、以下のポイントを特定します: バリューエリア (VAH/VAL) :全取引の大部分が行われた価格帯。 ポイント・オブ・コントロール (POC) :最も出来高が集中した単一の価格水準。 リクイディティ・イムバランス :各価格帯における強気(買い)と弱気(売り)の優劣。 サポレジ(支持・抵抗) :実際の取引活動に基づいた自然な価格水準。 3つの動作モード — 「設定したらあとはお任せ」 VP_MANUAL(スイングトレード・重要ライン分析) 垂直ラインをドラッグして分析範囲を手動で設定。 ラインを動かした時のみ再計算されるため軽量。 用途 :指標発表前分析、決算発表、特定の期間分析。 VP_AUTO(スキ
Chỉ báo này sẽ thông báo cho bạn nếu cấu hình xu hướng thành công. Tín hiệu theo xu hướng không nên được tăng theo, nhưng tín hiệu mua ở mức giá thấp theo mô hình giao dịch thông thường của bạn, hoặc tín hiệu bán ở mức giá tốt, là một lựa chọn rất tốt. Hãy thiết lập nó trên khung thời gian lớn hơn và theo dõi các khung thời gian nhỏ hơn, bám sát các xu hướng chính. Tôi thường thiết lập ba khung thời gian gần nhau nhất và không bao giờ đi ngược tín hiệu của INdicator này. INdicator   này không có
インディケータは現在のクオートを作成し、これを過去のものと比較して、これに基づいて価格変動予測を行います。インジケータには、目的の日付にすばやく移動するためのテキスト フィールドがあります。 オプション: シンボル - インジケーターが表示するシンボルの選択; SymbolPeriod - 指標がデータを取る期間の選択; IndicatorColor - インジケータの色; HorisontalShift - 指定されたバー数だけインディケータによって描画されたクオートのシフト; Inverse - true は引用符を逆にします。false - 元のビュー。 ChartVerticalShiftStep - チャートを垂直方向にシフトします (キーボードの上下矢印)。 次は日付を入力できるテキストフィールドの設定で、「Enter」を押すとすぐにジャンプできます。
HAS RSI Signal — SL/TP自動計算機能付き プロフェッショナル・トレンドインジケーター HAS RSI Signal は、信頼性の高いクラシックな手法と最新のノイズ除去アルゴリズムを融合させた強力なトレーディングツールです。 平均足スムーズド(Heiken Ashi Smoothed) と RSI を組み合わせることで、トレンドの転換点や買われすぎ・売られすぎ圏からの脱出タイミングを正確に捉え、明確なエントリーシグナルを提示します。 主な特徴: 二重のフィルタリング: 平均足スムーズドで市場の「ノイズ」を除去し、RSIで勢い(モメンタム)の強さを確認します。 損切り・利確ラインの自動計算: 単にシグナルを出すだけでなく、ボラティリティ( ATR )に基づいた最適なストップロス(SL) と テイクプロフィット(TP)を自動で算出します。 視覚的な分かりやすさ: シグナルはチャート上にカラーキャンドルとして表示されるため、一目でトレンドを把握でき、取引画面をスッキリと保てます。 充実の通知機能: アラート、音声、スマートフォンへのプッシュ通知機能を搭載。チャンスを逃すこと
TL Method — Automatic Trendline Detection & Strength Indicator Tired of drawing trendlines manually? TL Method does it for you — automatically detecting, drawing, and scoring trendlines in real time. What it does: Scans up to 1000 bars to find valid support and resistance trendlines Scores each trendline by counting confirmed anchor touches Generates buy/sell signal arrows when price approaches strong trendlines Alerts you via popup, push notification, or sound — with smart cooldown to avoid spa
Multi-Timeframe PO3 Projection Multi-Timeframe PO3 Projection is a clean and practical MetaTrader 5 indicator designed to project multiple higher-timeframe candles directly on your active chart. Instead of switching between H1, H4, D1, and other higher timeframes, this indicator lets you view their live candle structure side by side. It helps traders track the current higher-timeframe open, high, low, close, and candle direction while staying on the chart timeframe they are actively trading. The
プレミアムレベルは、正しい予測の精度が80%を超える独自の指標です。 この指標は、最高のトレーディングスペシャリストによって2か月以上テストされています。 あなたが他のどこにも見つけられない作者の指標! スクリーンショットから、このツールの正確さを自分で確認できます。 1は、1キャンドルの有効期限を持つバイナリーオプションの取引に最適です。 2はすべての通貨ペア、株式、商品、暗号通貨で機能します 手順: 赤い矢印が表示されたらすぐにダウントレードを開き、青い矢印が表示されたら閉じます。青い矢印の後に開くこともできます。 試してテストしてください!推奨設定はデフォルトです! 日足チャートで最高の精度を示します! インディケータは、2600 Pipsの収益性に対して、約10Pipsという非常に小さなマージンを使用します。
SMC Venom Model BPR インジケーターは、スマート マネー (SMC) コンセプトで取引するトレーダー向けのプロフェッショナル ツールです。価格チャート上の 2 つの主要なパターンを自動的に識別します。 FVG   (フェアバリューギャップ) は、3 本のローソク足の組み合わせで、最初のローソク足と 3 番目のローソク足の間にギャップがあります。ボリュームサポートのないレベル間のゾーンを形成し、価格修正につながることがよくあります。 BPR   (バランス価格範囲) は、2 つの FVG パターンの組み合わせで、「ブリッジ」を形成します。これは、価格がボリュームアクティビティの少ない動きで動くときに、ブレイクアウトしてレベルに戻るゾーンで、ローソク足の間にギャップを作成します。 これらのパターンは、大規模な市場プレーヤーと一般参加者の相互作用が発生するチャート上のボリュームと価格動向の分析に基づいて、トレーダーが主要なサポート/レジスタンス レベル、ブレイクアウト ゾーン、エントリ ポイントを識別するのに役立ちます。 インジケーターは、長方形と矢印の形でパターンを視覚
MetaTrader 4 version available here: https://www.mql5.com/en/market/product/25793 FFx Pivot SR Suite PRO is a complete suite for support and resistance levels. Support and Resistance are the most used levels in all kinds of trading. Can be used to find reversal trend, to set targets and stop, etc. The indicator is fully flexible directly from the chart 4 periods to choose for the calculation: 4Hours, Daily, Weekly and Monthly 4 formulas to choose for the calculation: Classic, Camarilla, Fibonac
123パターン は、最も人気のある強力で柔軟なチャートパターンの1つです。このパターンは、3つの価格ポイントで構成されています。ボトム、ピークまたはバレー、および38.2%〜71.8%のフィボナッチリトレースメントです。パターンは、価格が最後のピークまたは谷、インディケーターが矢印をプロットし、アラートを上昇させ、取引を行うことができる瞬間を超えたときに有効と見なされます。 [ インストールガイド | 更新ガイド | トラブルシューティング | よくある質問 | すべての製品 ] クリアな取引シグナル カスタマイズ可能な色とサイズ パフォーマンス統計を実装します カスタマイズ可能なフィボナッチリトレースメントレベル 適切なストップロスおよび利益レベルを表示します インジケーターを使用して、継続パターンまたは反転パターンを見つけることができます 再描画および非再描画ではありません 電子メール/音声/視覚アラートを実装します 123パターン は、継続パターンまたは反転パターンとして現れます。物事を簡単にするために、このインジケーターを使用して、検索するパターンのタイプを選択できるため
Cumulative delta indicator As most traders believe, the price moves under the pressure of market buying or selling. When someone redeems an offer standing in the cup, the deal is a "buy". If someone pours into the bid standing in the cup - the deal goes with the direction of "sale". The delta is the difference between purchases and sales. A cumulative delta - the difference between the cumulative sum of purchases and sales for a certain period of time. It allows you to see who is currently contr
Price Magnet — Price Density and Attraction Levels Indicator Price Magnet is a professional analytical tool designed to identify key support and resistance levels based on statistical Price Density. The indicator analyzes a specified historical period and detects price levels where the market spent the most time. These zones act as “magnets,” attracting price action or forming a structural base for potential reversals. Unlike traditional Volume Profile tools, Price Magnet focuses on price-time d
FX-AIEA Smart Supply and Demand Zone Identification Indicator (Supply and Demand Indicators MT5) Version: 2.51 | Compatible Platform: MetaTrader 5  Why do trades need supply and demand zones? Supply and demand zones are the core manifestation of institutional order flow, reflecting real buying and selling power more accurately than traditional support and resistance. However, manual drawing is not only time-consuming but also highly subjective and prone to missing key areas. FX-AIEA Supp
Potential Reversal Price (PRP) Indicator - Ultimate Sniper Entries for XAUUSD Discounted   Price   !!     Secure your lifetime access   now   before it switches to   subscription-only ! Welcome to the Potential Reversal Price (PRP) Indicator , your ultimate trading tool designed to catch high-probability market reversals with extreme precision. Built for serious traders who demand accuracy, the PRP Indicator combines advanced market structure analysis with momentum exhaustion to pinpoint the exa
The Super Arrow Indicator provides non-repainting buy and sell signals with exceptional accuracy. Key Features No repainting – confirmed signals remain fixed Clear visual arrows: green for buy, red for sell Real-time alerts via pop-up, sound, and optional email Clean chart view with no unnecessary clutter Works on all markets: Forex, gold, oil, indices, crypto Adjustable Parameters TimeFrame Default:   "current time frame" Function:   Sets the time frame for indicator calculation Options:   Can
Volume Profile Canvas - Professional Volume Profile Indicator for MetaTrader 5 DESCRIPTION Volume Profile Canvas is a professional volume profile indicator for MetaTrader 5 that renders directly on the chart using a high-performance Canvas engine. It calculates and displays the volume distribution across price levels, identifying the Point of Control (POC), Value Area High (VAH) and Value Area Low (VAL) in real time. This is a pure analysis tool. It does not trade. It gives you an instant vi
Footprint は、オーダーフロー(Order Flow)と出来高分析のためのインジケーターです。 クラスターレベルでの市場構造の特定、アクティビティの高い主要ゾーンの発見、そして設定ウィンドウを毎回開くことなくチャート上で直接フィルター操作を行うのに役立ちます。 Footprintインジケーターの機能 Bid x Ask、Deltaのクラスターチャート; チャート上のコントロールパネル; フィルター調整用のスライダー; Absorption; Initiative; Stacked Imbalances; Big Trades; dPOC / Dynamic Point of Control; Delta; サイドマーケットプロファイル; 累積デルタ(Cumulative Delta)。 主な利点 高密度のティックフローに対する高速な計算とデータ表示; チャート内管理 — 設定を開くことなく、主要モードとフィルターを直接切り替え可能; 重要な価格レベルとクラスターを強調するためのフィルタリング; シグナルの視覚的ハイライト:吸収、主導権、インバランス、大口取引; 日、週、または現
Looking for reliable levels on a price chart? Already tired of searching for similar indicators? Are the levels not working out as they should? Then this is the indicator for you. Volume Prices Universal is a reliable indicator of horizontal volumes. What does it show? First of all, the main idea of ​​the indicator is to display at which price mark the price has been for the longest time. Thus, the display of price volumes on the price chart is formed. With the help of which you can very simpl
このプロダクトを購入した人は以下も購入しています
ScalpPoint is a powerful trading companion designed to generate high-probability entry signals with dynamic TP/SL/DP levels based on volatility. Built-in performance tracking shows win/loss stats, PP1/PP2 hits, and success rates — all updated live. Key Features: Buy/Sell signals with adaptive volatility bands Real-time TP/SL/DP levels based on ATR Built-in MA Filter with optional ATR/StdDev volatility Performance stats panel (Success, Profit/Loss, PP1/PP2) Alerts via popup, sound, push, or emai
SmartScalping is a powerful trading companion designed to generate high-probability entry signals with dynamic TP/SL/DP levels based on volatility. Built-in performance tracking shows win/loss stats, PP1/PP2 hits, and success rates — all updated live. Key Features: Buy/Sell signals with adaptive volatility bands Real-time TP/SL/DP levels based on ATR Built-in MA Filter with optional ATR/StdDev volatility Performance stats panel (Success, Profit/Loss, PP1/PP2) Alerts via popup, sound, push, or e
MasterTrend Indicator for MT5 A powerful trend-following and signal-evaluation tool MasterTrend   is a custom MT5 indicator that combines Moving Averages and ATR-based risk/reward logic to generate clear buy/sell signals. It visualizes dynamic SL/TP levels, evaluates past trade outcomes, and displays win/loss statistics in a clean on-chart panel. Key features include: Buy/Sell signals based on MA crossovers ATR-based SL/TP1/TP2/TP3 levels with visual lines and labels Signal outcome tracking wit
ARIPoint
Temirlan Kdyrkhan
1 (1)
ARIPoint is a powerful trading companion designed to generate high-probability entry signals with dynamic TP/SL/DP levels based on volatility. Built-in performance tracking shows win/loss stats, PP1/PP2 hits, and success rates all updated live. Key Features: Buy/Sell signals with adaptive volatility bands Real-time TP/SL/DP levels based on ATR Built-in MA Filter with optional ATR/StdDev volatility Performance stats panel (Success, Profit/Loss, PP1/PP2) Alerts via popup, sound, push, or email Cu
MetaTrader 5 向けスマート多層ブレイクアウト&プルバック検出器 「スマート・シンプル・ファスト!」 高確率のブレイクアウトエントリーを見逃すことにうんざりしていませんか? 複数のチャートを何時間もスキャンし、ブレイクアウトをトレンド方向と通貨のモメンタムに合わせようとして、それでも動きを逃してしまうことはありませんか? Break Pullback は、1つのインジケーターでそのすべてを解決します。 Break Pullback とは何ですか? Break Pullback は、マーケットストラクチャー、ブレイクアウト、トレンド継続のセットアップを取引するトレーダー向けに特別に設計されたプロフェッショナルグレードの MetaTrader 5 インジケーターです。 リアルタイムで複数の通貨ペアにわたるブレイクとプルバックの形成を自動的に検出し、3層の確認を通じてすべてのシグナルをフィルタリングします: ストラクチャラルブレイクアウト検出 — チャート上の主要なブレイクレベルを特定 HTF 日足バイアス — エントリーを支配的な日足トレンド方向に合わせる 通貨強弱指数 —
ARICoin is a powerful trading companion designed to generate high-probability entry signals with dynamic TP/SL/DP levels based on volatility. Built-in performance tracking shows win/loss stats, PP1/PP2 hits, and success rates all updated live. Key Features: Buy/Sell signals with adaptive volatility bands Real-time TP/SL/DP levels based on ATR Built-in MA Filter with optional ATR/StdDev volatility Performance stats panel (Success, Profit/Loss, PP1/PP2) Alerts via popup, sound, push, or email Cust
AriX
Temirlan Kdyrkhan
1 (4)
AriX Indicator for MT5 A powerful trend-following and signal-evaluation tool AriX is a custom MT5 indicator that combines Moving Averages and ATR-based risk/reward logic to generate clear buy/sell signals. It visualizes dynamic SL/TP levels, evaluates past trade outcomes, and displays win/loss statistics in a clean on-chart panel. Key features include: Buy/Sell signals based on MA crossovers ATR-based SL/TP1/TP2/TP3 levels with visual lines and labels Signal outcome tracking with real-time stat
CGE Trading Suite
Carl Gustav Johan Ekstrom
5 (2)
Institutional-Grade Analytics for MT5 C GE Trading Suite delivers the analytical edge typically reserved for professional trading desks. The platform integrates a full suite of analytical tools into one seamless workflow: dynamic grid mapping, liquidity behavior analysis, ECM, trend lines, MIDAS, trade cycles, and directional channel projections. Together, these provide a unified view of market structure and momentum. Directional clarity is further enhanced by the capital flow index, which meas
Big Player Range
Thalles Nascimento De Carvalho
5 (3)
BigPlayerRange — MT5向け最強インジケーター BigPlayerRange は、MetaTrader 5 で日経ミニやドル先物などの取引において、 最も効果的なインジケーター と評価されています。大口投資家(機関投資家)の行動を可視化し、高精度なテクニカル分析を可能にします。 どのように機能するのか? BigPlayerRangeは、買い圧力ゾーン(緑ライン)と売り圧力ゾーン(赤ライン)を描画し、価格がその範囲を超えるとトレンド方向への動きを示唆します。 緑のライン上で終値: 買いの勢いが強く、上昇トレンドの可能性。 赤のライン下で終値: 売り圧力が優勢で、下落が予想される。 範囲内での価格: レンジ相場でブレイクを待つ段階。 主なメリット: 機関投資家ゾーンの検出: 大口のエントリーポイントを視覚化。 自動ターゲット計算: 利確ポイントを戦略的に設定。 プルバックの可能性分析: リスク管理に役立つ情報提供。 推奨の使い方: Imbalance DOM Pro と併用してゾーンブレイクを確認。 SwingVolum
MATADOR GOLD XAUUSD M5 Scalp Signals for MT5 MATADOR GOLD is a decision-support indicator for MetaTrader 5, designed for traders who analyze short-term Gold movement on the M5 timeframe. The indicator does not open, close, or manage trades automatically. It provides buy and sell signal guidance so the user can make their own trading decisions according to their risk plan, broker conditions, and trade management rules. Main purpose MATADOR GOLD is built to help traders avoid noisy signal flow and
+++++++++++++++++++++++++++++++++++++++++++++++++++++++++++++++++++++++++++++++++++++++++++++++++ +++ Link to EURUSD Only Free Version -->  https://www.mql5.com/en/market/product/156904?source=Unknown +++++++++++++++++++++++++++++++++++++++++++++++++++++++++++++++++++++++++++++++++++++++++++++++++ Hallo Trader, This is a traditional GANN & FIBONACCI strategy based on detection of an impulsive move in the opposite direction. This is called a Breakout. At the moment of Breakout, the indicator draw
BTCUSD PRO Signal Solution for MT5 BTCUSD PRO is a decision-support indicator for MetaTrader 5, designed for traders who analyze BTCUSD or BTCUSD# with a structured signal workflow. The product is not an automated trading system. It does not open, close, or manage trades automatically. It provides analytical buy and sell signal information and displays a visual trade plan on the chart so the user can make their own trading decisions. Main purpose BTCUSD PRO is designed for traders who prefe
この位置が買いに適しているかどうかの判断をサポートします。 この位置が売りに適しているかどうかの判断をサポートします。 4つの指標が同時に底に達した場合は、反発のチャンスに注目してください。 4つの指標が同時に天井付近にある場合は、下落のチャンスに注目してください。 本システムは、中国の先進的なアルゴリズム技術と高度な数学モデリング体系に基づいて構築されています。 私は主に XAUUSD M5 でこの指標を使用しており、この時間足が最も良い結果を示します。 この指標のアルゴリズムと数式は非常に複雑なため、テスト時に動作が遅くなる場合があります。テストでは、リペイントの有無と遅れの有無を確認してください。正式版では実際の使用時により安定します。 この指標システムはリペイントせず、未来データも使用しません。ご購入前にご自身でテストしてご確認いただけます。 この指標には完全にカスタマイズ可能なアラートシステムが搭載されており、以下のリンクからご確認いただけます。 正式に使用する前に、完全な使用説明を十分にお読みください。 ご不明な点がございましたら、どうぞお早めにご連絡ください。できるだけ早
ZIVA Signal Intelligence
Hassan Abdullah Hassan Al Balushi
ZIVA Signal Intelligence An Adaptive, Modular Market Intelligence System ZIVA Signal Intelligence is not positioned as a conventional trading indicator. It is a fully integrated, proprietary market intelligence system engineered to deliver structured, high-precision interpretation of price behavior within a controlled analytical environment. Developed through an independent architectural approach, ZIVA does not rely on, derive from, or replicate existing indicators. It represents a standalone
SunSignal ML — AI Gold Signals with Multi-Timeframe Confluence SunSignal ML is an advanced AI-powered signal indicator purpose-built for XAUUSD gold trading. It combines a proprietary adaptive trend algorithm with six machine learning models trained on confirmed price pivots to produce high-confidence entry signals with multi-timeframe validation. The indicator runs efficiently on M1, M5 and M15 timeframes and is designed for traders who want precision entries guided by data rather than guesswor
FX Analysis is an all-in-one MT5 indicator dashboard that combines eight analytical tools in a single panel, helping traders identify high-probability setups without switching between charts or indicators. Designed for standard forex pairs on MetaTrader 5. Best results on M15 - H4 timeframes when all components are used together as part of the included workflow. Components Volatility Analyzer Displays historical average movement by hour and by day of the week. A real-time Pip Balance shows the
IVISTscalp5
Vadym Zhukovskyi
5 (6)
[iVISTscalp5]:時間を通じた市場行動研究ラボ TLV Framework | Liquidity Activation Points ⸻ 概要 iVISTscalp5 は、VISTmany プロジェクトの一環として開発された、多層型のタイミングおよび価格構造インジケーターです。 このシステムは、Liquidity Activation Points(タイミング)を通じて、 動きが発生する時間 方向性 値動きの範囲 を予測します。 iVISTscalp5 インジケーターは、デフォルト設定のまま、あらゆる金融商品に使用できます。 ⸻ 実践的価値 iVISTscalp5 は、一般的なテクニカル指標として開発されたものではありません。 開発の中心的な理念は次の通りです。 あらゆる人が「時間」を通じて市場行動を研究できるようにすること。 ⸻ Time Language VISTmany (TLV) — プロジェクトの主要概念 t(p) t(p) は、タイミングが活性化する価格レベルです。 ⸻ p(p) p(p) は
Recommended TimeFrame >= H1. 100% Non Repainted at any moment.  Use it carefully, only with Trend Direction. Trading Usage: 2 Variants: as Range System or as BreakOut System (Both Only With Trend Direction)::: (Always use StopLoss for minimise Risk); [1] as Range System: (Recommended) in UP TREND:  - BUY in Blue Line , then if price goes down by 50 points (on H1) open Second BUY.   Close in any Profit you wish: TrailingStop(45 points) or Close when Price touches upper Gold Line. in DOWN TREND
VTrende Pro
Andrii Diachenko
5 (1)
VTrende Pro - MTF indicator for trend trading with a display panel for MT5 *** Videos can be translated into any language using subtitles (video language - Russian) Although the signals of the VTrende Pro indicator can be used as signals of a full-fledged trading system, it is recommended to use them in conjunction with the Bill Williams TS. VTrende Pro is an extended version of the VTrende indicator. Difference between Pro version and VTrende: - Time zones - Signal V - signal 1-2 waves -    S
Beat The Market Maker MT5
Yahia Ismail Ibrahim El Mughrabi
BEAT THE MARKET MAKER Stop Entering After the Market Has Already Trapped You Most traders think they need a better entry. But the real problem is deeper. They enter when price looks strong… only to discover they were the liquidity. The market moves to collect weak positions before the real move begins. That is why you get caught in fake breakouts. That is why you enter late. That is why the chart looks clear only after the move is finished. You do not need more noise. You need to read the
Red and Green Light – Intelligent Trading Signal Indicator Product Overview Red and Green Light is a professional trading signal indicator based on the multi-stage T3 smoothing algorithm. It integrates a visual traffic light system, intelligent signal recognition, risk alerts, and multiple notification features. Whether you're a manual trader or an Expert Advisor (EA) developer, this indicator helps you capture market opportunities with greater precision and effectively avoid the risks of
The Expert Advisor and the video are attached in the Discussion tab . The robot applies only one order and strictly follows the signals to evaluate the indicator efficiency. Pan PrizMA CD Phase is an option based on the Pan PrizMA indicator. Details (in Russian). Averaging by a quadric-quartic polynomial increases the smoothness of lines, adds momentum and rhythm. Extrapolation by the sinusoid function near a constant allows adjusting the delay or lead of signals. The value of the phase - wave s
Классификатор силы тренда. Показания на истории не меняет. Изменяется классификация только незакрытого бара. По идее подобен полной системе ASCTrend, сигнальный модуль которой, точнее его аппроксимация в несколько "урезанном" виде, есть в свободном доступе, а также в терминале как сигнальный индикатор SilverTrend . Точной копией системы ASCTrend не является. Работает на всех инструментах и всех временных диапазонах. Индикатор использует несколько некоррелируемых между собой алгоритмов для класси
FFx Universal Strength Meter PRO is more than a basic strength meter. Instead of limiting the calculation to price, it can be based on any of the 19 integrated strength modes + 9 timeframes. With the FFx USM, you are able to define any period for any combination of timeframes. For example, you can set the dashboard for the last 10 candles for M15-H1-H4… Full flexibility! Very easy to interpret... It gives a great idea about which currency is weak and which is strong, so you can find the best pai
The FFx Universal MTF alerter shows on a single chart all the timeframes (M1 to Monthly) with their own status for the chosen indicator. 9 indicators mode (MACD-RSI-Stochastic-MA-ADX-Ichimoku-Candles-CCI-PSAR). Each can be applied multiple times on the same chart with different settings. Very easy to interpret. Confirm your BUY entries when most of the timeframes are showing green color. And confirm your SELL entries when most of the timeframes are showing red color. 2 Alert Options : input to s
The FFx Watcher PRO is a dashboard displaying on a single chart the current direction of up to 15 standard indicators and up to 21 timeframes. It has 2 different modes: Watcher mode: Multi Indicators User is able to select up to 15 indicators to be displayed User is able to select up to 21 timeframes to be displayed Watcher mode: Multi Pairs User is able to select any number of pairs/symbols User is able to select up to 21 timeframes to be displayed This mode uses one of the standard indicators
FFx Patterns Alerter gives trade suggestions with Entry, Target 1, Target 2 and StopLoss .... for any of the selected patterns (PinBar, Engulfing, InsideBar, OutsideBar) Below are the different options available: Multiple instances can be applied on the same chart to monitor different patterns Entry suggestion - pips to be added over the break for the entry 3 different options to calculate the SL - by pips, by ATR multiplier or at the pattern High/Low 3 different options to calculate the 2 TPs -
MetaTrader 4 version available here : https://www.mql5.com/en/market/product/24881 FFx Basket Scanner is a global tool scanning all pairs and all timeframes over up to five indicators among the 16 available. You will clearly see which currencies to avoid trading and which ones to focus on. Once a currency goes into an extreme zone (e.g. 20/80%), you can trade the whole basket with great confidence. Another way to use it is to look at two currencies (weak vs strong) to find the best single pairs
ClassicSBA
Umri Azkia Zulkarnaen
this indicator very simple and easy if you understand and agree with setup and rule basic teknical sba you can cek in link : please cek my youtube channel for detail chanel : an for detail info  contact me  basicly setup buy (long) for this indicator is Magenta- blue and green candle or magenta - green  and green candlestik and for setup sell (short) is Black - yellow - and red candle or black - red  and red candlestik
作者のその他のプロダクト
LongTerm
Edoardo Centorame
5 (1)
LongTerm は、中長期 trend の強さと質を解釈するために設計された方向性分析インジケーターであり、long oriented 分析に特化しています。 これはエントリーインジケーターでも運用 timing ツールでもなく、市場が long trend に対して有利または不利な条件を提供している時をトレーダーが理解するのを助けるために設計されたツールであり、短期変動に典型的なノイズを減らします。 目的 LongTerm は以下のために作られています: 強く構造化された long trends を識別する 拡大、減速、消耗のフェーズを区別する 支配的な方向性コンテキストを明確に読み取る これは swing trading と long term 分析を志向するトレーダーに理想的なツールです。 色と市場条件の解釈 LongTerm は、long trend のさまざまなフェーズを即座に読み取れるように設計されたカラー構造を使用し、市場の最良および最悪の条件を明確に強調します。 緑のライン 正の傾きで青のラインの上 この構成は最良の条件を表します。 Long trend は強く、安定
FREE
Trend Direction Filter: これは、市場の支配的な方向を特定し、トレーダーが全体的なコンテキストを理解してより意識的に運用できるように設計されたプロフェッショナルインジケーターと定義できます。 これはエントリーインジケーターではなく、trend の構造を強調し、市場ノイズの影響を減らすために設計された高度な方向性フィルターです。 仕組み インジケーターは、進化した smoothing 構造を通じて価格の動きを分析し、以下を区別できます: 明確に定義された方向性フェーズ 減速または移行フェーズ 市場の迷いのフェーズ その結果は、優勢な方向の明確で安定した表現であり、運用するコンテキストを評価するのに役立ちます。 視覚的解釈 Trend Direction Filter は、シンプルだが非常に情報量の多いグラフィック表現を使用します: 濃い緑のライン 市場の主要な方向を表します。 上向きに傾いている場合、進行中の上昇構造を示します。傾きを失う場合、推進力の弱まりを示します。 緑の破線 上昇傾向の強化を示します。 主要な濃い緑のラインの上に存在することで、動きがより大きな
FREE
Multi-Timeframe Alignment PRO は、複数の時間足における市場のアライメントを同時に分析し、その情報を明確で視覚的に分かりやすく、簡単に解釈できるパーセンテージに変換するために設計された高度なインジケーターです このインジケーターの目的はシンプルです。複数の時間足が同じ方向に動いているタイミングを把握し、トレード判断の質を高めることです この PRO バージョンは、単なる基本版のグラフィック拡張ではなく、より深い分析、より高いコントロール性、そして実践的かつプロフェッショナルな使用を想定したインテリジェントなアラートシステムを導入しています。 マルチタイムフレーム・アライメントとは(簡単に説明) 各時間足はそれぞれ異なるストーリーを語ることがあります。短期の時間足は上昇、中期は中立、長期は下降ということもあります。 複数の時間足が同じストーリーを語るとき、市場はより整然とし、読みやすくなります。 このインジケーターは、選択した時間足が LONG、SHORT、または FLAT 状態でどの程度一致しているかを測定し、それをパーセンテージで表示するため、曖昧なシグナ
Trend Sniper Follow トレンドの明確さ、構造、コントロール Trend Sniper は、中長期トレンドを明確で秩序立った、ノイズの少ない形で読み取るために設計されたトレンド分析インジケーターです。 主な強み クリーンで即時のトレンド読み取り シンプルだが強力な階層構造 チャート上の視覚的な過負荷なし Daily、Weekly、Monthly に最適 swing trading と trend following に最適 感情的な解釈を避け、市場コンテキストに沿った状態を保つのに役立ちます Trend Sniper Follow は運用タイミングのツールではなく、エントリーまたはエグジットのシグナルを提供しません。 市場構造を予測するのではなく、理解したい人のために設計されています。 どこでどのように使用するか Trend Sniper Follow は価格チャートに直接適用されます 価格と同じウィンドウで機能します 他の重ね表示インジケーターと一緒に使用するようには設計されていません この選択により、クリーンで読みやすく一貫したチャートが保証され、プロフェッショナル
Zeta Trend ダイナミックタイミング付きトレンドラインインジケーター Zeta Trend は、高速および低速のトレンドラインを自動的に描画し、それらを追加のサポートインジケーターから得られるタイミングシグナルと組み合わせる高度なテクニカルインジケーターです。自動的な買いまたは売りシグナルは生成しません。すべてのラインとインジケーターは、市場の方向性と潜在的なトレンド変化の解釈を容易にする視覚的ツールをトレーダーに提供するために計算されます。 重要なポイント: ダイナミックトレンドライン: Zeta Trend は高速および低速のトレンドラインを使用して、価格の主要方向と副次方向を強調します。Zeta Period と呼ばれる主要なオレンジラインは、長期の参照トレンドを表します。高速ラインはより速く一時的な動きのシグナルを示し、低速ラインは基礎トレンドを示します。 方向の検出: ラインの組み合わせにより、市場フェーズを識別できます: 価格が参照ラインの上にあり、高速ラインが緑 確認された上昇フェーズ 価格が参照ラインの下にあり、低速ラインが赤 確認された下降フェーズ 青または白
Directional Force Histogram DFH は、市場の状態を映し出し、トレーダーが方向性の圧力、動きの強さ、減速または移行局面を即座に解釈できるように設計されたヒストグラム型インジケーターです。 DFH は自動的な買いまたは売りシグナルを提供しません。 その目的は、意思決定の質とポジション管理を向上させるための運用上のコンテキストを提供することです。 DFH が測定するもの 上昇圧力と下降圧力 動きの強度 減速と勢いの喪失 移行局面と中立性 トレンドの質と成熟度 情報は色付きのヒストグラムで表され、読みやすく、裁量トレードに適しています。 色とバーの動きの読み方 Directional Force Histogram は、市場の状態を説明するために色とバーの推移を使用します。 増加する緑のバー 上昇圧力の増加 徐々に増加する緑のバーは、上昇圧力が拡大していることを示します。 市場は良好な参加を伴って上方向に加速しています。 典型的な使用法: long ポジションを維持するのに有利なコンテキスト 増加する力に逆らった short 取引を避ける 健全な上昇トレンドの確認
Market Pulse Colored Dual 二重時間軸マーケットインパルス指標 ダイナミックカラー Market Pulse Dual は RSI CCI および ATR に基づくエネルギー ボラティリティ調整を組み合わせて 市場のインパルスを測定し 可視化するために設計された高度なテクニカル指標です。 この指標は注文を生成せず 自動売買も行いません。市場のモメンタムの方向性と質を明確に要約する視覚的ツールであり 特定の色によって 上昇局面 下降局面 中立状態 そして勢いの弱まりや方向転換の可能性がある局面を強調表示します。 出力は別ウィンドウに表示され 固定スケールは 100 から 100 で ゼロライン 0.0 を基準として使用します。 1 指標の構造: 2つの Pulse 2本のライン この指標は 2本のカラーラインを描画します。 Pulse 1 Market Pulse より細いライン width 2 これはメインの pulse であり より反応が速く 標準的な感度でモメンタムの方向を捉えるのに適しています。 ユーザーが設定した期間の RSI と CCI を使用します。
CCI FIXED DUALとは何か CCI FIXED DUALは、プロフェッショナル向けのTrend Direction Filterであり、次の要素を正確に識別するために設計されています。 市場の支配的な方向 値動きの構造的な質 メイントレンドと加速局面との一貫性 これは直接的なエントリー指標ではありません。 これはクラシックなオシレーターではありません。 これはコンテキストツールであり、トレーダーがいつ取引すべきか、そしていつ取引すべきでないかを判断するのを助け、市場のノイズと解釈ミスを大幅に減らすために設計されています。 CCI FIXED DUALの基本哲学 CCI FIXED DUALが基づいている原則はシンプルですが非常に強力です。 シグナルは、市場構造と一貫している場合にのみ価値を持ちます。 この理由から、このインジケーターは 単一の値を使用しません 価格に衝動的に反応しません 無理に反転ポイントを探しません その代わりに、次の要素に基づいて階層的なトレンドの読みを構築します。 Typical Price上のCCI 異なる速度のLWMA移動平均 短期 中期 長期の動的
TREND VISION PROとは TREND VISION PROは、高度な適応型マルチタイムフレーム Trend Direction Filter であり、ほぼすべての主要な運用タイムフレームにおける市場の方向性を、構造的、階層的、かつ文脈的に、自動かつ一貫した方法で読み取るために設計されています。 TREND VISION PROは、TREND VISION DAILYの直接的な進化版です。DAILYバージョンは、シンプルで焦点を絞った読み取りを提供するために意図的にD1チャートのみに限定されていましたが、PROバージョンでは同じ哲学を完全なマルチタイムフレーム構造へと拡張し、チャートのタイムフレームに動的に適応できるようになっています。 これはエントリーインジケーターではありません。 これはクラシックなオシレーターではありません。 TREND VISION PROは、市場が本当に方向性の優位性を提供しているタイミングと、反対にトレード活動が統計的に不利であるタイミングを定義するための、プロフェッショナルなコンテキストツールです。 基本理念 TREND VISION PROの基
MA Extremes   は、市場をより明確に、より素早く、より整理された形で読み取りたい人のために設計された、MetaTrader 用のプロフェッショナルなインジケーターです。その目的は、チャートを完全な分析マップに変え、サポート、レジスタンス、重要エリア、移動平均線、視覚的な確認要素を組み合わせることで、トレーダーが価格の動きをより良く解釈し、市場の重要なゾーンをより意識的に把握できるようにすることです。 MA Extremes   の中核には、高度な分析システムがあります。これは、さまざまな市場要因、トレンド構造、価格の動き、内部確認を組み合わせることで、よりクリーンで選別されたチャートの読み取りを実現します。チャート上に表示される矢印はランダムなものではなく、単一の要素だけに依存しているわけでもありません。全体的な市場状況をより深く評価した結果として表示されます。これにより、本当に注目すべき場面に集中したいトレーダーにとって、状況をより適切に絞り込める便利なツールとなっています。 MA Extremes   は、チャート上に 2 本の移動平均線を直接表示し、分析されたエリア内
ATR GRID EA こんにちは、トレーダーの皆様。 ATR GRID EA   は、明確に定義された市場環境の中で、規律・精度・構造化されたロジックによって稼働するよう設計された Expert Advisor です。 このシステムの強みは、ひとつの中心的要素にあります。それが   ATR   です。 ATR GRID EA   は、ATR を通じて市場のボラティリティを読み取ることを軸に開発されており、これがロジックの中核を成しています。本システムは、 強いトレンド   が存在する場面でチャンスを探し、エントリーに適したタイミングを慎重に選択します。不要な取引を無理に行うためのものではなく、市場がその構造に合致した条件を示した時にのみ稼働します。 無作為に取引はしません。 市場ノイズを追いかけません。 根拠なくエントリーしません。 ATR GRID EA は、適切な状況を検出したときにのみ待機し、分析し、行動します。 その運用構造は   grid   ロジックに基づいていますが、ひとつ非常に重要な点を明確にしておく必要があります。 マーチンゲールは使用しません 。 つまり、このシス
フィルタ:
レビューなし
レビューに返信