TD Sequential By Tom Demark MT4
- Indicatori
- Versione: 1.2
- Attivazioni: 5

If you are unsure how to use this indicator, please feel free to reach out to me. I will explain it to you and provide reading materials to help you make the most of it.
Here’s a brief description of how to use the indicator effectively.
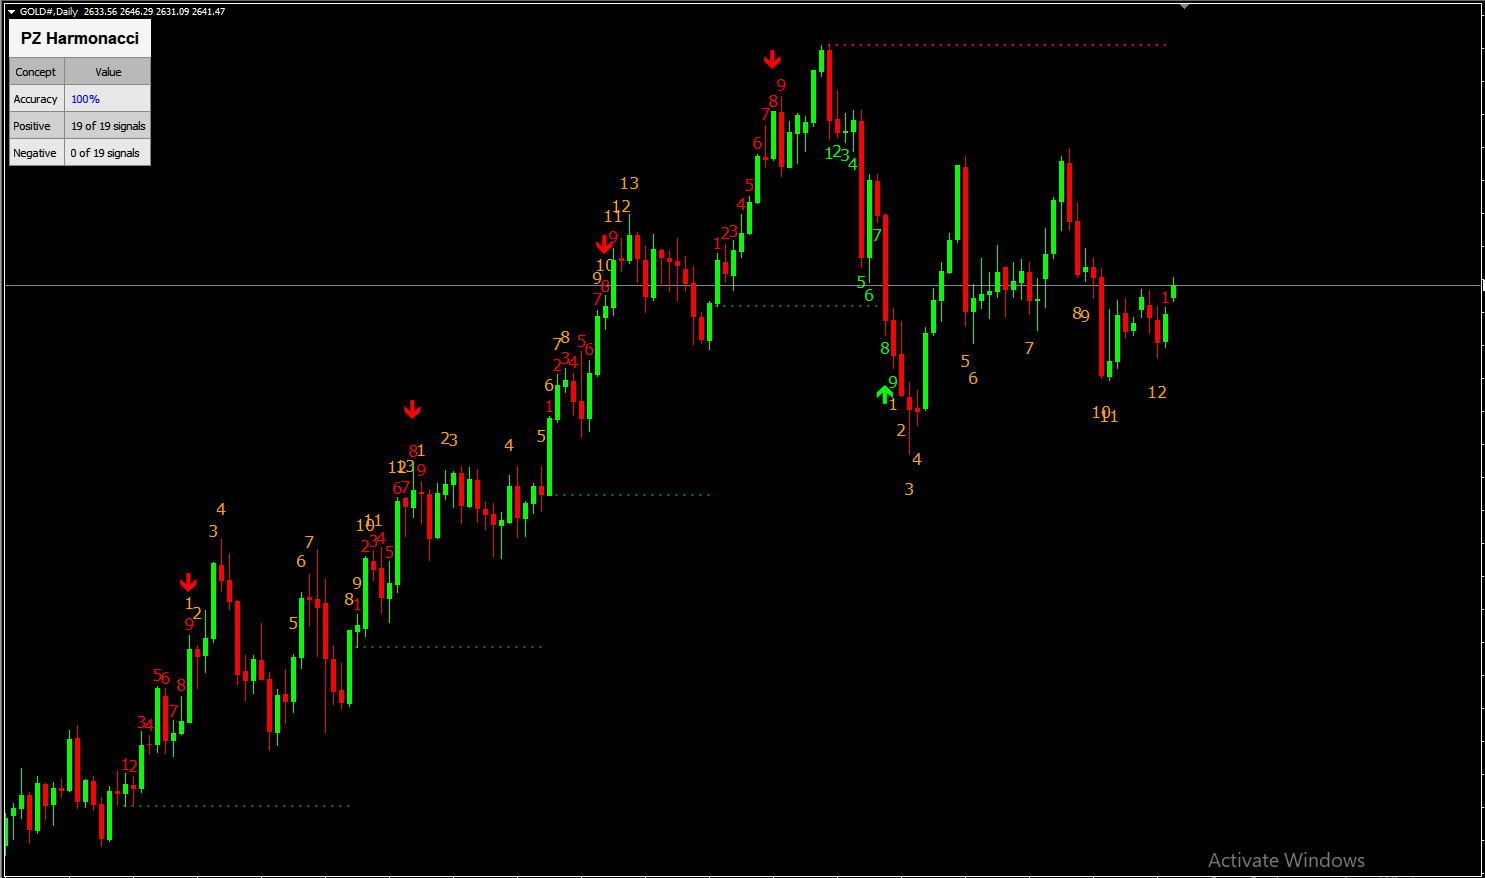
How to Use TD Sequential by Tom DeMark
The TD Sequential is a technical analysis indicator developed by Tom DeMark, designed to identify potential turning points in market trends. It is widely used by traders to anticipate market reversals and manage trading risk effectively. Here’s a breakdown of how to use the TD Sequential:
1. Understand the Components
The TD Sequential is made up of two primary phases:
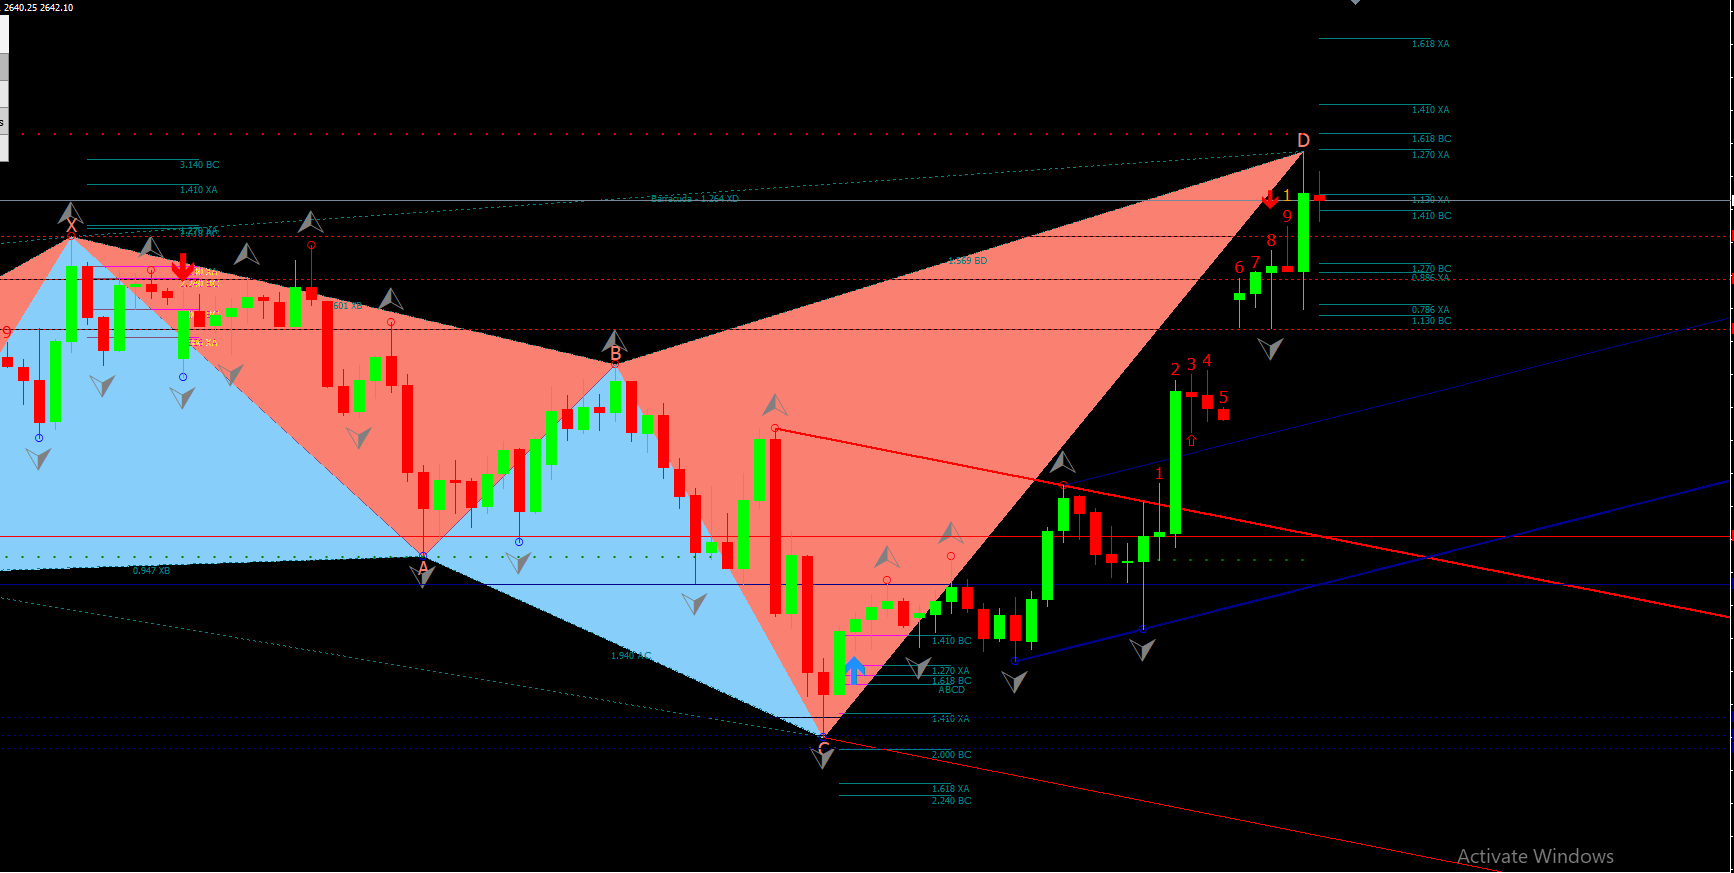
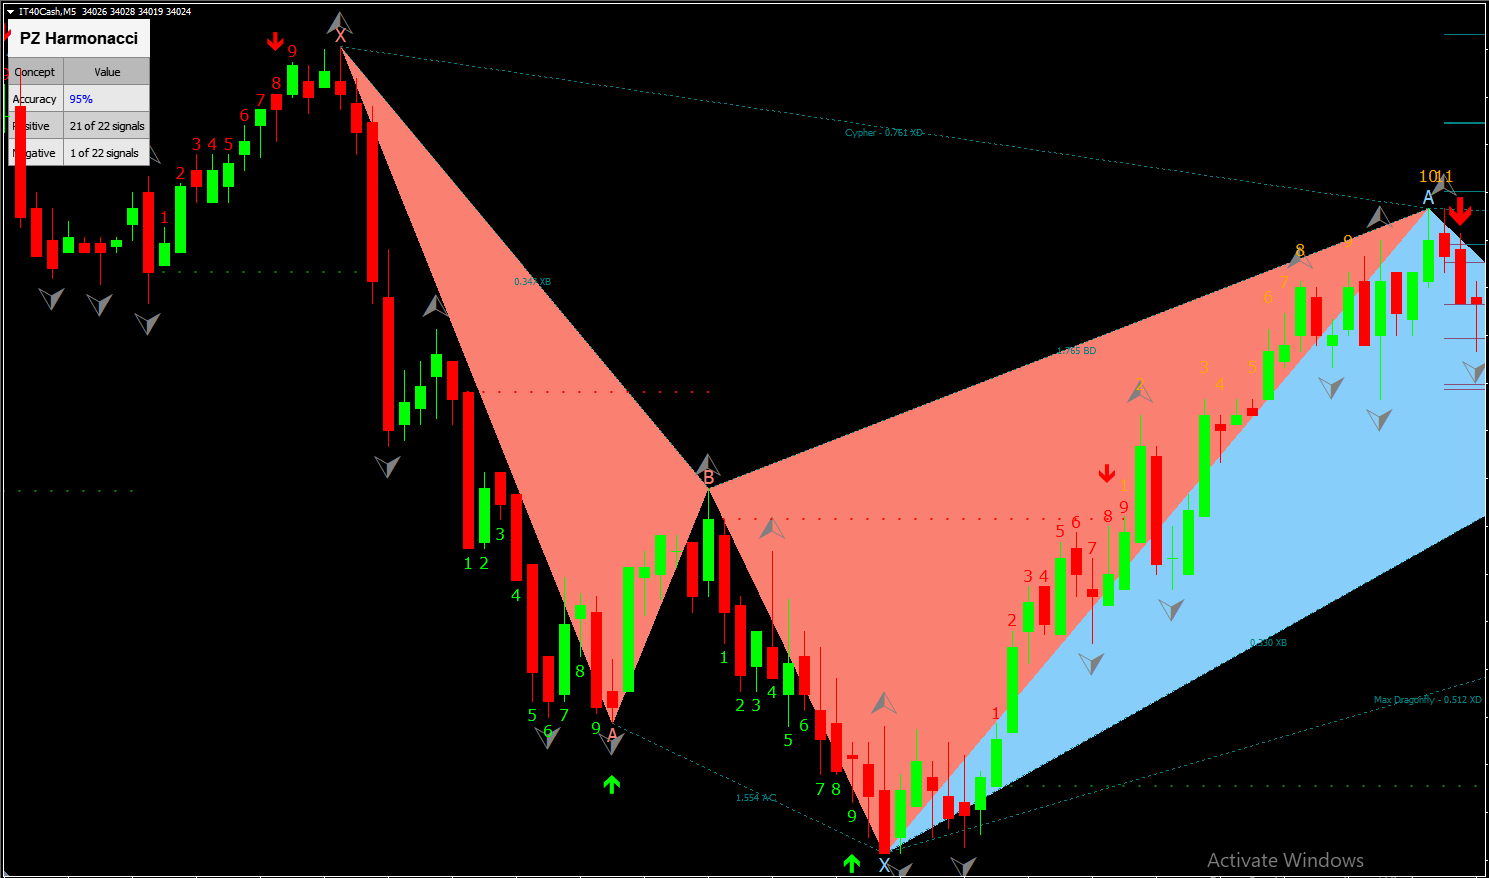
- TD Setup: Consists of 9 consecutive bars, each meeting specific criteria to suggest a trend continuation or exhaustion.
- TD Countdown: Consists of 13 bars following the Setup phase, aiming to pinpoint when a reversal is likely.
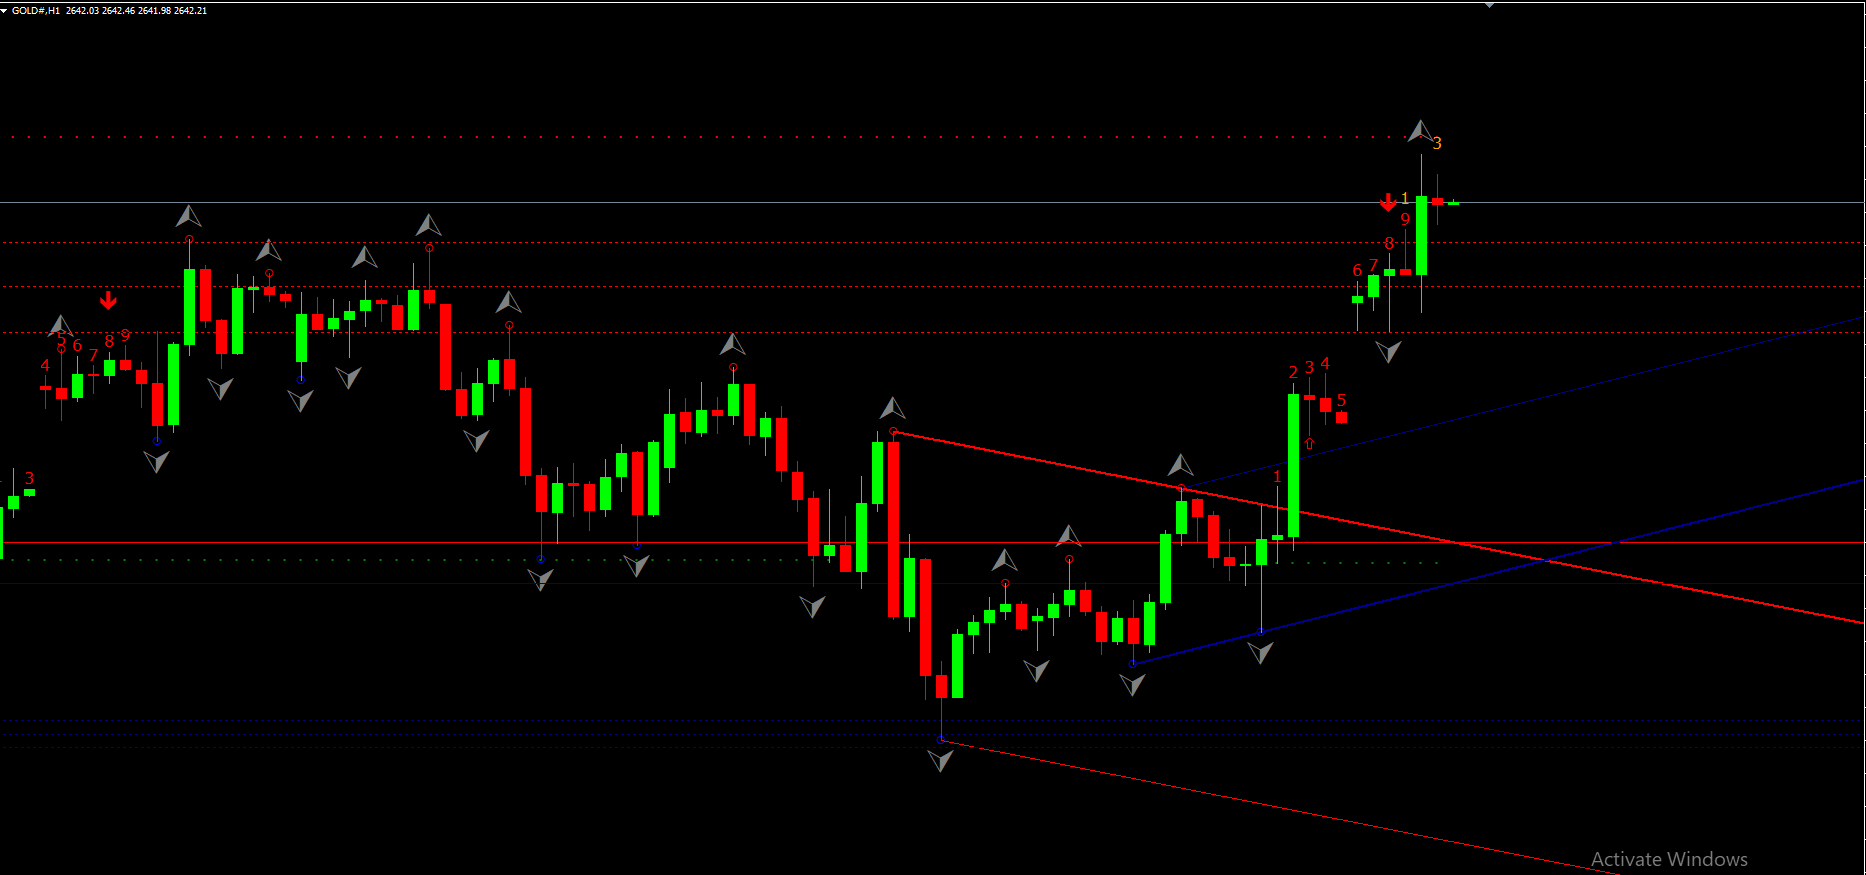
2. The TD Setup Phase
- Look for 9 consecutive candles where:
- For a Bullish Setup, each candle closes higher than the close of four candles prior.
- For a Bearish Setup, each candle closes lower than the close of four candles prior.
- When a setup is complete (the 9th bar), it indicates potential trend exhaustion but does not confirm a reversal.
3. The TD Countdown Phase
- Begins after a completed TD Setup.
- Look for 13 additional candles where:
- For a Bullish Countdown, each candle closes lower than the low of two candles prior.
- For a Bearish Countdown, each candle closes higher than the high of two candles prior.
- A completed TD Countdown signals a high probability of trend reversal.
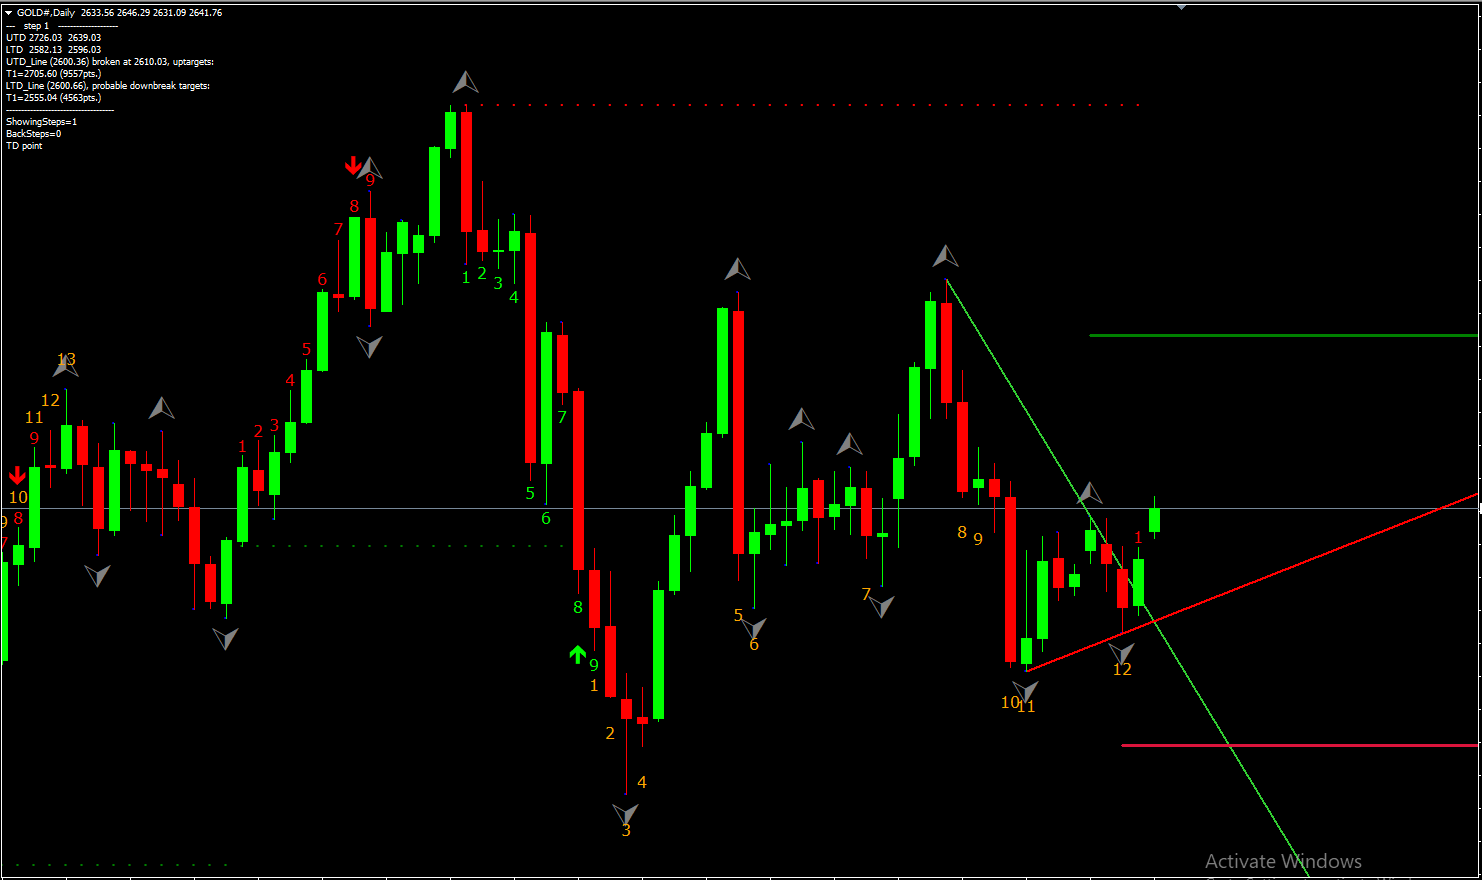
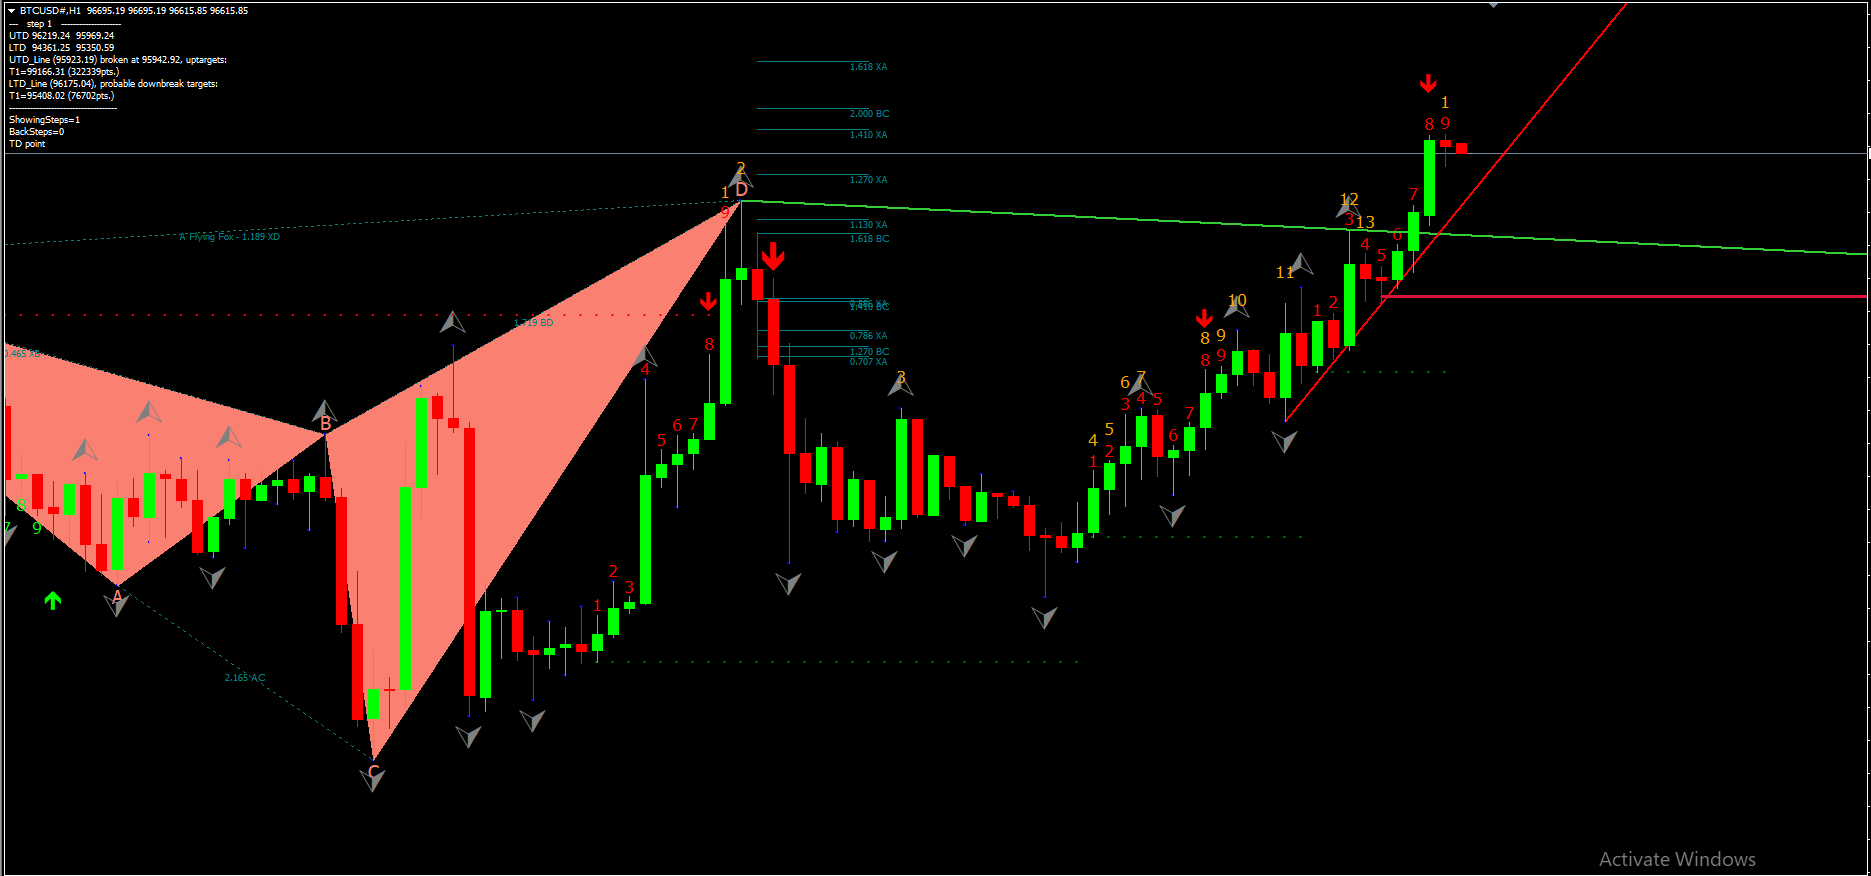
4. Trading Signals
- Entry Points:
- Enter long at the end of a Bearish Countdown if other indicators support a bullish reversal.
- Enter short at the end of a Bullish Countdown if other indicators confirm bearish pressure.
- Stop Loss:
- Place stops beyond the recent swing high (for short positions) or swing low (for long positions).
L'utente non ha lasciato alcun commento sulla valutazione.