Advanced Range Analyzer Pro

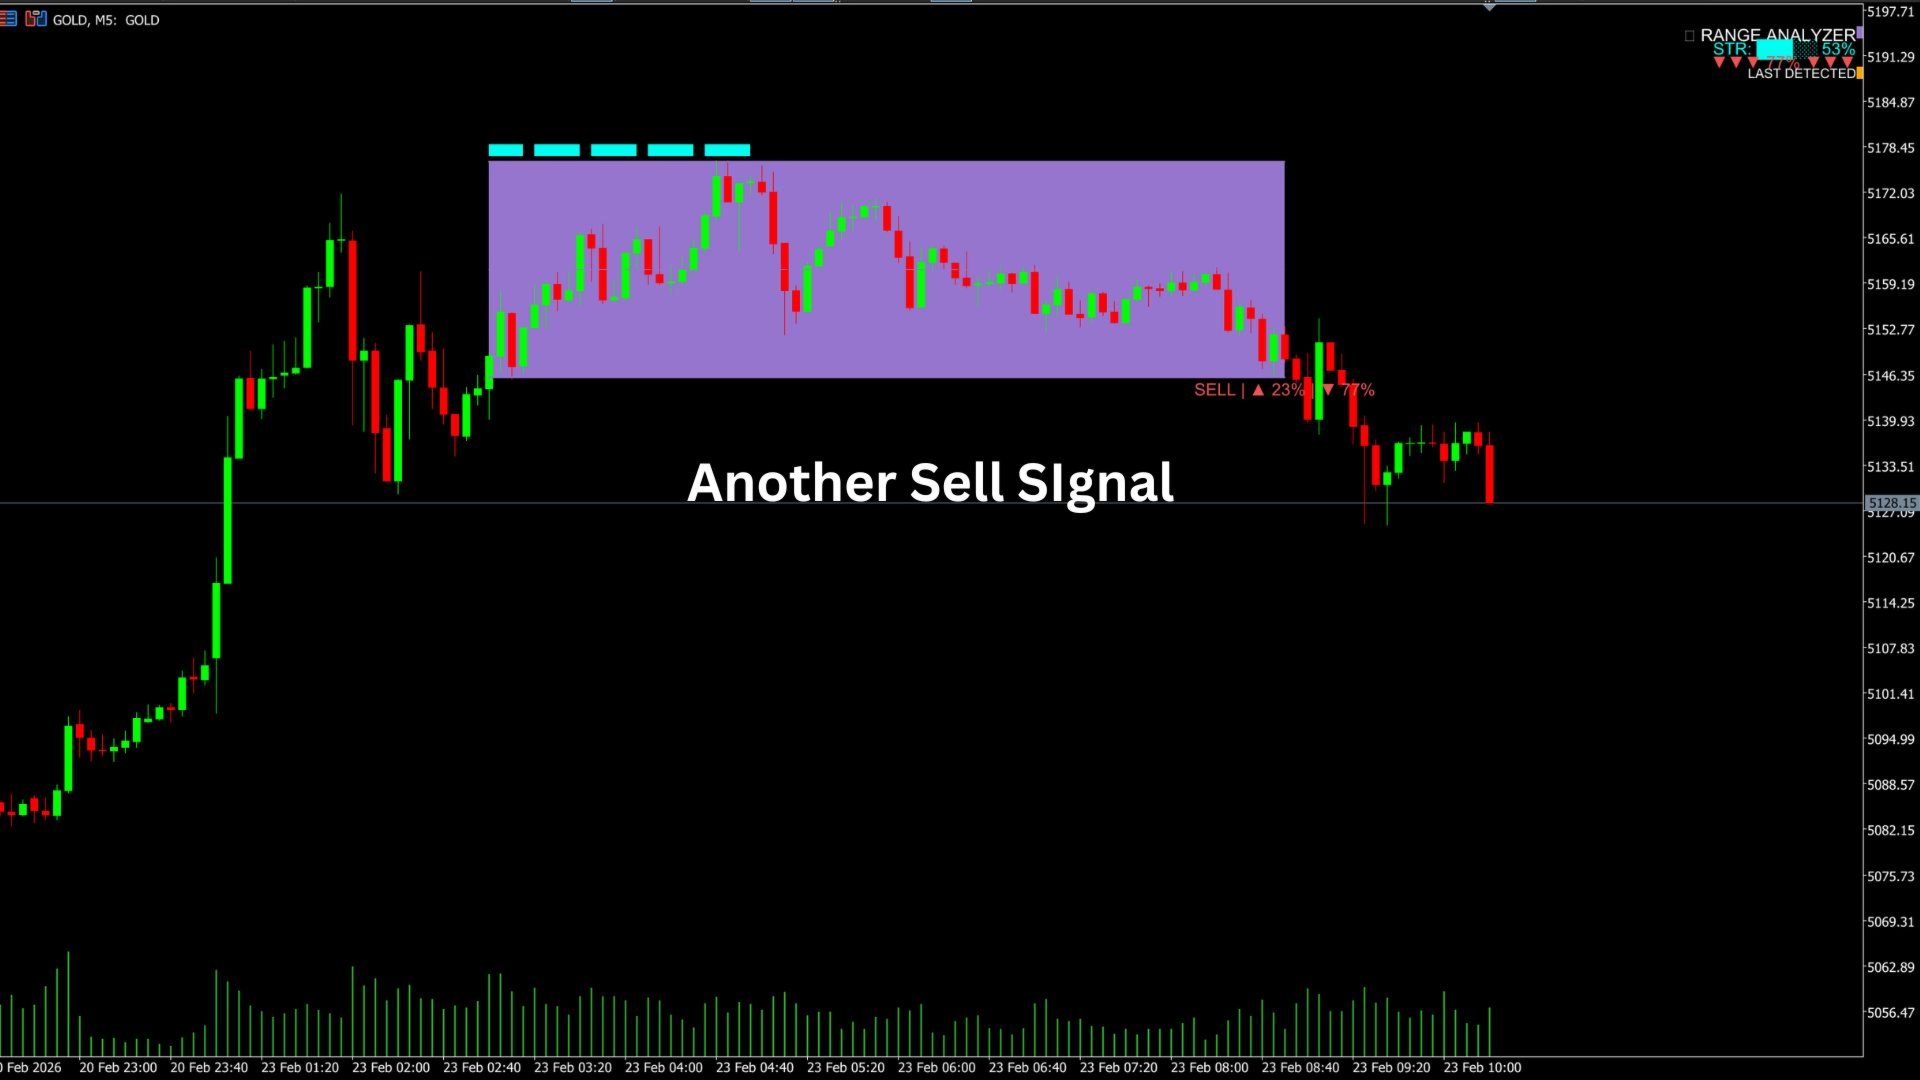
Advanced Range Analyzer Pro – Smart Range Breakout & Probability Indicator

Advanced Range Analyzer Pro is a powerful volatility-based range detection tool designed to identify high-probability consolidation zones before explosive breakouts occur.

Using ATR, RSI, MACD, and volume-weighted price dynamics, this indicator automatically:

✔ Detects and draws clean, non-overlapping consolidation ranges
✔ Measures real-time Range Strength (compression & accumulation analysis)
✔ Calculates Bullish vs Bearish Breakout Probability (%)
✔ Highlights breakout intensity with dynamic color transitions
✔ Displays an easy-to-read smart dashboard panel

Perfect for:
• Breakout traders
• Scalpers
• Range traders
• Smart money & volatility traders

Instead of guessing when a range will break, Advanced Range Analyzer Pro shows you:

  • How strong the range is

  • Which side has higher probability

  • When momentum and volume align

  • When breakout pressure is building

Fully automated. No repainting. Works on all symbols and timeframes.

Trade ranges with confidence. Catch breakouts before they happen.


Prodotti consigliati
Xtrade Trend Detector
Dago Elkana Samuel Dadie
Xtrade Trend Detector is an indicator capable of finding the best opportunities to take a position in any stock market. Indeed, it is a great tool for scalpers but also for Daytraders. You could therefore use it to identify areas to trade, it fits easily on a chart. I use it to detect trends on Big timeframes and take positions on Small timeframes. Don't hesitate to give me a feedback if you test it.
Optimized Spike Detector Pro for MT5 is a professional-grade technical indicator designed to identify and capitalize on sharp, impulsive price movements (spikes) in any financial instrument. Utilizing a sophisticated, multi-algorithmic core, it distinguishes significant volatility expansions from market noise with exceptional accuracy. The tool dynamically adapts to changing market conditions, filtering out false signals and highlighting only high-probability spike setups in real-time. Featuring
Congestion Breakout MT5
CARLO FINANCIAL SOFTWARE TECHNOLOGY LLC
3 (1)
Vi proponiamo "Congestion Breakout MT5", l'indicatore che vi aiuta a identificare le zone di congestione nel vostro grafico e vi avvisa quando il prezzo le attraversa. I trader sanno che le zone di congestione possono essere aree chiave dell'azione dei prezzi e indicare potenziali punti di svolta nel mercato. Tuttavia, individuare queste zone e anticipare i breakout può essere un compito difficile e dispendioso in termini di tempo. È qui che entra in gioco "Congestion Breakout".   Questo potente
MasterCharts
Alexander Berger
You can think of these indicators as moving pivot points. MasterChartsTrading Price Action Indicators show good price levels to enter or exit a trade. The Blue indicator line serves as a Bullish Trend setter. If your instrument closes above the Blue line, we think about going Long (buying). When your trading instrument closes below the Red line, we think about Shorting (selling). It is very easy to read price action if you have a reference point. These support/resistance lines are there to help
Wa Candle Timer Percentage MT5
Wachinou Lionnel Pyrrhus Sovi Guidi
Wa Candle Timer Percentage MT5 is an indicator which shows the user how much time is remaining until the next candle will form. The percentage of the evolution of the current candle is also displayed. The user can set the percentage that the candle timer will change the color. These are the settings: 1- The percentage that the candle timer will change the color. 2- Color of Candle Timer when it's BELOW the percentage set by the user. 3- Color of Candle Timer when it's ABOVE the percentage set b
FREE
Smart Money Structure & Precision Trading Indicator (MT5) Smart Money Structure & Precision Trading Indicator  is a powerful Smart Money Concepts (SMC) indicator for MetaTrader 5, designed to help traders identify high-probability entries with institutional logic . This indicator automatically detects market structure in real time , highlights key liquidity levels , and provides clear, non-repainting signals so you can trade with confidence and precision. Whether you are a scalper, day trader, o
The Candlestick Patterns indicator for MT5 includes 12 types of candlestick signales in only one indicator. - DoubleTopsAndBottoms - SmallerGettingBars - BiggerGettingBars - ThreeBarsPlay - TwoBarsStrike - Hammers - InsideBars - OutsideBars - LongCandles - TwoGreenTwoRed Candles - ThreeGreenThreeRed Candles The indicator creats a arrow above or under the signal candle and a little character inside the candle to display the type of the signal. For long candles the indicator can display the exact
A lot of professional traders use high quality divergence signals as a part of their strategy to enter a position. Spotting correct divergences quickly can often be hard, especially if your eye isn’t trained for it yet. For this reason we’ve created a series of easy to use professional oscillator divergence indicators that are very customisable so you get only the signals you want to trade. We have this divergence indicator for RSI, MACD, Stochastics, CCI and OBV. RSI:   https://www.mql5.com/en/
Questo indicatore è un indicatore per l'analisi automatica delle onde perfetto per il trading pratico! Caso... Nota:   non sono abituato a usare nomi occidentali per la classificazione delle onde a causa dell'influenza della convenzione di denominazione di Tang Lun (Tang Zhong Shuo Zen), ho chiamato l'onda base come   penna   e la banda dell'onda secondaria come   segmento   At allo stesso tempo, il segmento ha la direzione del trend. La denominazione   è principalmente segmento di trend   (que
Over Trend MT5
Mansour Babasafary
Trend based indicator Identify trends with this indicator A simple-to-use trend indicator No complicated settings Attributes: Can be used in all symbols Can be used in all time frames Relatively high signals No complicated settings Specific to the trend Lifetime support Settings: Alarm Show Alert: By activating these settings, after receiving the signal, you will receive an alarm in Metatrader Alarm Show Notification: By activating these settings, after receiving the signal, you will receive a
First Dawn MT5
Innovicient Limited
The First Dawn indicator uses a unique mechanism to search and plot signals. This keeps searching for signals, making it a great indicator for scaping and identification of changes in direction, swing trading and trend trading. The    First Dawn     helps you get early signals. The backtest gives the true picture of how the indicator works with real/demo accounts. Although this is a tiny indicator it is packed with advantageous settings that will help you whether you desire to: Snap the Peaks a
Get Trend
Vitalii Zakharuk
The Get Trend indicator was created to neutralize temporary pauses and rollbacks. It analyzes the behavior of the price and, if there is a temporary weakness of the trend, you can notice this from the indicator, as in the case of a pronounced change in the direction of the trend. Currency pairs never rise or fall in a straight line. Their rises and falls are interspersed with pullbacks and turns. Every growth and every fall is reflected in your emotional state: hope is replaced by fear, and wh
ACB Breakout Arrows Scanner MT5
KEENBASE SOFTWARE SOLUTIONS
Questo è uno scanner multi-simbolo e multi-timeframe per il nostro indicatore ACB Breakout Arrows . Con le impostazioni predefinite, analizza i segnali di acquisto/vendita su 28 coppie di valute e 9 timeframe contemporaneamente .  Caratteristiche Può analizzare 252* combinazioni di simboli e timeframe da un singolo grafico. Apre il grafico del segnale con un modello predefinito con un solo clic.  Facile da spostare ovunque sul grafico tramite drag and drop. Avvisi in tempo reale tramite popup,
the fundamental technical indicator Informative Trend, which allows you to assess the current market situation in order to enter the market of the selected currency pair in a trend and with minimal risk. It basically uses the process of identifying the rate of change in price growth and allows you to find entry and exit points from the market. The indicator was created on the basis of the original indicators for searching for extreme points and is well suited for determining a reversal or a la
ZIVA TrendX
Hassan Abdullah Hassan Al Balushi
ZIVA TrendX is a professional trend-oriented indicator engineered to provide a clear and structured assessment of market direction through a cloud-based analytical framework. The indicator analyzes price behavior relative to dynamically derived trend boundaries, forming a continuous cloud structure that visually represents the prevailing market bias. This structure enables traders to maintain alignment with dominant directional conditions while filtering short-term market noise. All internal ca
Visual Wave Dolphin Indicator
AL MOOSAWI ABDULLAH JAFFER BAQER
Visual Wave Dolphin Indicator: Ride the True Waves of the Market Tired of chaotic charts and confusing signals? The Visual Wave Dolphin Indicator is your solution to cutting through market noise and identifying high-probability trading opportunities with stunning clarity. Designed for traders of all levels, this powerful tool transforms complex price action into a simple, elegant wave, allowing you to visualize market trends and catch turning points before they happen. For just $30, you can equ
Climax Hunter
Van Cuong Nguyen
Climax Hunter – INSTITUTIONAL MOVES AND SHARKS TOO BIG TO HIDE Climax Hunter is a professional trading indicator designed to detect accumulation zones and institutional actions. It hunts for institutional Buying Climax and Selling Climax points—critical moments when institutions and "sharks" manipulate liquidity and reverse the market. This tool helps traders see when sharks are manipulating prices, while also identifying market exhaustion, avoiding false breakout signals, and trading in the
FREE
Supertrend indicator uses a combination of a moving average and average true range to detect the trend of a trading instrument. Supertrend indicator for MetaTrader 5 easily shows the trend as a line following the price. Triple SuperTrend Histo indicator  calculate  three supertrends to show the trend as a histogram. Changing the color from red to green means you can BUY , from green to red means you can SELL . Description of the method of drawing a histogram. The price is above the EMA 200,
Rectangle Detector Alert About Rectangle Detector Alert Indicator Rectangle detector alert detects manually drawn rectangle shapes on charts and sends out push notifications also auto extending the rectangles at the same time as new candles form. The concept behind this indicator is based on the manual trading of supply and demand zones. Most  traders prefer  to draw their supply (resistance) and demand (support) zones manually instead of  depending on indicators to auto draw  the zones.
Adaptive Reversal Star   is a new generation indicator with an   advanced Adaptive algorithm , which additionally tracks potential reversal points and compares the values of the current market volatility when forming the main signals of the indicator.It provides accurate signals in real time without delays and redraws.Adaptive Reversal Star does not require any complex settings and additional calculations, just set it to the desired timeframe and select the parameter - Signal Filter. Why choose
Visual Trend Reversals — Professional Trend Reversal Indicator for MetaTrader 5 Visual Trend Reversals is a modern and efficient indicator for MetaTrader 5, specifically designed for the timely identification of trend reversal points and analysis of market conditions on any instrument: forex, cryptocurrencies, stocks, indices, and commodities. The indicator is optimized to improve entry quality, minimize false signals, and maximize clarity for traders of any experience level. Key Advantages of V
Rainbow EA MT5
Jamal El Alama
Description : Rainbow EA MT5 is a simple Expert advisor based on   Rainbow MT5 indicator witch is based on Moving average with period 34. The indicator is incorporated in the EA, therefore, it is not required for the EA to operate, but if you wish, you can download it from   my product page . The Expert Advisor settings are as follows : Suitable for Timeframes up to H1 The parameters below can be set according to your trading rules. StopLoss ( Stop Loss in pips) TakeProfit ( Take Profit in pips
Stochastic Dashboard PRO – Multi-Timeframe Trend & Signal Analyzer Short Description: A professional Stochastic Dashboard that displays %K and %D values across multiple timeframes, highlighting overbought/oversold conditions for quick trend analysis. Perfect for traders seeking clarity and speed. Full Description: The Stochastic Dashboard PRO is a powerful tool designed for traders who want instant access to multi-timeframe stochastic signals without switching charts. It displays %K and %D val
Indicatore Timer Prezzo Bid — Tempismo di Precisione e Tracciamento Intelligente del Prezzo! Porta la tua precisione nel trading al livello successivo con l’ Indicatore Timer Prezzo Bid — uno strumento potente progettato per i trader che valorizzano tempismo, precisione e chiarezza in ogni movimento. Caratteristiche principali: Display Timer Fisso – Sempre visibile sul lato destro del grafico (X_Offset personalizzabile). Tracciamento Dinamico del Prezzo – Il timer si muove flui
Rejection Block
Usiola Oluwadamilol Olagundoye
5 (1)
The "Rejection Block" MetaTrader 5 Indicator offers traders a comprehensive tool for identifying and visualizing rejection candlestick patterns, commonly known as rejection blocks. These patterns are pivotal in discerning potential market reversals or continuations, making them invaluable for traders seeking to enhance their analysis. Key Features: Rejection Block Detection: The indicator diligently scans price data, pinpointing instances of rejection candlestick patterns. These patterns typical
FREE
The Swing High Low and Fibonacci Retracement Indicator is a powerful technical analysis tool designed to identify key price levels and potential reversal zones in the market. It automatically detects recent swing highs and swing lows on the chart and overlays Fibonacci retracement levels based on these points. This indicator helps traders: Visualize market structure by highlighting recent swing points. Identify support and resistance zones using Fibonacci ratios (e.g., 38.2%, 50%, 61.8%). Adapt
Visual Dragon Cloud Indicator
AL MOOSAWI ABDULLAH JAFFER BAQER
The Visual Dragon Cloud Indicator is a powerful and unique tool designed to provide traders with deep insights into market behavior. Priced at $65, it offers a robust framework for understanding price dynamics through its sophisticated strategy, while allowing users to optimize and customize it to fit their unique trading styles. Please note: this indicator is not optimized and is intentionally crafted for you to fine-tune it for your personal trading approach. Strategy and Logic Behind the Ind
EngulfingDetector
Jemy Yeferson Dimu Ludji
Unleash the Power of Precision Trading with Engulfing Detector ! Are you struggling to spot high-probability reversal patterns on your charts? Say goodbye to guesswork and hello to accuracy with Engulfing Detector ! Why Choose Engulfing Detector? Automated Detection : Instantly identifies Bullish and Bearish Engulfing patterns with pinpoint accuracy. Visual Alerts : Clear arrows mark potential entry points, so you never miss a trading opportunity. User-Friendly : Designed for traders of all l
Skiey
Vitalii Zakharuk
Skiey - Indicator of easy solutions! Using this indicator is very simple, since the simplest is to look at the chart and act according to the color arrows. Such a calculation option takes into account intraday price fluctuations and focuses on measuring the "candlestick" share in the trend. The algorithm takes into account the measurement of prices, this method also emphasizes the measurement of each of the price drops (H / C, H / O, LC, LO) - which gives more detailed information but also mor
Introduction to Fractal Pattern Scanner Fractal Indicator refers to the technical indicator that makes use of the fractal geometry found in the financial market. Fractal Pattern Scanner is the advanced Fractal Indicator that brings the latest trading technology after the extensive research and development work in the fractal geometry in the financial market. The most important feature in Fractal Pattern Scanner is the ability to measure the turning point probability as well as the trend probabil
Gli utenti di questo prodotto hanno anche acquistato
SuperScalp Pro
Van Minh Nguyen
4.72 (18)
SuperScalp Pro – Sistema avanzato di indicatore per scalping con filtri multipli SuperScalp Pro è un sistema avanzato di indicatore per scalping che combina il classico Supertrend con molteplici filtri di conferma intelligenti. L’indicatore funziona in modo efficiente su tutti i timeframe da M1 a H4 ed è particolarmente adatto per XAUUSD, BTCUSD e le principali coppie Forex. Può essere utilizzato come sistema stand-alone o integrato in modo flessibile nelle strategie di trading esistenti. L’indi
Entry In The Zone and SMC Multi Timeframe is a real-time 2-in-1 market analysis tool that combines market structure analysis and a No Repaint BUY / SELL signal system into a single indicator, built on Smart Money Concepts (SMC) — a widely adopted framework used by professional traders to understand market structure. This indicator helps you see the market more clearly, make decisions based on structure rather than guesswork, and focus on high-probability zones where price is more likely to react
Divergence Bomber
Ihor Otkydach
4.9 (86)
Ogni acquirente dell’indicatore riceverà inoltre gratuitamente: L’utilità esclusiva “Bomber Utility”, che gestisce automaticamente ogni operazione, imposta i livelli di Stop Loss e Take Profit e chiude le posizioni secondo le regole della strategia I file di configurazione (set file) per adattare l’indicatore a diversi asset I set file per configurare il Bomber Utility in tre modalità: “Rischio Minimo”, “Rischio Bilanciato” e “Strategia di Attesa” Una guida video passo-passo per installare, conf
Azimuth Pro
Ottaviano De Cicco
5 (6)
Azimuth Pro V2: Synthetic Fractal Structure and Confirmed Entries for MT5 Overview Azimuth Pro is a multi-level swing structure indicator by Merkava Labs . Four nested swing layers, swing-anchored VWAP, ABC pattern detection, three-timeframe structural filtering, and closed-bar confirmed entries — one chart, one workflow from micro-swings to macro-cycles. This is not a blind signal product. It is a structure-first workflow for traders who care about location, context, and timing. V2 Launch Offe
OmniSync Projection
Antonio-alin Teculescu
5 (1)
Chronos Fractal Engine is an innovative price projection indicator for MetaTrader 5, designed to transform your technical analysis by intelligently identifying and projecting historical price patterns. Built upon an advanced correlation algorithm and the fractal principles of the market, this powerful tool visualizes potential future price movements, giving you a unique edge in your trading decisions. What is Chronos Fractal Engine? At its core, the Chronos Fractal Engine employs a sophisticat
Se acquisti questo indicatore, riceverai il mio Trade Manager Professionale + EA  GRATUITAMENTE. Innanzitutto è importante sottolineare che questo sistema di trading è un indicatore Non-Repainting, Non-Redrawing e Non-Lagging, il che lo rende ideale sia per il trading manuale che per quello automatico. Corso online, manuale e download di preset. Il "Sistema di Trading Smart Trend MT5" è una soluzione completa pensata sia per i trader principianti che per quelli esperti. Combina oltre 10 indicat
Trend Screener Pro MT5
STE S.S.COMPANY
4.85 (104)
Indicatore di tendenza, soluzione unica rivoluzionaria per il trading di tendenze e il filtraggio con tutte le importanti funzionalità di tendenza integrate in un unico strumento! È un indicatore multi-timeframe e multi-valuta al 100% non ridipingibile che può essere utilizzato su tutti i simboli/strumenti: forex, materie prime, criptovalute, indici e azioni. Trend Screener è un indicatore di tendenza che segue un indicatore efficiente che fornisce segnali di tendenza a freccia con punti nel gra
Meridian Pro
Ottaviano De Cicco
5 (1)
Meridian Pro: Professional Multi-Timeframe Trend Matrix for MT5 Overview Meridian Pro is a multi-timeframe trend matrix by Merkava Labs that compresses directional state, strength, momentum condition and matrix agreement into one compact panel. One adaptive engine, applied consistently from M1 to W1. No per-symbol tuning. No indicator stacking. One structured readout across every asset and every timeframe. Launch Offer — Get Meridian Pro for USD 99 (introductory). Regular price: USD 149. 1. Why
Quantum TrendPulse
Bogdan Ion Puscasu
5 (22)
Ecco   Quantum TrendPulse   , lo strumento di trading definitivo che combina la potenza di   SuperTrend   ,   RSI   e   Stocastico   in un unico indicatore completo per massimizzare il tuo potenziale di trading. Progettato per i trader che cercano precisione ed efficienza, questo indicatore ti aiuta a identificare con sicurezza le tendenze di mercato, i cambiamenti di momentum e i punti di entrata e uscita ottimali. Caratteristiche principali: Integrazione SuperTrend:   segui facilmente l'andame
Btmm state engine pro
Garry James Goodchild
5 (3)
BTMM State Engine Pro is a MetaTrader 5 indicator for traders who use the Beat The Market Maker approach: Asian session context, kill zone timing, level progression, peak formation detection, and a multi-pair scanner from a single chart. It combines cycle state logic with a built-in scanner dashboard so you do not need the same tool on many charts at once. What it does Draws the Asian session range; session times can follow broker server offset or be set in inputs. Tracks level progression (L
FX Trend MT5 NG
Daniel Stein
5 (4)
FX Trend NG: La Nuova Generazione di Intelligenza di Trend Multi-Mercato Panoramica FX Trend NG è uno strumento professionale di analisi del trend multi-timeframe e monitoraggio dei mercati. Ti consente di comprendere la struttura completa del mercato in pochi secondi. Invece di passare tra numerosi grafici, puoi identificare immediatamente quali strumenti sono in trend, dove il momentum sta diminuendo e dove esiste un forte allineamento tra i timeframe. Offerta di Lancio – Ottieni FX Trend NG
Gann Made Easy è un sistema di trading Forex professionale e facile da usare che si basa sui migliori principi del trading utilizzando la teoria di mr. WD Gann. L'indicatore fornisce segnali ACQUISTA e VENDI accurati, inclusi i livelli di Stop Loss e Take Profit. Puoi fare trading anche in movimento utilizzando le notifiche PUSH. CONTATTAMI DOPO L'ACQUISTO PER RICEVERE GRATUITAMENTE LE ISTRUZIONI DI TRADING E OTTIMI INDICATORI EXTRA! Probabilmente hai già sentito parlare molte volte dei metodi d
ARICoins
Temirlan Kdyrkhan
ARICoin is a powerful trading companion designed to generate high-probability entry signals with dynamic TP/SL/DP levels based on volatility. Built-in performance tracking shows win/loss stats, PP1/PP2 hits, and success rates all updated live. Key Features: Buy/Sell signals with adaptive volatility bands Real-time TP/SL/DP levels based on ATR Built-in MA Filter with optional ATR/StdDev volatility Performance stats panel (Success, Profit/Loss, PP1/PP2) Alerts via popup, sound, push, or email Cust
Trend indicator AI mt5
Ramil Minniakhmetov
5 (16)
Trend Ai indicator è un ottimo strumento che migliorerà l'analisi di mercato di un trader combinando l'identificazione della tendenza con punti di ingresso utilizzabili e avvisi di inversione. Questo indicatore consente agli utenti di navigare nelle complessità del mercato forex con fiducia e precisione Oltre ai segnali primari, l'indicatore Ai di tendenza identifica i punti di ingresso secondari che si presentano durante i pullback o i ritracciamenti, consentendo ai trader di capitalizzare le
Scopri quale strategia funziona davvero sul tuo simbolo - prima di rischiare denaro reale. Power Bar rileva le barre di prezzo estreme su qualsiasi simbolo e qualsiasi timeframe, poi esegue istantaneamente il backtest di 3 diverse strategie di trading per confrontare tassi di vincita, fattori di profitto e P&L fianco a fianco. Tutto in un unico pannello interattivo. Niente supposizioni. Niente curve-fitting. Solo dati. Cosa rende Power Bar unico? La maggior parte degli indicatori fornisce un se
Atomic Analyst MT5
Issam Kassas
3.94 (31)
Innanzitutto, vale la pena sottolineare che questo indicatore di trading non è repaint, non è ridisegno e non presenta ritardi, il che lo rende ideale sia per il trading manuale che per quello automatico. Manuale utente: impostazioni, input e strategia. L'Analista Atomico è un indicatore di azione del prezzo PA che utilizza la forza e il momentum del prezzo per trovare un miglior vantaggio sul mercato. Dotato di filtri avanzati che aiutano a rimuovere rumori e segnali falsi, e aumentare il pote
Innanzitutto, vale la pena sottolineare che questo Strumento di Trading è un Indicatore Non-Ridipingente, Non-Ridisegnante e Non-Laggante, il che lo rende ideale per il trading professionale. Corso online, manuale utente e demo. L'Indicatore Smart Price Action Concepts è uno strumento molto potente sia per i nuovi che per i trader esperti. Racchiude più di 20 utili indicatori in uno solo, combinando idee di trading avanzate come l'Analisi del Trader del Circolo Interno e le Strategie di Tradin
Crystal Heikin Ashi Signals
Muhammad Jawad Shabir
5 (2)
Crystal Heikin Ashi Signals - Professional Trend & Signal Detection Indicator Advanced Heikin Ashi Visualization with Intelligent Signal System for Manual & Automated Trading Final Price: $149 ---------> Price goes up $10 after every 10 sales . Limited slots available — act fast . Overview Crystal Heikin Ashi Signals is a professional-grade MetaTrader 5 indicator that combines pure Heikin Ashi candle visualization with an advanced momentum-shift detection system. Designed for both manual traders
FX Power MT5 NG
Daniel Stein
5 (31)
FX Power: Analizza la Forza delle Valute per Decisioni di Trading Più Intelligenti Panoramica FX Power è lo strumento essenziale per comprendere la reale forza delle principali valute e dell'oro in qualsiasi condizione di mercato. Identificando le valute forti da comprare e quelle deboli da vendere, FX Power semplifica le decisioni di trading e rivela opportunità ad alta probabilità. Che tu segua le tendenze o anticipi inversioni utilizzando valori estremi di Delta, questo strumento si adatta
Auto Optimized Parabolic RSI: Motore di Momentum 3D Avanzato La maggior parte degli indicatori per trader privati fallisce perché si affida a parametri statici che smettono di funzionare nel momento in cui la volatilità del mercato cambia. Auto Optimized Parabolic RSI risolve il problema dell'"obsolescenza dell'indicatore" ricalcolando continuamente il proprio vantaggio matematico, portando un adattamento quantitativo di livello istituzionale direttamente sul tuo terminale MT5. Il Vantaggio Prin
Bill Williams Advanced
Siarhei Vashchylka
5 (11)
Bill Williams Advanced is designed for automatic chart analysis using Bill Williams' "Profitunity" system. The indicator analyzes four timeframes at once. Manual (Be sure to read before purchasing) Advantages 1. Analyzes the chart using Bill Williams' "Profitunity" system. Signals are displayed in a table in the corner of the screen and on the price chart. 2. Finds all known AO and AC signals, as well as zone signals. Equipped with a trend filter based on the Alligator. 3. Finds "Divergence Bar
Weltrade Spike Sentinel
Batsirayi L Marango
5 (1)
Introducing Indicator for PainX and GainX Indices Traders on Weltrade Get ready to experience the power of trading with our indicator, specifically designed for Weltrade   broker's PainX and GainX Indices.  Advanced Strategies for Unbeatable Insights Our indicator employs sophisticated strategies to analyze market trends, pinpointing optimal entry and exit points.  Optimized for Maximum Performance To ensure optimal results, our indicator is carefully calibrated for 5-minute timeframe charts on
RelicusRoad Pro: Sistema Operativo Quantitativo di Mercato 70% DI SCONTO ACCESSO A VITA (TEMPO LIMITATO) - UNISCITI A 2.000+ TRADER Perché la maggior parte dei trader fallisce anche con indicatori "perfetti"? Perché operano su Singoli Concetti isolati. Un segnale senza contesto è una scommessa. Per vincere serve CONFLUENZA . RelicusRoad Pro non è un semplice indicatore. È un Ecosistema Quantitativo completo . Mappa la "Fair Value Road", distinguendo tra rumore e rotture strutturali. Smetti di in
RFI levels PRO MT5
Roman Podpora
3.67 (3)
L'indicatore mostra accuratamente i punti di inversione e le zone di ritorno dei prezzi in cui il       Principali attori   . Vedi dove si formano le nuove tendenze e prendi decisioni con la massima precisione, mantenendo il controllo su ogni operazione. VERSION MT4     -    Rivela il suo massimo potenziale se combinato con l'indicatore   TREND LINES PRO Cosa mostra l'indicatore: Strutture di inversione e livelli di inversione con attivazione all'inizio di un nuovo trend. Visualizzazione dei li
CGE Trading Suite
Carl Gustav Johan Ekstrom
5 (1)
CGE Trading Suite delivers the analytical edge typically reserved for professional trading desks. The platform integrates a full suite of analytical tools into one seamless workflow: dynamic grid mapping, liquidity behavior analysis, ECM, trend lines, MIDAS, trade cycles, and directional channel projections. Together, these provide a unified view of market structure and momentum. Directional clarity is further enhanced by the capital flow index, which measures currency basket strength to identif
Berma Bands
Muhammad Elbermawi
5 (8)
L'indicatore Berma Bands (BBs) è uno strumento prezioso per i trader che cercano di identificare e capitalizzare i trend di mercato. Analizzando la relazione tra il prezzo e le BBs, i trader possono discernere se un mercato è in una fase di trend o di range. Visita il [ Berma Home Blog ] per saperne di più. Le Berma Bands sono composte da tre linee distinte: la Upper Berma Band, la Middle Berma Band e la Lower Berma Band. Queste linee sono tracciate attorno al prezzo, creando una rappresentazion
ARIPoint
Temirlan Kdyrkhan
ARIPoint is a powerful trading companion designed to generate high-probability entry signals with dynamic TP/SL/DP levels based on volatility. Built-in performance tracking shows win/loss stats, PP1/PP2 hits, and success rates all updated live. Key Features: Buy/Sell signals with adaptive volatility bands Real-time TP/SL/DP levels based on ATR Built-in MA Filter with optional ATR/StdDev volatility Performance stats panel (Success, Profit/Loss, PP1/PP2) Alerts via popup, sound, push, or email Cu
Advanced Supply Demand MT5
Bernhard Schweigert
4.53 (15)
La migliore soluzione per qualsiasi principiante o trader esperto! Questo indicatore è uno strumento di trading unico, di alta qualità e conveniente perché abbiamo incorporato una serie di funzionalità proprietarie e una nuova formula. Con questo aggiornamento, sarai in grado di mostrare fusi orari doppi. Non solo potrai mostrare una TF più alta, ma anche entrambe, la TF del grafico, PIÙ la TF più alta: SHOWING NESTED ZONES. Tutti i trader di domanda di offerta lo adoreranno. :) Informazioni imp
PZ Trend Trading MT5
PZ TRADING SLU
3.8 (5)
Capture every opportunity: your go-to indicator for profitable trend trading Trend Trading is an indicator designed to profit as much as possible from trends taking place in the market, by timing pullbacks and breakouts. It finds trading opportunities by analyzing what the price is doing during established trends. [ Installation Guide | Update Guide | Troubleshooting | FAQ | All Products ] Trade financial markets with confidence and efficiency Profit from established trends without getting whip
Trend Hunter MT5
Andrey Tatarinov
5 (4)
Trend Hunter è un indicatore di tendenza per lavorare nei mercati Forex, criptovaluta e CFD. Una caratteristica speciale dell'indicatore è che segue con sicurezza la tendenza, senza cambiare il segnale quando il prezzo supera leggermente la linea di tendenza. L'indicatore non viene ridisegnato; un segnale per entrare nel mercato appare dopo la chiusura della barra. Quando ci si sposta lungo un trend, l'indicatore mostra ulteriori punti di ingresso nella direzione del trend. Sulla base di quest
Altri dall’autore
If you are unsure how to use this indicator, please feel free to reach out to me. I will explain it to you and provide reading materials to help you make the most of it. Here’s a brief description of how to use the indicator effectively. How to Use TD Sequential by Tom DeMark The TD Sequential is a technical analysis indicator developed by Tom DeMark, designed to identify potential turning points in market trends. It is widely used by traders to anticipate market reversals and manage trading ris
This MQL5 indicator, named BoS_ChoCh_Indicator, detects Break of Structure (BoS) and Change of Character (ChoCh) in trading charts. It identifies pivot highs and lows using a user-defined period (default 5), monitors price breakouts above highs or below lows, classifies them as bullish/bearish BoS or ChoCh based on the prevailing trend, draws colored lines and labels on the chart for visualization, and populates buffers with signals, structure levels, and trend direction (1 for up, -1 for down)
If you are unsure how to use this indicator, please feel free to reach out to me. I will explain it to you and provide reading materials to help you make the most of it. Here’s a brief description of how to use the indicator effectively. MT4 version: https://www.mql5.com/en/market/product/129509?source=Site +Market+My+Products+Page My Other Products:  https://www.mql5.com/en/users/1700046313/seller How to Use TD Sequential by Tom DeMark The TD Sequential is a technical analysis indicator develo
This indicator functions similarly to the traditional Relative Strength Index (RSI), but it's integrated directly onto the main price chart. This setup allows traders to more easily identify price fluctuations and recognize conditions of overbought or oversold markets. By observing the indicator in conjunction with price movements, you can gain valuable insights into potential trend reversals or continued momentum. Keep an eye on these signals to enhance your trading strategy. Happy trading, eve
FREE
TD Sequential EA
George Njau Ngugi
Overview The TD Sequential EA is a sophisticated automated trading system designed to capitalize on the TD Sequential indicator, developed by Tom DeMark. This EA identifies trading opportunities based on TD Sequential setups and executes trades with predefined risk management parameters. It offers a clean and customizable chart appearance and allows users to set their own lot sizes and other trading parameters. Key Features Automated Trading : Executes buy and sell orders based on TD Sequential
To access the TD sequential Scanner for MT5, please check https://www.mql5.com/en/market/product/123369?source=Site +Market+My+Products+Page. One of the MT5 versions includes additional timeframes such as M1, M2, M3,H2,H6,H8 and so on.( https://www.mql5.com/en/market/product/123367?source=Site +Market+My+Products+Page) TD Sequential Scanner: An Overview The TD Sequential scanner is a powerful technical analysis tool designed to identify potential price exhaustion points and trend reversals in fi
The indicator I’m referring to is a leading indicator, similar to the Bill Williams Fractals indicator, but with an added feature: it draws vertical lines on the chart to mark significant points in time. This functionality makes it particularly useful for traders as it provides clear visual cues for potential trading opportunities. What sets this indicator apart is its versatility; it can be applied across all timeframes and any currency pair, making it suitable for a wide range of trading stra
RSI on the chart
George Njau Ngugi
This indicator functions similarly to the Relative Strength Index (RSI), but with a key difference: instead of being displayed in a separate window, it overlays directly on the main price chart. This allows for more convenient visualization and interpretation of market momentum alongside price movements. I believe this indicator will enhance your trading experience by providing clearer insights into market conditions. Wishing you successful trading!
This tool is designed specifically for traders seeking to identify market reversals, allowing you to capitalize on advantageous trading opportunities. The indicator has undergone extensive testing and has established itself as a leading indicator; it often predicts market movements effectively. When a buy or sell signal is generated by the indicator, it tends to align with the market’s subsequent behavior, following the trend indicated by the signal. By utilizing this indicator, you can enhance
If you are unsure how to use this indicator, please feel free to reach out to me. I will explain it to you and provide reading materials to help you make the most of it. Most effective with TD sequential :           MT4:  https://www.mql5.com/en/market/product/129509?source=Site +Profile+Seller           MT5:  https://www.mql5.com/en/market/product/129507?source=Site +Profile+Seller My Other products:  https://www.mql5.com/en/users/1700046313/seller Here’s a brief description of how to use the
This indicator outlines take profit (TP) stations derived from the Dinapoli ABC price projections. The key levels identified include COP (the critical operation point) designated as TP1, OP (the optimal point) marked as TP3, and SXOP (the secondary operation point) noted as TP4. This indicator proves to be especially beneficial for traders entering positions without clearly defined exit points. The Dinapoli levels provide precise price projections that highlight where the market is most likely
A fair value gap (FVG) is a temporary price gap that occurs when the price of a stock or security is out of line with its fair value.   This gap is often caused by an imbalance between buyers and sellers. How it works Price imbalance When there is an imbalance between buyers and sellers, the price of a security can move too quickly. Price gap This creates an unadjusted area on the price chart, known as the fair value gap Price correction The price is often drawn back to the fair value gap, as i
If you're familiar with COP, OP, and XOP levels, this indicator is definitely worth considering. There's no need to manually plot the ABC levels, as the indicator automatically calculates and displays the OP projection levels for you, updating regularly as the price changes. This is an essential indicator for your trading toolkit. Please if you are unsual on how to use this indicator feel fell to ask me for help and i can assist you where i can. Happy trading!
If you're familiar with trading using Dinapoli levels, then this indicator is definitely worth your attention. It automatically plots key levels such as COP (Change of Polarity), OP (Objective Price), and XOP (Extended Objective Price) on your charts, regardless of the timeframe you choose to work with. One of the standout features of this indicator is its ability to generate alerts. Whenever a new ABC pattern is automatically identified and plotted by the indicator, you will receive a notifica
Moving MinMax is a custom trend indicator that helps you easily identify the current market direction , reversals , and high-probability trade setups . This tool uses a unique calculation method that measures price pressure from both buyers and sellers, helping you see who is in control and when the market is likely to change direction. Unlike basic oscillators or moving averages, this indicator computes trend likelihoods using a distribution-based exponential model applied over a moving price w
Two indicator
George Njau Ngugi
How to Use this indicator-: 1. Trend-Following Strategy Objective : Enter trades in the direction of the trend when the Net Score and Signal Line confirm a strong trend. Identify the Trend : Look at the Net Score in the separate window: If the Net Score is above 0 and rising, the trend is bullish. If the Net Score is below 0 and falling, the trend is bearish. Confirm with the LazyLine on the main chart: Green LazyLine indicates an uptrend. Red LazyLine indicates a downtrend. Entry : Buy (Long)
Purpose : The AllAverages indicator plots a moving average line on the chart, with options to select from a wide range of MA types and price applications. It also displays buy and sell signals as arrows when the trend changes, and supports alerts (sound, email, push notifications) for these signals. Key Features : Supports multiple moving average types (e.g., SMA, EMA, HMA, TEMA, etc.). Allows customization of the price type (e.g., Close, Open, High, Low, Heiken Ashi variants). Displays a colore
The Trend and Revesal Indicator is a custom indicator designed to help traders identify trend direction, reversal points, and high-probability trade setups. It uses advanced mathematical calculations to analyze market behavior and highlight potential turning points with great accuracy. This indicator measures buying and selling pressure over a defined period and shows which side is in control. It provides a clear visual display of trend zones, reversal arrows, and momentum signals in a separate
If you are unsure how to use this indicator, please feel free to reach out to me. I will explain it to you and provide reading materials to help you make the most of it. TD Sequential Scanner: An Overview The TD Sequential scanner is a powerful technical analysis tool designed to identify potential price exhaustion points and trend reversals in financial markets. Developed by Tom DeMark, this method is widely used by traders to gauge market cycles and potential turning points with precision. Ho
This new version includes all MT5 timeframes (M1, M2, M3, M4, M5, M6, M10, M12, M15, M20, M30, H1, H2, H3, H4, H6, H8, H12, D1, W1 & MN1). The TD count for each timeframe is displayed on the top left corner. You don't need to do analysis anymore, as the scanner does all the analysis and updates every 1 second, allowing users to see real-time data for informed decision-making. Alerts are set on by default (can be turned off), which notifies users at the completion of every TD9. If you need a sca
Description of the Ichimoku Cloud Scanner  The Ichimoku Cloud Scanner is an advanced MetaTrader 5 (MT5) custom indicator designed to monitor the Ichimoku Cloud system across multiple timeframes and provide visual and audible alerts based on the price's position relative to the Ichimoku Cloud. Here's a detailed description of its features and functionalities: Features: Ichimoku Cloud Calculation : Utilizes the Ichimoku Cloud indicator, which consists of five components: Tenkan-sen (Conversion Lin
This indicator serves as a crucial leading tool for identifying pivotal points in market reversals. It provides traders with valuable insights regardless of the timeframe they are analyzing, whether it be minutes, hours, or days. Additionally, it is compatible with all trading pairs, making it highly versatile for various market scenarios. Incorporating this indicator into your trading strategy can significantly enhance your decision-making process and improve your overall trading performance. B
A fair value gap (FVG) is a temporary price gap that occurs when the price of a stock or security is out of line with its fair value.   This gap is often caused by an imbalance between buyers and sellers. How it works Price imbalance When there is an imbalance between buyers and sellers, the price of a security can move too quickly. Price gap This creates an unadjusted area on the price chart, known as the fair value gap Price correction The price is often drawn back to the fair value gap, as i
The Machine Learning Supertrend is a highly effective trading indicator specifically designed to identify and illustrate potential buy and sell signals through the use of clearly marked arrows.  One of the key advantages of this indicator is that it operates as a leading indicator, meaning it anticipates market movements rather than following them. Unlike many traditional indicators, the Machine Learning Supertrend does not lag or repaint, ensuring the signals provided are timely and reliable.
ALL Averages MT5
George Njau Ngugi
Purpose : The AllAverages indicator plots a moving average line on the chart, with options to select from a wide range of MA types and price applications. It also displays buy and sell signals as arrows when the trend changes, and supports alerts (sound, email, push notifications) for these signals. Key Features : Supports multiple moving average types (e.g., SMA, EMA, HMA, TEMA, etc.). Allows customization of the price type (e.g., Close, Open, High, Low, Heiken Ashi variants). Displays a colore
The Jurik Moving Average (JMA) is a sophisticated, adaptive moving average designed to reduce lag while maintaining smoothness. Unlike traditional moving averages (e.g., SMA, EMA), JMA adjusts dynamically to market volatility, making it more responsive to price changes. It’s particularly useful in trading for identifying trends and generating signals with less noise. Input Parameters : inpJmaPeriod (default: 14): The period for calculating the JMA and ATR. inpJmaPhase (default: 0): Controls the
Generates Buy/Sell Signals : Buy Signal : An upward arrow ( DRAW_ARROW ) appears when the JMA changes from a downtrend (red) to an uptrend (green). Sell Signal : A downward arrow ( DRAW_ARROW ) appears when the JMA changes from an uptrend (green) to a downtrend (red). Arrows are placed below (buy) or above (sell) the candle for visibility. Trend Following : Green Line : Indicates an uptrend. Consider holding or entering long positions. Crimson Line : Indicates a downtrend. Consider holding or en
Purpose : The SuperTrend indicator tracks price trends, plotting a line that follows the trend direction (up or down) and optionally fills the area between the trend line and the closing price Plots : SuperTrend Line : A colored line (green for uptrend, red for downtrend) plotted below the price in uptrends and above in downtrends. Filling : Optional filled area (bisque/pale green) between the SuperTrend line and the closing price, shown only if Show_Filling is true. Logic : Calculates ATR usin
Renko Chartt
George Njau Ngugi
Smart Adaptive Renko Pro – Dynamic ATR & Fixed Box Renko Indicator Smart Adaptive Renko Pro is a powerful non-time-based Renko indicator designed to eliminate market noise and reveal true price momentum with precision. Unlike standard chart candles, this indicator builds Renko bricks based purely on price movement — helping traders focus on trend strength, reversals, and clean breakout structures. Key Features Adaptive ATR-Based Box Size (Auto-adjusts to market volatility) Fixed Pip Box M
FractalEA Pro
George Njau Ngugi
FractalEA Pro — Smart Fractal Trading, Fully Automated FractalEA Pro turns Bill Williams' proven Fractal indicator into a complete, fully automated trading system. Every entry is confirmed by multiple filters — EMA trend direction, RSI momentum check, ATR volatility guard, and session timing — so the EA only trades when conditions genuinely align, not on every signal that appears. What makes FractalEA Pro stand out is the control it gives you. Every single feature has its own ON/OFF switch. Turn
Filtro:
Nessuna recensione
Rispondi alla recensione