Higher High Lower Low MT5

5

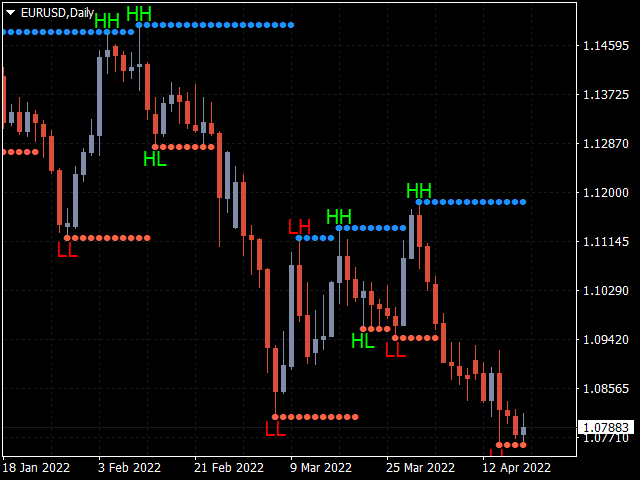
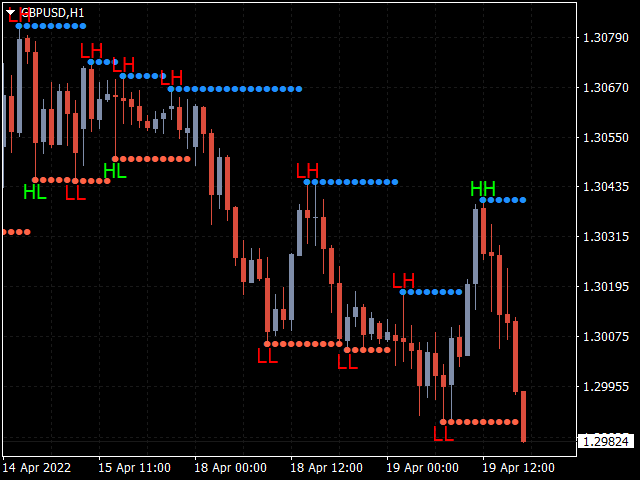
KT Higher High Lower Low segna i seguenti punti di swing con i rispettivi livelli di supporto e resistenza:

  • Higher High: Un massimo superiore rispetto al massimo precedente.
  • Lower High: Un massimo inferiore rispetto al massimo precedente.
  • Lower Low: Un minimo inferiore rispetto al minimo precedente. 
  • Higher Low: Un minimo superiore rispetto al minimo precedente.
     

Caratteristiche

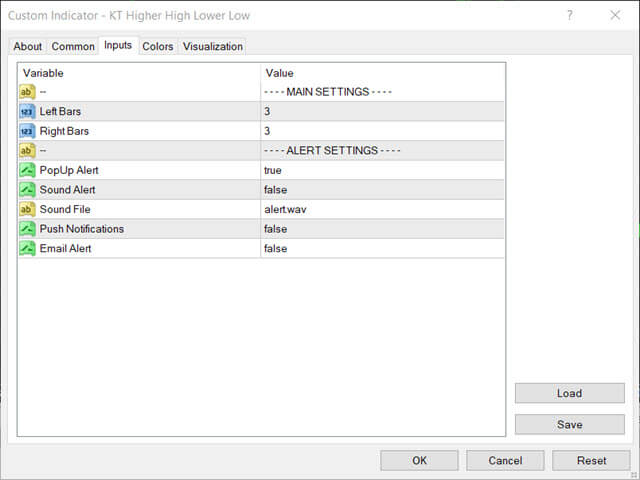
  • L'intensità dei massimi e minimi può essere regolata modificando il numero di barre a sinistra e a destra.
  • Fornisce avvisi quando compaiono nuovi HH, LH, LL e HL.
  • Fornisce avvisi quando il prezzo tocca un livello di supporto o resistenza.
Recensioni 1
Forex-Spinner
515
Forex-Spinner 2024.12.11 14:00 
 

Indicator clearly does what it promised. In my Trading overview it is helpful. I have alarm settings on, which helps me in my manual trading. Thanks I have some further wishes and I will contact the programmer for a possible upgrade.

Prodotti consigliati
Fibaction
Abdelkhalek Orabi
Indicator Name: Fibaction – price action candle Detector Description: Fibo Signal Boxes is a powerful Smart Money Concept (SMC)-inspired indicator that auto-detects price action candles. bullish hammers and shooting stars, then draws precise Fibonacci entry zones and multiple take-profit levels directly on the chart. as for the SL personally i use 40 pips rules  Key Features: Detects bullish hammer and shooting star reversal candles. Automatically draws Fibonacci entry and TP boxes. as
KT Pin Bar MT5
KEENBASE SOFTWARE SOLUTIONS
KT Pin Bar identifies the pin bar formation which is a type of price action pattern which depicts a sign of reversal or rejection of the trend. When combined with support and resistance, BRN and other significant levels, Pin Bar pattern proved to be a very strong sign of reversal. Basically, a pin bar is characterized by a small body relative to the bar length which is closed either in upper or lower 50% part of its length. They have very large wicks and small candle body. A pin bar candlestic
KT Horizontal Lines MT5
KEENBASE SOFTWARE SOLUTIONS
Su MetaTrader, tracciare più   linee orizzontali   e monitorare i rispettivi livelli di prezzo può essere un’attività noiosa. Questo indicatore disegna automaticamente più linee orizzontali a intervalli uguali per impostare avvisi di prezzo, tracciare livelli di supporto e resistenza, e per altri usi manuali. Questo indicatore è perfetto per i trader Forex alle prime armi che cercano opportunità per ottenere profitti rapidi tramite acquisto e vendita. Le linee orizzontali aiutano a identificare
Owl Smart Levels MT5
Sergey Ermolov
4.03 (32)
Versione MT4  |  FAQ L' indicatore Owl Smart Levels è un sistema di trading completo all'interno dell'unico indicatore che include strumenti di analisi di mercato popolari come i frattali avanzati di Bill Williams , Valable ZigZag che costruisce la corretta struttura a onde del mercato, e i livelli di Fibonacci che segnano i livelli esatti di entrata nel mercato e luoghi per prendere profitti. Descrizione dettagliata della strategia Istruzioni per lavorare con l'indicatore Consulente-assistente
FlatBreakout MT5
Aleksei Vorontsov
FlatBreakout MT5 (Free Version) Flat Range Detector and Breakout Panel for MT5 — GBPUSD Only FlatBreakout MT5   is the free version of the professional FlatBreakoutPro MT5 indicator, specially designed for flat (range) detection and breakout signals on the   GBPUSD   pair only. Perfect for traders who want to experience the unique fractal logic of FlatBreakout MT5 and test breakout signals on a live market without limitations. Who Is This Product For? For traders who prefer to trade breakout of
FREE
Tops and Bottoms Indicator
Josue De Matos Silva
4.6 (5)
Tops & Bottoms Indicator FREE   Tops abd Bottoms:   An effective indicator for your trades The tops and bottoms indicator helps you to find  ascending and descending channel formations with indications of ascending and/or descending tops and bottoms. In addition, it  show possibles  opportunities with a small yellow circle when the indicator encounters an impulse formation. This indicator provide to you  more security and speed in making entry decisions. Also test our FREE advisor indicator:  
FREE
PZ Mean Reversion MT5
PZ TRADING SLU
3 (2)
Indicatore unico che implementa un approccio professionale e quantitativo al trading di reversione. Sfrutta il fatto che il prezzo devia e ritorna alla media in modo prevedibile e misurabile, il che consente regole di entrata e uscita chiare che superano di gran lunga le strategie di trading non quantitative. [ Installation Guide | Update Guide | Troubleshooting | FAQ | All Products ] Segnali di trading chiari Incredibilmente facile da scambiare Colori e dimensioni personalizzabili Implementa l
ACB Breakout Arrows MT5
KEENBASE SOFTWARE SOLUTIONS
5 (1)
L’indicatore ACB Breakout Arrows fornisce un segnale di ingresso fondamentale nel mercato rilevando uno specifico pattern di breakout. L’indicatore analizza costantemente il grafico per individuare un momentum stabile in una direzione e fornisce un segnale preciso subito prima del movimento principale. Ottieni lo scanner multi-simbolo e multi-timeframe da qui - Scanner per ACB Breakout Arrows MT5 Caratteristiche principali I livelli di Stop Loss e Take Profit sono forniti automaticamente dall’
Auto Optimized RSI   è un indicatore a freccia intelligente e facile da usare, progettato per fornire segnali di acquisto e vendita precisi. Utilizza simulazioni di trading su dati storici per individuare automaticamente i livelli RSI più efficaci per ogni strumento e timeframe. Questo indicatore può essere utilizzato come sistema di trading autonomo o integrato nella tua strategia esistente, ed è particolarmente utile per i trader a breve termine. A differenza dei livelli fissi tradizionali del
ZigZag with Fibonacci
Rafael Caetano Pinto
This indicator uses the metaquotes ZigZag indicator as base to plot fibonacci extension and fibonacci retracement based in the Elliot waves. A fibonacci retracement will be plotted on every wave draw by the ZigZag. A fibonacci extension will be plotted only after the 2nd wave. Both fibonacci will be updated over the same wave tendency. Supporting until 9 consecutive elliot waves. Parameters: Depth: How much the algorithm will iterate to find the lowest and highest candles Deviation: Amount of
KT 4 Timeframe Trend MT5
KEENBASE SOFTWARE SOLUTIONS
The KT 4 Time Frame Trend is an invaluable forex indicator for traders seeking to identify the trend direction across 4-time frames accurately. This innovative indicator allows users to simultaneously observe and analyze price trends across four different timeframes. Whether you're a beginner or an experienced trader, this tool offers an enhanced understanding of trend dynamics, leading to improved trading strategies on your trading platform. The capability to concurrently monitor multiple timef
TrendDetect
Pavel Gotkevitch
The Trend Detect indicator combines the features of both trend indicators and oscillators. This indicator is a convenient tool for detecting short-term market cycles and identifying overbought and oversold levels. A long position can be opened when the indicator starts leaving the oversold area and breaks the zero level from below. A short position can be opened when the indicator starts leaving the overbought area and breaks the zero level from above. An opposite signal of the indicator can b
Descrizione generale Questo indicatore è una versione avanzata del classico Donchian Channel , arricchita con funzioni operative per il trading reale. Oltre alle tre linee tipiche (massimo, minimo e linea centrale), il sistema rileva i breakout e li segnala graficamente con frecce sul grafico, mostrando solo la linea opposta alla direzione del trend per semplificare la lettura. L’indicatore include: Segnali visivi : frecce colorate al breakout Notifiche automatiche : popup, push e email Filtro R
FREE
LevelPAttern MT5 is a technical indicator based on the daily levels and Price Action patterns. The indicator is based on the standard ZigZag indicator + reversal candlestick pattens, such as Star, Hammer (also knows as Pin bar), Engulfing and others. The indicator generates audio and text notifications when a pattern is formed and a level is touched. It also supports sending email and push notifications. Indicator operation features It is suitable for working with any CFD and FOREX trading inst
Introduction = Universal Trendline Breakout Strategy MT5 = Questo indicatore MT5 è una strategia professionale di breakout su linee di tendenza per Meta Trader 5. Analizza la struttura del mercato e genera segnali BUY SELL su rotture confermate. Riduce la soggettività del disegno manuale. Why use this Tool - Elimina errori nel tracciamento manuale - Identifica BUY SELL basati su struttura - Filtra falsi breakout con conferma di chiusura - Migliora la lettura del mercato - Supporta analisi disc
LT Rainbow Trend
Thiago Duarte
5 (1)
Do you, like me, like to trade with the trend? Then this indicator will help you! Rainbow Trend is a trend indicator, which uses several Moving Averages on the chart. It measures different trend strenght zones for different periods: very long term, long term, mid term, short term and very short term. Each zone has its color, and it is possible to have sound alert when the prices leaves a zone and enters another. Its configuration is very simple. If you find any bug or have any suggestions, conta
Overview The Market Perspective Structure Indicator is a comprehensive MetaTrader indicator designed to provide traders with a detailed analysis of market structure across multiple timeframes. It identifies and visualizes key price action elements, including swing highs and lows, Break of Structure (BOS), Change of Character (CHOCH), internal structures, equal highs/lows, premium/discount levels, previous levels from higher timeframes, and trading session zones. With extensive customization opt
This trading indicator is non-repainting, non-redrawing, and non-lagging, making it an ideal choice for both manual and automated trading. It is a Price Action–based system that leverages price strength and momentum to give traders a real edge in the market. With advanced filtering techniques to eliminate noise and false signals, it enhances trading accuracy and potential. By combining multiple layers of sophisticated algorithms, the indicator scans the chart in real-time and translates comple
Girassol Sunflower MT5 Indicator
Saullo De Oliveira Pacheco
4.33 (6)
This is the famous Sunflower indicator for Metatrader5. This indicator marks possible tops and bottoms on price charts. The indicator identifies tops and bottoms in the asset's price history, keep in mind that the current sunflower of the last candle repaints, as it is not possible to identify a top until the market reverses and it is also not possible to identify a bottom without the market stop falling and start rising. If you are looking for a professional programmer for Metatrader5, please
FREE
Haven FVG Indicator
Maksim Tarutin
5 (7)
L'indicatore   Haven FVG   è uno strumento per l'analisi dei mercati che permette di identificare le aree di inefficienza (Fair Value Gaps, FVG) nel grafico, fornendo ai trader livelli chiave per l'analisi dei prezzi e la presa di decisioni commerciali. Altri prodotti ->  QUI Caratteristiche principali: Impostazioni dei colori individuali: Colore per FVG rialzista   (Bullish FVG Color). Colore per FVG ribassista   (Bearish FVG Color). Visualizzazione flessibile di FVG: Numero massimo di candele
FREE
L'indicateur SMC Venom Model BPR est un outil professionnel pour les traders travaillant dans le concept Smart Money (SMC). Il identifie automatiquement deux modèles clés sur le graphique des prix: FVG   (Fair Value Gap) est une combinaison de trois bougies, dans laquelle il y a un écart entre la première et la troisième bougie. Forme une zone entre les niveaux où il n'y a pas de support de volume, ce qui conduit souvent à une correction des prix. BPR   (Balanced Price Range) est une combinaiso
Swing Point BoS CHoCH Con Exp Alerts
Usiola Oluwadamilol Olagundoye
NOTE: Turn Pattern Scan ON This indicator identifies Swing Points, Break of Structure (BoS), Change of Character (CHoCH), Contraction and Expansion patterns which are plotted on the charts It also comes with Alerts & Mobile notifications so that you do not miss any trades. It can be used on all trading instruments and on all timeframes. The non-repaint feature makes it particularly useful in backtesting and developing profitable trading models. The depth can be adjusted to filter swing points.
FREE
Fractal Channel Breakout MT5
KEENBASE SOFTWARE SOLUTIONS
KT Fractal Channel Breakout draws a continuous channel by connecting the successive Up and Down fractals. It provides alerts and also plots the Up and Down arrows representing the bullish and bearish breakout of the fractal channel. Features If you use Bill Williams fractals in your technical analysis, you must also include it in your trading arsenal. It can be very effective and useful for stop-loss trailing. A new market trend often emerges after a fractal channel breakout in a new direction.
The new update makes this indicator a complete tool for studying, analyzing and operating probabilistic patterns. It includes: On-chart Multi-asset percentage monitor. Configurable martingales. Twenty-one pre-configured patterns, including Mhi patterns and C3. An advanced pattern editor to store up to 5 custom patterns. Backtest mode to test results with loss reports. Trend filter. Hit operational filter. Martingale Cycles option. Various types of strategies and alerts. Confluence between patter
Questo indicatore traccia fino a 6 livelli che possono essere abilitati/disabilitati per rendere il grafico più pulito secondo il requisito del trader Questi 6 livelli sono in 2 set: Alto e Basso Per ogni set, è possibile selezionare un periodo di tempo diverso Si basa sulla strategia di inversione di precedenti alti e bassi, poiché si ritiene che il prezzo di solito mostri un rifiuto in un intervallo di tempo più breve come 5 minuti quando il prezzo raggiunge il massimo giornaliero, settima
Overview All in One Swing Points is a precision swing detection indicator that automatically plots three levels of market swing structures—from the strictest 3-bar formations to long-term turning points—all in one visual layer. This tool gives traders a clear, multi-timeframe perspective on price structure shifts, making it ideal for identifying market reversals, liquidity sweeps, and structure breaks with minimal clutter. Key Features a. 3 Swing Levels in One Indicator Strict 3-Bar S
The Swing High Low and Fibonacci Retracement Indicator is a powerful technical analysis tool designed to identify key price levels and potential reversal zones in the market. It automatically detects recent swing highs and swing lows on the chart and overlays Fibonacci retracement levels based on these points. This indicator helps traders: Visualize market structure by highlighting recent swing points. Identify support and resistance zones using Fibonacci ratios (e.g., 38.2%, 50%, 61.8%). Adapt
Candlestick Pattern Teller
Flavio Javier Jarabeck
5 (1)
Minions Labs' Candlestick Pattern Teller It shows on your chart the names of the famous Candlesticks Patterns formations as soon as they are created and confirmed. No repainting. That way beginners and also professional traders who have difficulties in visually identifying candlestick patterns will have their analysis in a much easier format. Did you know that in general there are 3 types of individuals: Visual, Auditory, and Kinesthetic? Don't be ashamed if you cannot easily recognize Candlesti
Your Trend Friend
Luigi Nunes Labigalini
5 (1)
The trend is your friend! Look at the color of the indicator and trade on that direction. It does not  repaint. After each candle is closed, that's the color of the trend. You can focus on shorter faster trends or major trends, just test what's most suitable for the symbol and timeframe you trade. Simply change the "Length" parameter and the indicator will automatically adapt. You can also change the color, thickness and style of the lines. Download and give it a try! There are big movements w
Statistical Arbitrage Spread Generator for Cointegration [MT5] What is Pair Trading? Pair trading is a market-neutral strategy that looks to exploit the relative price movement between two correlated assets — instead of betting on the direction of the market. The idea? When two assets that usually move together diverge beyond a statistically significant threshold, one is likely mispriced. You sell the expensive one, buy the cheap one , and profit when they converge again. It’s a statistica
FREE
Gli utenti di questo prodotto hanno anche acquistato
Se acquisti questo indicatore, riceverai il mio Trade Manager Professionale + EA  GRATUITAMENTE. Innanzitutto è importante sottolineare che questo sistema di trading è un indicatore Non-Repainting, Non-Redrawing e Non-Lagging, il che lo rende ideale sia per il trading manuale che per quello automatico. Corso online, manuale e download di preset. Il "Sistema di Trading Smart Trend MT5" è una soluzione completa pensata sia per i trader principianti che per quelli esperti. Combina oltre 10 indicat
Power Candles MT5
Daniel Stein
5 (2)
Power Candles – Segnali di ingresso basati sulla forza per tutti i mercati Power Candles porta l’analisi di forza collaudata di Stein Investments direttamente sul grafico dei prezzi. Invece di reagire solo al prezzo, ogni candela viene colorata in base alla reale forza di mercato, consentendo di identificare immediatamente accumuli di momentum, accelerazioni della forza e transizioni di trend pulite. Un’unica logica per tutti i mercati Power Candles funziona automaticamente su tutti i simboli di
Divergence Bomber
Ihor Otkydach
4.96 (77)
Ogni acquirente dell’indicatore riceverà inoltre gratuitamente: L’utilità esclusiva “Bomber Utility”, che gestisce automaticamente ogni operazione, imposta i livelli di Stop Loss e Take Profit e chiude le posizioni secondo le regole della strategia I file di configurazione (set file) per adattare l’indicatore a diversi asset I set file per configurare il Bomber Utility in tre modalità: “Rischio Minimo”, “Rischio Bilanciato” e “Strategia di Attesa” Una guida video passo-passo per installare, conf
Entry In The Zone and SMC Multi Timeframe è uno strumento di analisi di mercato in tempo reale sviluppato sulla base degli Smart Money Concepts (SMC). È progettato per aiutare i trader ad analizzare la struttura del mercato in modo sistematico e ottenere una visione più chiara della direzione generale del mercato. Il sistema analizza automaticamente i Punti di Inversione, le Zone Chiave e la Market Structure su più timeframe, mostrando Point of Interest (POI), segnali No Repaint e Auto Fibonacci
Atomic Analyst MT5
Issam Kassas
4.19 (27)
Innanzitutto, vale la pena sottolineare che questo indicatore di trading non è repaint, non è ridisegno e non presenta ritardi, il che lo rende ideale sia per il trading manuale che per quello automatico. Manuale utente: impostazioni, input e strategia. L'Analista Atomico è un indicatore di azione del prezzo PA che utilizza la forza e il momentum del prezzo per trovare un miglior vantaggio sul mercato. Dotato di filtri avanzati che aiutano a rimuovere rumori e segnali falsi, e aumentare il pote
Gold Sniper Scalper Pro
Ich Khiem Nguyen
3.29 (7)
Gold Sniper Scalper Pro - Sistema di Trading dell'Oro (XAU/USD) su MetaTrader 5 Per il trader serio: Approcciate il trading sull'Oro con una metodologia strutturata e basata sui dati che combina molteplici fattori di analisi di mercato. Questo strumento è stato creato per supportare la vostra analisi del trading sull'Oro. Opportunità di Prezzo Limitata Questa è un'occasione per possedere Gold Sniper Scalper Pro prima che il prezzo aumenti. Il prezzo del prodotto aumenterà di $50 dopo ogni 10 ac
Game Changer è un indicatore di tendenza rivoluzionario, progettato per essere utilizzato su qualsiasi strumento finanziario, per trasformare il tuo Metatrader in un potente analizzatore di trend. L'indicatore non ridisegna e non subisce ritardi. Funziona su qualsiasi intervallo temporale e aiuta a identificare i trend, segnala potenziali inversioni, funge da meccanismo di trailing stop e fornisce avvisi in tempo reale per risposte tempestive del mercato. Che tu sia un trader esperto, un profess
FX Power MT5 NG
Daniel Stein
5 (28)
FX Power: Analizza la Forza delle Valute per Decisioni di Trading Più Intelligenti Panoramica FX Power è lo strumento essenziale per comprendere la reale forza delle principali valute e dell'oro in qualsiasi condizione di mercato. Identificando le valute forti da comprare e quelle deboli da vendere, FX Power semplifica le decisioni di trading e rivela opportunità ad alta probabilità. Che tu segua le tendenze o anticipi inversioni utilizzando valori estremi di Delta, questo strumento si adatta
Azimuth Pro
Ottaviano De Cicco
5 (1)
LAUNCH PROMO Azimuth Pro price is initially set at 299 $ for the first 100 buyers. Final price will be 499 $ . THE DIFFERENCE BETWEEN RETAIL AND INSTITUTIONAL ENTRIES ISN'T THE INDICATOR — IT'S THE LOCATION. Most traders enter at arbitrary price levels, chasing momentum or reacting to lagging signals. Institutions wait for price to reach structured levels where supply and demand actually shift. Azimuth Pro maps these levels automatically: swing-anchored VWAP, multi-timeframe structure lines,
Trend Screener Pro MT5
STE S.S.COMPANY
4.84 (99)
Indicatore di tendenza, soluzione unica rivoluzionaria per il trading di tendenze e il filtraggio con tutte le importanti funzionalità di tendenza integrate in un unico strumento! È un indicatore multi-timeframe e multi-valuta al 100% non ridipingibile che può essere utilizzato su tutti i simboli/strumenti: forex, materie prime, criptovalute, indici e azioni. Trend Screener è un indicatore di tendenza che segue un indicatore efficiente che fornisce segnali di tendenza a freccia con punti nel gra
Smart Stop Indicator – Precisione intelligente dello stop-loss direttamente sul grafico Panoramica Smart Stop Indicator è la soluzione ideale per i trader che desiderano posizionare il loro stop-loss in modo chiaro e metodico, senza dover indovinare o affidarsi all’intuizione. Questo strumento combina la logica classica del price action (massimi e minimi strutturali) con un moderno riconoscimento dei breakout per identificare il prossimo livello di stop realmente logico. In trend, in range o i
FX Levels MT5
Daniel Stein
5 (12)
FX Levels: Supporti e Resistenze di Precisione Eccezionale per Tutti i Mercati Panoramica Rapida Cercate un modo affidabile per individuare livelli di supporto e resistenza in ogni mercato—coppie di valute, indici, azioni o materie prime? FX Levels fonde il metodo tradizionale “Lighthouse” con un approccio dinamico all’avanguardia, offrendo una precisione quasi universale. Basato sulla nostra esperienza reale con i broker e su aggiornamenti automatici giornalieri più quelli in tempo reale, FX
Trend indicator AI mt5
Ramil Minniakhmetov
5 (13)
Trend Ai indicator è un ottimo strumento che migliorerà l'analisi di mercato di un trader combinando l'identificazione della tendenza con punti di ingresso utilizzabili e avvisi di inversione. Questo indicatore consente agli utenti di navigare nelle complessità del mercato forex con fiducia e precisione Oltre ai segnali primari, l'indicatore Ai di tendenza identifica i punti di ingresso secondari che si presentano durante i pullback o i ritracciamenti, consentendo ai trader di capitalizzare le
SynaptixQuant Dominance Matrix
Devie Arevalo Montemayor
5 (1)
SynaptixQuant Dominance Matrix: Institutional-Grade Market State Extraction Engineered for traders who require a data-driven view of market behaviour beyond surface-level indicators. The Synaptix Quant (SQ) Dominance Matrix is not a conventional currency strength display. Behind its intentionally streamlined interface runs a sophisticated analytical architecture designed to quantify market conditions with precision. Every output is generated through layered signal processing built to identify d
- Real price is 80$ - 45% Discount (It is 45$ now) Contact me for extra bonus   indicator, instruction or any questions! - Lifetime update free - Non-repaint - Related product: Gann Gold EA - I just sell my products in Elif Kaya Profile, any other websites are stolen old versions, So no any new updates or support. Advantages of  M1 Scalper Pro  Profitability: M1 Scalper Pro is highly profitable with a strict exit strategy. Frequent Opportunities: M1 Scalper Pro  takes advantage of numerous smal
IX Power MT5
Daniel Stein
4.92 (12)
IX Power: Scopri approfondimenti di mercato per indici, materie prime, criptovalute e forex Panoramica IX Power è uno strumento versatile progettato per analizzare la forza di indici, materie prime, criptovalute e simboli forex. Mentre FX Power offre la massima precisione per le coppie di valute utilizzando i dati di tutte le coppie disponibili, IX Power si concentra esclusivamente sui dati di mercato del simbolo sottostante. Questo rende IX Power una scelta eccellente per mercati non correlat
Grabber System MT5
Ihor Otkydach
4.81 (21)
Ti presento un eccellente indicatore tecnico: Grabber, che funziona come una strategia di trading "tutto incluso", pronta all’uso. In un solo codice sono integrati strumenti potenti per l’analisi tecnica del mercato, segnali di trading (frecce), funzioni di allerta e notifiche push. Ogni acquirente di questo indicatore riceve anche gratuitamente: L’utility Grabber: per la gestione automatica degli ordini aperti Video tutorial passo dopo passo: per imparare a installare, configurare e utilizzare
Quantum TrendPulse
Bogdan Ion Puscasu
5 (20)
Ecco   Quantum TrendPulse   , lo strumento di trading definitivo che combina la potenza di   SuperTrend   ,   RSI   e   Stocastico   in un unico indicatore completo per massimizzare il tuo potenziale di trading. Progettato per i trader che cercano precisione ed efficienza, questo indicatore ti aiuta a identificare con sicurezza le tendenze di mercato, i cambiamenti di momentum e i punti di entrata e uscita ottimali. Caratteristiche principali: Integrazione SuperTrend:   segui facilmente l'andame
ARIPoint
Temirlan Kdyrkhan
1 (1)
ARIPoint is a powerful trading companion designed to generate high-probability entry signals with dynamic TP/SL/DP levels based on volatility. Built-in performance tracking shows win/loss stats, PP1/PP2 hits, and success rates all updated live. Key Features: Buy/Sell signals with adaptive volatility bands Real-time TP/SL/DP levels based on ATR Built-in MA Filter with optional ATR/StdDev volatility Performance stats panel (Success, Profit/Loss, PP1/PP2) Alerts via popup, sound, push, or email Cu
Gartley Hunter Multi
Siarhei Vashchylka
5 (11)
Gartley Hunter Multi - An indicator for searching for harmonic patterns simultaneously on dozens of trading instruments and on all possible timeframes. Manual (Be sure to read before purchasing) | Version for MT4 Advantages 1. Patterns: Gartley, Butterfly, Shark, Crab. Bat, Alternate Bat, Deep Crab, Cypher 2. Simultaneous search for patterns on dozens of trading instruments and on all possible timeframes 3. Search for patterns of all possible sizes. From the smallest to the largest 4. All fou
Weis Wave with Alert MT5
Trade The Volume Waves Single Member P.C.
4.94 (17)
Rental/Lifetime Package Options and Privileges  Rent Monthly Six Months   Yearly/Lifetime Weis Wave with Speed with Alert+Speed Index x x x Manual  x x x Quick Set up Video x x x Blog x x x Lifetime Updates x x x Setup and Training Material x x Discord Access Channel "The SI traders"          x Rectangle Break Alert Tool      x How to trade with it:    http://www.tradethevolumewaves.com   ** If you purchase please contact me to setup your  : Training Room and  complete manual access.  Wei
SuperScalp Pro
Van Minh Nguyen
5 (1)
SuperScalp Pro – Sistema avanzato di indicatore per scalping con filtri multipli SuperScalp Pro è un sistema avanzato di indicatore per scalping che combina il classico Supertrend con molteplici filtri di conferma intelligenti. L’indicatore funziona in modo efficiente su tutti i timeframe da M1 a H4 ed è particolarmente adatto per XAUUSD, BTCUSD e le principali coppie Forex. Può essere utilizzato come sistema stand-alone o integrato in modo flessibile nelle strategie di trading esistenti. L’indi
Innanzitutto, vale la pena sottolineare che questo Strumento di Trading è un Indicatore Non-Ridipingente, Non-Ridisegnante e Non-Laggante, il che lo rende ideale per il trading professionale. Corso online, manuale utente e demo. L'Indicatore Smart Price Action Concepts è uno strumento molto potente sia per i nuovi che per i trader esperti. Racchiude più di 20 utili indicatori in uno solo, combinando idee di trading avanzate come l'Analisi del Trader del Circolo Interno e le Strategie di Tradin
MTF Supply Demand Zones MT5
Georgios Kalomoiropoulos
5 (1)
Nuova generazione di zone di domanda e offerta automatizzate. Algoritmo nuovo e innovativo che funziona su qualsiasi grafico. Tutte le zone vengono create dinamicamente in base all'azione dei prezzi del mercato. DUE TIPI DI AVVISI --> 1) QUANDO IL PREZZO RAGGIUNGE UNA ZONA 2) QUANDO SI FORMA UNA NUOVA ZONA Non ottieni un altro indicatore inutile. Ottieni una strategia di trading completa con risultati comprovati.     Nuove caratteristiche:     Avvisi quando il prezzo raggiunge la zona di
Trend Forecaster
Alexey Minkov
5 (7)
The Trend Forecaster indicator utilizes a unique proprietary algorithm to determine entry points for a breakout trading strategy. The indicator identifies price clusters, analyzes price movement near levels, and provides a signal when the price breaks through a level. The Trend Forecaster indicator is suitable for all financial assets, including currencies (Forex), metals, stocks, indices, and cryptocurrencies. You can also adjust the indicator to work on any time frames, although it is recommen
Trend Flow PRO
Aliaksandr Alferchyk
TREND FLOW PRO aiuta a identificare i punti in cui il mercato cambia realmente direzione. L’indicatore evidenzia le inversioni di trend e le aree in cui i principali partecipanti al mercato rientrano. I segni BOS sul grafico rappresentano veri cambi di trend e livelli chiave dei timeframe superiori. I dati dell’indicatore non vengono ridisegnati e rimangono sul grafico dopo la chiusura di ogni candela. Elementi principali dell’indicatore: BOS FLOW – onde di trend e veri cambi di trend. Rappresen
Trade smarter, not harder: Empower your trading with Harmonacci Patterns This is arguably the most complete harmonic price formation auto-recognition indicator you can find for the MetaTrader Platform. It detects 19 different patterns, takes fibonacci projections as seriously as you do, displays the Potential Reversal Zone (PRZ) and finds suitable stop-loss and take-profit levels. [ Installation Guide | Update Guide | Troubleshooting | FAQ | All Products ] It detects 19 different harmonic pri
Elliott Wave Trend was designed for the scientific wave counting. This tool focuses to get rid of the vagueness of the classic Elliott Wave Counting using the guideline from the template and pattern approach. In doing so, firstly Elliott Wave Trend offers the template for your wave counting. Secondly, it offers Wave Structural Score to assist to identify accurate wave formation. It offers both impulse wave Structural Score and corrective wave Structure Score. Structural Score is the rating to sh
How many times have you bought a trading indicator with great back-tests, live account performance proof with fantastic numbers and stats all over the place but after using it, you end up blowing your account? You shouldn't trust a signal by itself, you need to know why it appeared in the first place, and that's what RelicusRoad Pro does best! User Manual + Strategies + Training Videos + Private Group with VIP Access + Mobile Version Available A New Way To Look At The Market RelicusRoad is the
Meravith AUTO
Ivan Stefanov
5 (1)
Meravith Auto è una versione automatizzata del sistema di trading Meravith. L'indicatore è composto da una linea di tendenza che cambia colore. Quando è rialzista è verde, quando è ribassista è rossa. Questa è la linea di supporto del trend. Una linea di liquidità, dove il volume rialzista è uguale al volume ribassista. Una linea di deviazione rialzista tripla. Una linea di deviazione ribassista tripla. Punti viola e blu che indicano un volume elevato. Il punto viola indica un volume maggiore di
Altri dall’autore
ACB Breakout Arrows MT5
KEENBASE SOFTWARE SOLUTIONS
5 (1)
L’indicatore ACB Breakout Arrows fornisce un segnale di ingresso fondamentale nel mercato rilevando uno specifico pattern di breakout. L’indicatore analizza costantemente il grafico per individuare un momentum stabile in una direzione e fornisce un segnale preciso subito prima del movimento principale. Ottieni lo scanner multi-simbolo e multi-timeframe da qui - Scanner per ACB Breakout Arrows MT5 Caratteristiche principali I livelli di Stop Loss e Take Profit sono forniti automaticamente dall’
ACB Breakout Arrows
KEENBASE SOFTWARE SOLUTIONS
4.15 (34)
L’indicatore ACB Breakout Arrows fornisce un segnale di ingresso cruciale rilevando uno specifico pattern di breakout. Monitora costantemente il grafico alla ricerca di un momentum stabile in una direzione e segnala con precisione l’ingresso poco prima del movimento principale.  Ottieni lo scanner multi-simbolo e multi-timeframe qui - Scanner per ACB Breakout Arrows MT4 Caratteristiche principali Lo Stop Loss e il Take Profit sono calcolati automaticamente dall'indicatore. Include una dashboard
KT Momentum Arrows MT5
KEENBASE SOFTWARE SOLUTIONS
5 (2)
L'indicatore KT Momentum Arrows si basa su una rottura momentanea calcolata utilizzando la deviazione delle bande e la volatilità emergente in una determinata direzione. Un segnale di acquisto viene generato quando il prezzo chiude al di sopra della banda superiore, mentre un segnale di vendita viene generato quando chiude al di sotto della banda inferiore. Viene utilizzato un coefficiente di magnitudo come input, che influenza sia la deviazione delle bande sia la misurazione della volatilità. I
KT Momentum Arrows
KEENBASE SOFTWARE SOLUTIONS
L'indicatore KT Momentum Arrows si basa su una rottura momentanea calcolata utilizzando la deviazione delle bande e la volatilità emergente in una determinata direzione. Un segnale di acquisto viene generato quando il prezzo chiude al di sopra della banda superiore, mentre un segnale di vendita viene generato quando chiude al di sotto della banda inferiore. Viene utilizzato un coefficiente di magnitudo come input, che influenza sia la deviazione delle bande sia la misurazione della volatilità. I
KT Stoch Divergence MT5
KEENBASE SOFTWARE SOLUTIONS
La divergenza è uno dei segnali chiave che può anticipare un'inversione di prezzo nel mercato. KT Stoch Divergence evidenzia le divergenze regolari e nascoste tra il prezzo e l’oscillatore stocastico. Limitazioni di KT Stoch Divergence Usare solo la divergenza dello stocastico come segnale di ingresso può essere rischioso. Non tutte le divergenze sono sinonimo di un'inversione forte. Per ottenere risultati migliori, combinarla con l’azione del prezzo e la direzione del trend. Caratteristiche
ACB Trade Filter MT4
KEENBASE SOFTWARE SOLUTIONS
5 (1)
The ACB Trade Filter indicator provides a solution for filtering out the low probability trading setups in a trading strategy. The indicator uses a sophisticated filtration algorithm based on the market sentiment and trend. Applications Works great with our indicator " ACB Breakout Arrows ". Filter out low probability signals from any indicator. Avoid overtrading and minimize the losses. Trade in the direction of market sentiment and trend. Avoid the choppiness in the market. How to use Only L
KT Psar Arrows MT5
KEENBASE SOFTWARE SOLUTIONS
5 (1)
KT Psar Arrows traccia frecce sul grafico utilizzando l'indicatore standard Parabolic SAR. Una freccia rialzista viene tracciata quando il massimo della candela tocca il SAR. Una freccia ribassista viene tracciata quando il minimo della candela tocca il SAR. I segnali vengono generati in tempo reale senza attendere la chiusura della candela.  Funzionalità Uno strumento utile per i trader che desiderano sperimentare strategie di trading che includono l'uso dell'indicatore Parabolic SAR.  Può ess
MACD Divergence on MT5
KEENBASE SOFTWARE SOLUTIONS
KT MACD Divergence mostra le divergenze regolari e nascoste che si formano tra il prezzo e l’oscillatore. Se la tua strategia di trading prevede un'inversione di tendenza, puoi utilizzare la divergenza regolare del MACD per identificare possibili punti di svolta. Se invece la tua strategia si basa sulla continuazione del trend, la divergenza nascosta del MACD sarà più adatta. Limitazioni di KT MACD Divergence Usare la divergenza del MACD come unico segnale d'ingresso può essere rischioso. Non
KT Trend Magic
KEENBASE SOFTWARE SOLUTIONS
KT Trend Magic shows the trend depiction on chart using the combination of market momentum and volatility. A smoothing coefficient is used to smooth out the noise from the signal.It can be used to find out the new entries or confirm the trades produced by other EA/Indicators. Usage Drag n drop MTF scanner which scans for the new signals across multiple time-frames. Find new entries in the trend direction. Improve the accuracy of other indicators when used in conjunction. Can be used as a dynami
KT COG Advanced MT4
KEENBASE SOFTWARE SOLUTIONS
1 (1)
KT COG is an advanced implementation of the center of gravity indicator presented by John F. Ehlers in the May 2002 edition of Technical Analysis of Stocks & Commodities magazine. It's a leading indicator which can be used to identify the potential reversal points with the minimum lag. The COG oscillator catches the price swings quite effectively. MT5 version of the same indicator is available here KT COG Advanced MT5 Calculation of COG The COG indicator is consist of the two lines. The main l
KT Pin Bar
KEENBASE SOFTWARE SOLUTIONS
KT Pin Bar identifies the pin bar formation which is a type of price action pattern which depicts a sign of reversal or rejection of the trend. When combined with support and resistance, BRN and other significant levels, Pin Bar pattern proved to be a very strong sign of reversal. Basically, a pin bar is characterized by a small body relative to the bar length which is closed either in upper or lower 50% part of its length. They have very large wicks and small candle body. A pin bar candlestic
KT Auto Fibo
KEENBASE SOFTWARE SOLUTIONS
KT Auto Fibo traccia automaticamente i livelli di ritracciamento di Fibonacci basandosi sulla direzione della tendenza in corso. I massimi e i minimi vengono selezionati automaticamente utilizzando i punti massimi e minimi disponibili sul grafico. Puoi ingrandire, ridurre e scorrere il grafico per regolare i livelli di Fibonacci di conseguenza. Modalità Automatico:  Traccia automaticamente i livelli di Fibonacci in base all'area visibile del grafico. Manuale: Traccia i livelli di Fibonacci una
KT Psar Arrows
KEENBASE SOFTWARE SOLUTIONS
KT Psar Arrows traccia frecce sul grafico utilizzando l'indicatore standard Parabolic SAR. Una freccia rialzista viene tracciata quando il massimo della candela tocca il SAR. Una freccia ribassista viene tracciata quando il minimo della candela tocca il SAR. I segnali vengono generati in tempo reale senza attendere la chiusura della candela.  Funzionalità Uno strumento utile per i trader che desiderano sperimentare strategie di trading che includono l'uso dell'indicatore Parabolic SAR.  Può ess
KT Ichimoku Trader
KEENBASE SOFTWARE SOLUTIONS
1 (1)
KT Ichimoku Trader is a fully automated expert advisor that offers five popular trading strategies based on the Ichimoku indicator. Each strategy has it's own entry and exit method without any interference to other strategies. The Ichimoku system can be applied to all major currency pairs and metals. However, we found that it performs reasonably well mainly on two pairs.   MT5 Version is available here  https://www.mql5.com/en/market/product/35043 Features Trade up to 5 famous trading strategi
KT Volatility Oscillator
KEENBASE SOFTWARE SOLUTIONS
L'Oscillatore di Volatilità KT analizza i dati di mercato passati e presenti utilizzando una formula matematica per mostrare il risultato sotto forma di oscillatore. Le onde crescenti e decrescenti corrispondono rispettivamente a un'elevata e a una bassa volatilità dell'asset.  In poche parole, la volatilità è semplicemente una misura delle fluttuazioni di prezzo di un asset in un certo periodo di tempo. Senza volatilità, ci sarebbero pochi movimenti di mercato e i trader non potrebbero trarre p
KT COG Robot
KEENBASE SOFTWARE SOLUTIONS
KT COG Robot is a fully automated Expert Advisor based on the KT COG Indicator . The COG indicator was originally presented by John F. Ehlers in the May 2002 edition of Technical Analysis of Stocks & Commodities magazine. The EA fires a long trade when COG line cross above the signal line and a short trade is fired when the COG line cross below the signal line.  Adaptive Filtration Our adaptive filtration algorithm combines the original COG formula with the major trend direction and market acce
ACB Breakout Arrows EA
KEENBASE SOFTWARE SOLUTIONS
Questo è un Expert Advisor completamente automatizzato basato sul nostro indicatore personalizzato chiamato "ACB Breakout Arrows" . Le entrate si basano su un pattern di breakout che si verifica costantemente in entrambe le direzioni. L’intensità dei segnali può essere regolata tramite il parametro esterno "Signal Sensitivity". Conferma delle operazioni ACB Breakout Arrows EA consente di filtrare gli ingressi utilizzando un altro nostro indicatore personalizzato chiamato ACB Trade Filter . For
KT Asian Breakout
KEENBASE SOFTWARE SOLUTIONS
4 (1)
KT Asian Breakout carefully analyzes the range-bound market during the Asian session and then fires a long or short trade after doing some preassessment based on its inbuilt technical analysis module. The executed orders are closed within a day before the completion of the next day session. The inbuilt technical analysis module checks for the session range and compares it with the last 20 days price movement. If it finds any erratic price movement within the session, the orders are not executed
KT London Breakout
KEENBASE SOFTWARE SOLUTIONS
First thirty minutes are essential for a trading session. The early reaction of traders and market players sets a path for the rest of the day. KT London Breakout EA takes advantage of this phenomenon, and after analyzing the first thirty minutes of London session, it places two bidirectional pending orders. One of pending order is eventually canceled after realizing the market direction with certainty. It has been strictly tested and developed for EUR/JPY using 30-Min Time Frame. You can expe
Use of support and resistance in systematic trading is very subjective. Every trader has their own idea and way to plotting the support and resistance levels on the chart. KT Support and Resistance indicator take out this ambiguity out of the situation and automatically draws support and resistance levels following an algorithmic approach using a unique multi-timeframe analysis. When launched on the chart, It immediately scan the most significant extreme points across all the available timefra
Se fai trading nel Forex, avere informazioni dettagliate sulla forza delle valute e sulla correlazione tra coppie di valute può portare il tuo trading a un livello superiore. La correlazione ti aiuterà a dimezzare il rischio, mentre l'analisi della forza ti permetterà di massimizzare i profitti. Questo indicatore offre un approccio ibrido per selezionare le coppie di valute più appropriate, combinando l'analisi della forza delle valute e la correlazione tra coppie di valute. Come utilizzare l'a
MACD Divergence Seeker
KEENBASE SOFTWARE SOLUTIONS
KT MACD Divergence Seeker trades the regular and hidden divergence signals generated by our free indicator named KT MACD Divergence indicator. Trading the standalone divergences can be a risky affair that's why the KT MACD Divergence Seeker combines the standard divergence signals with an advanced analysis module to exploit the price inefficiencies on some FX pairs. What is the Divergence exactly? As a general conception if the price is making higher highs, then macd should also be making hig
KT Asian Breakout Indicator
KEENBASE SOFTWARE SOLUTIONS
L'indicatore KT Asian Breakout analizza una parte cruciale della sessione asiatica per generare segnali di acquisto e vendita in entrambe le direzioni, in base alla rottura del prezzo. Un segnale di acquisto si verifica quando il prezzo supera il massimo della sessione, mentre un segnale di vendita si verifica quando il prezzo scende al di sotto del minimo della sessione. Cose da ricordare Se la scatola della sessione è troppo ampia verticalmente, è consigliabile evitare di entrare in nuovi tra
MACD Divergence MT4
KEENBASE SOFTWARE SOLUTIONS
KT MACD Divergence mostra le divergenze regolari e nascoste che si formano tra il prezzo e l’oscillatore. Se la tua strategia di trading prevede un'inversione di tendenza, puoi utilizzare la divergenza regolare del MACD per identificare possibili punti di svolta. Se invece la tua strategia si basa sulla continuazione del trend, la divergenza nascosta del MACD sarà più adatta. Limitazioni di KT MACD Divergence Usare la divergenza del MACD come unico segnale d'ingresso può essere rischioso. Non
KT Bollinger Bands Trader MT4
KEENBASE SOFTWARE SOLUTIONS
KT Bollinger Bands Trader è un Expert Advisor completamente automatizzato che utilizza una strategia di ritorno alla media basata sulle bande di Bollinger durante i periodi di bassa volatilità. Il prezzo spesso reagisce sulla linea superiore o inferiore delle bande, ma non sempre si verifica un'inversione. Tuttavia, la probabilità di un’inversione è maggiore quando la volatilità è bassa. Ingressi Un trade long viene attivato quando il prezzo si posiziona correttamente al di sotto della banda in
KT CCI Divergence MT4
KEENBASE SOFTWARE SOLUTIONS
KT CCI Divergence shows the regular and hidden divergence created between the price and CCI oscillator. Divergence is one of the vital signals that depicts the upcoming price reversal in the market. Manually spotting the divergence between price and CCI can be a hectic and ambiguous task. Limitations of KT CCI Divergence   Using the CCI divergence as a standalone entry signal can be risky. Every divergence can't be interpreted as a strong reversal signal. For better results, try to combine it w
KT Heiken Ashi Smoothed MT4
KEENBASE SOFTWARE SOLUTIONS
KT Heiken Ashi Smoothed è una versione smussata dello Heiken Ashi standard e disegna frecce di acquisto/vendita quando la tendenza cambia. Viene tracciata una freccia di acquisto quando si passa da stato ribassista a rialzista. Viene tracciata una freccia di vendita quando si passa da rialzista a ribassista. Notifiche mobile, email, audio e pop-up incluse. Cosa è esattamente Heiken Ashi Smoothed? Filtra i falsi segnali e il rumore del Heiken Ashi standard applicando due medie mobili per render
KT MA Crossover MT4
KEENBASE SOFTWARE SOLUTIONS
KT MA Crossover disegna frecce di acquisto e vendita in base all'incrocio delle medie mobili selezionate. Inoltre, genera gli avvisi appropriati e visualizza il valore MFE (Escursione Più Favorevole) per ogni segnale consecutivo. L’incrocio delle medie mobili è una delle strategie più utilizzate dai trader di tutto il mondo. Di solito si basa su una media mobile veloce e una lenta per determinare segnali di ingresso in acquisto o vendita in base alla direzione dell’incrocio. Segnale di acquisto
KT Round Numbers MT4
KEENBASE SOFTWARE SOLUTIONS
KT Round Numbers plots the round number levels which are also commonly known as psychological levels in the Forex world. In the context of Forex trading, round number levels are those levels in which there are two or more zeroes at the end. They are named as 00 levels on the chart. Some traders also consider the halfway points as a valid round number level. They are named as 50 levels on the chart. Use of round number levels in trading Round number levels work as strong support and resistance
KT Inside Bar Advanced MT4
KEENBASE SOFTWARE SOLUTIONS
Despite the popularity of inside bar pattern among the traders, using it as a standalone signal doesn't provide any edge in the market. KT Inside Bar Advanced indicator solves this problem by combining the classic inside bar pattern with the "ECE" cycle and Fibonacci extensions. Using this indicator in place of our classic inside bar indicator will provide a tremendous advantage and edge in the market. What is the ECE cycle? In financial markets, the price never moves in a straight line but u
Filtro:
Forex-Spinner
515
Forex-Spinner 2024.12.11 14:00 
 

Indicator clearly does what it promised. In my Trading overview it is helpful. I have alarm settings on, which helps me in my manual trading. Thanks I have some further wishes and I will contact the programmer for a possible upgrade.

KEENBASE SOFTWARE SOLUTIONS
54583
Risposta dello sviluppatore Nitin Raj 2024.12.11 21:18
Thanks for your valuable feedback.
Rispondi alla recensione