 MetaTrader 5
 Experts
 Indicateurs
 Bibliothèque
 Utilitaires
 Widgets
 Règles
Regardez les tutoriels vidéo de Market sur YouTube
Comment acheter un robot de trading ou un indicateur
Exécutez votre EA sur
hébergement virtuel
hébergement virtuel
Test un indicateur/robot de trading avant d'acheter
Vous voulez gagner de l'argent sur Market ?
Comment présenter un produit pour qu'il se vende bien
Indicateurs techniques pour MetaTrader 5 - 167
 Les signaux provenant des indicateurs techniques jouent un rôle crucial dans l'ouverture et la clôture des transactions sur les marchés boursiers et les marchés forex. L'essence des indicateurs est une transformation mathématique du prix d'un symbole financier visant à prévoir les changements de prix futurs. Testez les indicateurs techniques pour mieux prédire le comportement du marché et en tirer profit.

AutoLevelsPro — un indicateur qui analyse les données de prix et marque automatiquement les zones de support et de résistance .
Il a été spécialement conçu pour fonctionner sur des unités de temps courtes , idéalement sur le graphique en 15 minutes , où le marché réagit de manière plus dynamique. Données utilisées : High — prix le plus haut de la bougie Low — prix le plus bas de la bougie Close — utilisé pour le calcul de l’ATR Horodatage de chaque bougie pour placer les zones ave

Smart Risk Manager Pro – Glissez et tradez en toute confiance Smart Risk Manager Pro est un outil professionnel de gestion du risque directement sur le graphique, qui calcule la taille de votre position en fonction de votre risque en dollars. Il suffit de cliquer et faire glisser sur le graphique pour que l’indicateur affiche instantanément : Direction (Buy / Sell) Distance en points Taille de lot recommandée basée sur votre valeur RiskUSD L’outil est ultra léger, extrêmement rapide et conçu pou

Indicateur intelligent de signaux de trading « Red and Green Light » Présentation du produit Red and Green Light est un indicateur professionnel de signaux de trading basé sur l’algorithme T3 à lissage multi-niveaux. Il intègre un système visuel de feux tricolores, une reconnaissance intelligente des signaux, des alertes de risque et un système d’alertes multiples. Que vous soyez trader manuel ou développeur d’Expert Advisors (EA), cet indicateur vous aide à saisir les opportunités du marc

Comprehensive Trading Analysis Tool This tool has four main parts that help traders understand the market and manage risk in a simple way 1 Risk and Reward Visual Tool It shows two boxes on the chart a pink box for risk and a navy blue box for reward It shows the risk to reward ratio You can move and resize the boxes It shows pips and possible money for risk and reward It gives a clear picture of possible profit and loss It helps plan trades before entering It keeps risk levels consistent It hel

King Smart Liquidity MT5 est un indicateur analytique avancé spécialement conçu pour suivre les flux monétaires institutionnels et les grandes banques sur le Forex, l'or, les indices, le Bitcoin et autres marchés. Cet indicateur a été développé sur la base de la méthodologie "Smart Money Concept", qui s'appuie sur la compréhension de l'action du prix, des zones de liquidité et du comportement des grandes institutions financières sur le marché. Cet indicateur ne se contente pas de tracer des lig
What It Does for xauusd only Finds Order Blocks (ANN + SMC) on big and small timeframes. Marks them with clean bullish/bearish zones. Drops arrows (blue = BUY, red = SELL) right inside each block. Shows an info panel on the right with the exact high/low of the newest blocks. Lets you change chart colors (background, bull candle, bear candle) instantly. How To Use It Drop the indicator into MQL5/Indicators → restart MT5. Add it to your chart. In the settings: Pick your background , bull candle ,

Moving Polynomial Regression The Moving Polynomial Regression indicator provides traders with a statistically robust and adaptive method for identifying the true trend, predicting immediate momentum shifts, and filtering market noise. Unlike traditional moving averages that simply lag the price, this tool fits an optimal polynomial curve to the market, giving you a dynamic and predictive view of price action. Key Advantages Superior Noise Filtering: Uses advanced mathematical techniques
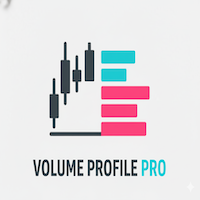
Indicateur Volume Profile Pro Cet indicateur est l'outil Volume Profile Pro , qui aide à analyser "à quel prix l'activité de trading est la plus importante". Il dispose des fonctionnalités avancées suivantes : Modes d'affichage (Display Modes) Volume Profile (Normal) : Affiche le volume total des échanges (Total Volume) à chaque niveau de prix pour identifier les zones clés de support et de résistance. Delta / Money Flow : Affiche la "différence" entre la pression d'achat et de vente (Buy vs Sel

Extension TradingView Apportez les outils de dessin et d’analyse de type TradingView directement sur votre graphique MetaTrader Utilisez des graphiques illimités sans restrictions de plateforme Créez et gérez des alertes illimitées basées sur des conditions personnalisées Utilisez des indicateurs populaires de type TradingView dans MetaTrader Après l'achat, vous recevrez un dossier supplémentaire contenant des indicateurs ainsi qu’un guide d’installation Introduction
Trading View Extension est

SYSTÈME DE SCORING DU MARCHÉ – Indicateur Avancé de Trading Multi-Unités de Temps Système professionnel d’analyse de marché combinant indicateurs techniques, modèles de machine learning et confirmation multi-timeframe pour fournir des signaux de trading extrêmement précis. FONCTIONNALITÉS PRINCIPALES Analyse Multi-Timeframe :
Confirmation des signaux entre différents horizons (M5, H1) pour augmenter la probabilité de réussite Moteur de Scoring Intelligent :
Calcule les scores de tendance, de r

LiquidZones Pro automatically detects and visualizes supply and demand zones on your chart. By analyzing swing highs and lows over a configurable lookback period, the indicator highlights critical areas where price has historically reacted. Key Features: Automatic detection of supply (resistance) and demand (support) zones. Configurable lookback period , swing strength , and zone width . Zones merge automatically if price levels are close, keeping charts clean. Minimum touch filter to avoid wea
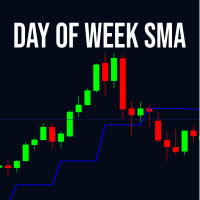
L'indicateur Day Of Week SMA calcule une moyenne mobile basée sur les prix de clôture d'un jour de la semaine spécifique choisi par l'utilisateur. Il prend en charge divers types de moyennes mobiles, y compris Simple (SMA), Exponentielle (EMA), Lissée (SMMA) et Linéairement Pondérée (LWMA). La période définit le nombre d'instances du jour sélectionné à inclure dans le calcul. Cet outil est utile pour analyser les schémas hebdomadaires sur les marchés financiers, aidant les traders à identifier l
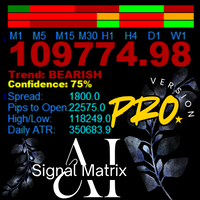
AanIsnaini Signal Matrix MT5 PRO - Bayesian Multi-Timeframe Dashboard "Advanced multi-timeframe dashboard with Bayesian Learning, real-time Signal Strength, and persistent memory. The older it runs, the smarter it becomes."
The free version (v1.3) gave you visibility. The PRO Version gives you the edge . AanIsnaini Signal Matrix MT5 PRO is a sophisticated multi-timeframe analysis system that combines classical technical indicators with adaptive probabilistic reasoning. Designed for serious tra
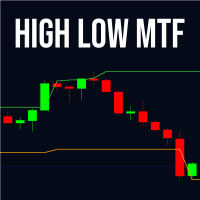
High Low MTF – Niveaux de Plus Hauts et Plus Bas Multi-Timeframe High Low MTF est un indicateur professionnel permettant d’afficher des zones clés de support et de résistance basées sur les plus hauts et les plus bas provenant de n’importe quelle unité de temps. Il affiche ces niveaux issus de périodes inférieures ou supérieures directement sur le graphique actuel, offrant une vision fiable du marché en multi-timeframe. Il convient au scalping, au day trading, au swing trading ainsi qu’aux systè

BUY and SELL smart The BUY and SELL Smart Indicator is a next-generation trading tool engineered for precision scalpers, intraday strategists, and professional analysts who demand both speed and clarity in market visualization. It seamlessly integrates smart candle-based analytics, adaptive ATR logic, and real-time economic event awareness — giving you a fully synchronized view of market volatility and momentum. Through an elegant and optimized interface, FlashScalp delivers instant signal fee

Fine Timeframes est un indicateur de période inférieure à la minute pour MT5. Il crée des graphiques avec des intervalles de 1 à 30 secondes, vous donnant accès aux mouvements du marché qui restent invisibles sur les graphiques à la minute et à l'heure, tout en préservant l'intégralité des fonctionnalités de trading : vous pouvez ouvrir et fermer des positions comme sur les périodes standard. Fine Timeframes fonctionne uniquement sur les ticks en temps réel et n'est pas conçu pour le testeur de
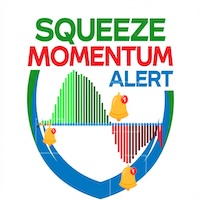
Squeeze Momentum Alert 1. Identifie les Points "d'Explosion" du Prix (The "Squeeze") Le principal avantage est sa capacité à repérer les périodes de "consolidation" avant un mouvement massif. Pourquoi c'est bon : L'outil vous dit : "Le graphique se comprime, préparez-vous à la prochaine envolée" , pour ne pas rater le début d'une tendance majeure. 2. Distingue la "Force" de la Tendance (Color Coded Momentum) L'histogramme utilise 4 couleurs : Citron vert (Lime) : Hausse forte. Vert foncé (Dark G

Engulfing Signal Pro is a powerful and lightweight MQL5 indicator designed to deliver high-probability market entries based on candlestick Engulfing patterns combined with advanced internal calculations. This indicator is built for traders who demand accuracy, clarity, and speed—without repainting. Key Features Smart Engulfing Detection
Automatically detects bullish and bearish Engulfing patterns using strict candle-body rules, ensuring that only meaningful price reversals trigger signals. Mult

RSI Divergence PRO (Non-Repaint) – MT5 Indicator Overview
RSI Divergence PRO automatically detects Bullish and Bearish Divergence between price and RSI and plots clear arrows on the chart. The indicator is 100% non-repainting because signals are generated only after pivot points are fully confirmed.
This is one of the most reliable reversal detection tools used by both beginners and professional traders. ------------------------------------------------------------------ -------------------
This is MT5 version only. For MT4 visit: https://www.mql5.com/en/market/product/156000/
Detailed blog post with screenshots: https://www.mql5.com/en/blogs/post/765529
Features Overview Bull and Bear Power Visualization: Histograms or Lines or Bands Combined Bull/Bear Power (BBP) Mode: To see the net power balance Customize Colors: for instant pattern recognition Smoothing (Optional): reduces noise for cleaner signals Additional Filter Options: Price Divergence visualization to spot potential
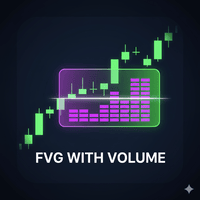
FVG Volume Profile (Institutional Price Action) Unlock the hidden liquidity inside Market Imbalances. The FVG Volume Profile is an advanced Price Action indicator that goes beyond standard Fair Value Gap detection. It looks inside the gap using lower timeframe data to construct a Volume Profile specifically for that imbalance. This helps you identify exactly where the "Smart Money" is defending positions. Key Features: Internal Volume Profile: Automatically scans lower timeframes
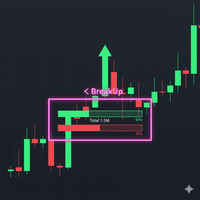
Breakout Boxes with Volume Pressure This indicator automates the identification of key consolidation zones (Supply and Demand) based on Market Pivots and Volatility (ATR). Unlike standard support/resistance tools, this indicator provides a unique Volume Pressure Analysis inside every box, giving you insight into the battle between Buyers and Sellers before a breakout occurs. Key Features Automated Supply & Demand Zones: Automatically detects significant Pivot Highs and Lows to draw dyna
Trend Duration Forecast It utilizes a Hull Moving Average (HMA) to detect trend direction and statistically forecasts the probable duration of the current move based on historical market behavior. Key Features Smooth Trend Detection: Uses the Hull Moving Average (HMA) to filter noise while minimizing lag, providing clean Bullish/Bearish signals. Real-Time Duration Counter: Displays a dynamic label at the start of the current trend showing the "Real Length" (number of bars the trend has b

Spot high-impact reversal zones with precision. This indicator highlights candles where the wick exceeds a customizable percentage of total candle length — a key signal of price rejection and potential turning points. Features include: • Wick ratio filter (e.g. wick > 50% of candle length) • Minimum candle length threshold (in pips) • Real-time chart arrows for upper/lower wick dominance • Optional alerts for fresh wick signals Perfect for traders who rely on candlestick psychology to a

Nadaraya-Watson Envelope Indicator for MT5 Overview
This indicator expands on the original Nadaraya-Watson smoothing methods by introducing a dynamic envelope system built using kernel regression. Unlike the standard Nadaraya-Watson estimator, this tool applies a contrarian approach: the envelope boundaries are designed to identify potential reversal zones when price extends too far from its smoothed trend estimate. The indicator includes integrated alerts based on price crossings above or belo

Trade in the Footsteps of the Institutions The SMC Institutional Order Flow indicator brings the power of professional trading strategies directly to your MetaTrader 5 terminal. Based on the core principles of Smart Money Concepts (SMC) , this advanced tool automatically maps the key levels and structures used by banks and large institutions to move the market. Stop guessing and start seeing the market through the lens of order flow. This all-in-one suite identifies where institutions have
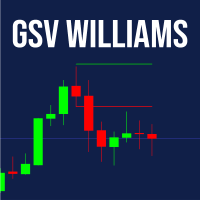
GSV – Guided Swing Value Levels Le GSV – Guided Swing Value Levels est un indicateur exclusif développé pour les traders souhaitant identifier les zones de prix où le marché tend à réagir avec une plus grande précision statistique.
Son calcul s’inspire des concepts présentés par Larry Williams dans son livre « Long-Term Secrets to Short-Term Trading » , soulignant l’importance de la moyenne statistique des swings du marché pour prévoir les zones où le prix est susceptible de s’arrêter, corriger
Multi Pivot Pro — 5 Pivot Methods in One Indicator (MT5) Multi Pivot Pro draws daily pivot levels on your MetaTrader 5 chart using five different calculation methods. Switch between methods from a single dropdown — no need to install five separate indicators. Pivot points are widely used support and resistance levels that help traders plan entries, exits and stop placement. Pivot methods Classic Fibonacci Camarilla Woodie DeMark (DM) Features Pivot (P), resistance R1–R3 and support S1–S3 levels

Link to our products: https://www.mql5.com/en/users/alireza.saeedian/seller TradeX candlestick indicator is one of the leading indicators in the market. you can show/hide any pattern with one click or you can change the setting from setting tab.
If you don't have any information about candle stick pattern you can watch it from my YouTube channel. This indicator will be updated day by day.

Uncover Institutional Footprints with Volume-Based Supply & Demand Liquidity Zones is a sophisticated Price Action and Volume analysis tool designed for MQL5. Unlike standard Support & Resistance indicators that rely solely on price history, this indicator integrates Volume Volatility Analysis to identify high-probability reversal levels. It automatically detects key Swing Highs and Swing Lows where significant trading activity (volume) occurred. In Smart Money Concepts (SMC), these areas r
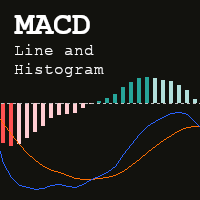
The MACD Line and Histogram is an enhanced version of the classic Moving Average Convergence Divergence (MACD) indicator. While the traditional MACD consists of two lines—the MACD (Main) line and the Signal line —the extended version introduces a Histogram that visually represents the difference between these two lines. Inputs Fast MA method (Simple, Exponential, Smothed or Linear weighted) Fast MA period Slow MA method (Simple, Exponential, Smothed or Linear weighted) Slow MA period

Multi Indicator Scanner — 10 Indicators, One Panel (MT5) Multi Indicator Scanner reads 10 popular technical indicators at the same time and shows each one as BUY, SELL or NEUTRAL in a single on-chart panel, together with an overall summary. Instead of loading and checking ten indicators one by one, you see the full picture in one place. Indicators analyzed RSI (Relative Strength Index) Stochastic %K CCI (Commodity Channel Index) ADX (Average Directional Index) MACD Moving Average Williams %R Mom

TouchGuard Alert – Advanced Price Alert & Notification Indicator for MetaTrader 5 (MT5) TouchGuard Alert is a fast, lightweight, and highly accurate price-touch Alert & Notification system designed for MetaTrader 4 (MT4) and MetaTrader 5 (MT5) . It automatically sends real-time Alerts, Pop-Up Alerts, Email Notifications, Push Notifications and early-warning notifications when price touches or approaches your chart objects. Key Features (High-Precision Alert & Notification System) Comprehensive P

Adaptive RSI is an advanced Relative Strength Index indicator. Adaptive RSI can change the look back period dynamically based on current market condition. Adaptive RSI adapts to the market changes as much as possible. Adaptive RSI is more advanced than conventional RSI.
Adaptive RSI is a tool to catch more over-bought/sold opportunities!
Features Dynamic look back period - Adaptive RSI changes the look back period dynamically basing on smartly designed adaptive methods. No worry about RSI peri
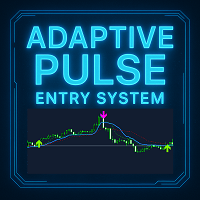
Adaptive Pulse - Système Professionnel de Signaux de Trading Description Brève Adaptive Pulse est un indicateur professionnel de signaux de trading basé sur une technologie d'analyse de marché adaptative. L'indicateur s'ajuste automatiquement à la volatilité et génère des signaux d'achat et de vente précis avec des flèches visuelles sur le graphique. Il fonctionne sur tous les intervalles de temps et instruments financiers. Caractéristiques Principales L'indicateur fournit un système d'analyse à

Point and Fignure (P&F) chart plots price against changes in direction by plotting a column of Xs as the price rises and a column of Os as the price falls.
Features Support for several kinds of price types - High/Low and Close. Clean and easy-to-read chart. Displays column high and low prices as indicator values. Support for both 4 and 5-digit brokers. Customizeable colors.
Advantages Filter insignificant price movements and noise. Less noise and more stable work. Focus on important price move
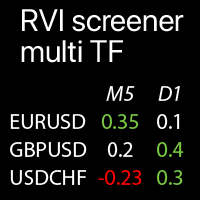
Valeurs RVI multi-timeframes sur les Symboles sélectionnés : comparez les tendances actuelles du marché L' indicateur affiche les valeurs de l'Indice de Vigueur Relative (RVI) de tous les timeframes et Symboles sélectionnés dans un seul tableau , ce qui vous permet d' analyser rapidement les tendances de prix actuelles du marché . Mon utilitaire multifonctionnel : 66+ fonctionnalités | Contactez-moi pour toute question | Version MT4 C
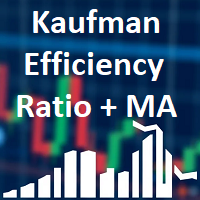
Shows Kaufman Efficiency Ratio value and smoothed by MA. Calculation is based on movement divided by volatility on a specified period. Levels are adjustable as well as visualization. Parameters: KERPeriod - period for ratio calculation. EMAPeriod - period for moving average. Shift - indicator shift. HigherLevel - low value of the higher zone. LowerLevel - high value of the lower zone. ShowHigherZone - allow higher zone drawing. HigherZoneColor - higher zone color. ShowLowerZone - allow lower zon

TradeEasy Panel - Professional Trading Control Panel Overview TradeEasy Panel is a comprehensive, professional-grade trading control panel designed for MetaTrader 5. This powerful indicator provides traders with an all-in-one solution for executing trades, managing positions, and monitoring market activity directly from the chart window. With its intuitive interface and advanced features, it streamlines the trading process for both novice and experienced traders. Key Features Real-Time Market M
Session Range Pro – Professional Session & ADR Analytics for MetaTrader 5 See what really moves the market – by session, by day, with stats that actually matter. What is Session Range Pro? Session Range Pro is a professional-grade MetaTrader 5 indicator that highlights the true behavior of price during the three main trading sessions: Asia London New York It draws clean, color-coded session ranges directly on your chart, and powers them with deep statistics : average session range, breakout win

Gamma & Volatility Levels Pro [XAUUSD Edition] – The indicator used by professional gold traders in 2025 Fully automatic indicator developed exclusively for XAUUSD (Gold). Displays in real time the most powerful institutional levels that move gold price every single day: • HVL (High Volatility Level) – Orange dashed line Dynamic extreme volatility level (20-period SMA + 1 standard deviation). Gold bounces or breaks this level 87 % of sessions with moves of +$40 to +$120. • CALL RESISTANCE – Blue
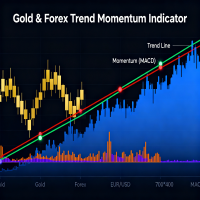
Overview QuantumEdge Oscillator is the ultimate momentum and trend detection tool for serious traders. After extensive testing and refinement, this professional indicator delivers reliable signals across all market conditions and timeframes. Used by discretionary traders and algorithmic systems worldwide. Advanced Algorithm The indicator employs a sophisticated dual-layer approach: Primary Engine : Exponential moving average applied to RSI for smooth momentum tracking Volatility Adjustment : Smo
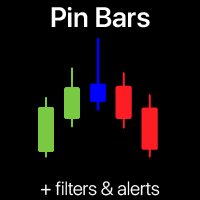
Scanner de modèle Pin Bar | Alertes intelligentes et filtre de tendance Ne manquez plus jamais un retournement Pin Bar à haute probabilité ! Ce scanner automatisé de modèle Pin Bar fait le travail difficile pour vous.
Cet outil de trading scanne vos graphiques en temps réel, identifie le puissant modèle Pin Bar (Marteau/Étoile filante) et vous envoie des signaux instantanés. L'indicateur de trading est conçu pour les traders débutants et experts qui souhaitent exploiter la puissance de l'actio

HolyGrail M N/B: All our product purchase comes with our free ‘’DAILY SCALPER EA’’ - bit.ly/4qlFLNh Whatsapp Developer for yours after successful purchase
m ost wanted Edition Overview ATTENTION ALL TRADERS!
FINALLY UNVEILED: The "HolyGrail MostWanted" Indicator - Your All-in-One Institutional Trading Dashboard for MetaTrader 5
SPECIAL BONUS (VALID TILL JUNE 2026)- OUR DAILY SCALPER EA for BTCUSD and VIX75 •·································································•
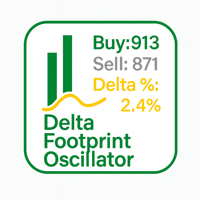
Delta Footprint Oscillator – Professional Order Flow Tool for MT5 The Delta Footprint Oscillator is a powerful order-flow indicator that lets you see buy/sell pressure directly inside your chart. It tracks micro-price movements tick-by-tick and calculates real-time Delta , Delta% , and a full per-bar footprint history .
Perfect for scalpers, day traders, volume/flow traders, and anyone who wants deeper insight into market aggression. Key Features Real order-flow delta from tick-based bid/ask m
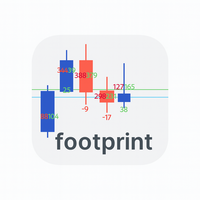
Footprint_Indicator_Fixed is a lightweight yet powerful footprint tool designed for traders who want real-time insight into market microstructure.
This indicator displays buy/sell tick counts and delta values directly on each candle, helping you instantly see which side of the market is dominant. Key Features ️ Real-time tick-based buy/sell volume counting ️ Delta footprint displayed underneath each candle ️ Clean and simple on-chart text objects—no buffers, no clutter ️ Automatic management
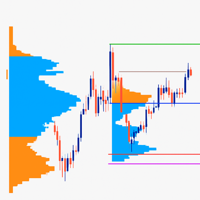
Daily Volume Profile (Multi-Day) for MT5 This indicator provides a clean, fast and highly optimized Daily Volume Profile for the last N days , updated automatically every minute without flickering or chart lag.
It draws full market structure: POC, VAH, VAL, Value Area, Day High/Low, Volume Distribution Buckets , and adapts dynamically to any timeframe using built-in shifting logic. Key Features:
Volume Profile for the last N days (configurable)
True daily POC, VAH, VAL with automatic labels
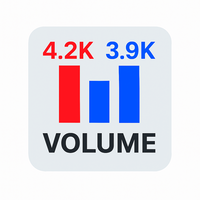
Volume Display Indicator – Clean and Powerful Volume Visualization This professional MT5 indicator displays tick volume as a color-coded histogram and automatically adds clear volume labels above each bar for the current trading day. Rising candles are painted blue, falling candles red, giving you instant insight into market strength and momentum. Key Features: Colored volume histogram (blue/red) Automatic volume labels for each bar of the current day Smart scaling for perfect readability Auto-c

SMART STRUCTURE – Analyse de la structure du marché et SMC pour MT5 Comprenez la structure du marché. Identifiez les zones de prix clés. SMART STRUCTURE est un indicateur d’analyse visuelle pour MetaTrader 5, conçu pour identifier la structure du marché, les cassures confirmées, les Order Blocks et les Fair Value Gaps (FVG). Il organise ces informations directement sur le graphique et intègre un panneau de contrôle permettant de consulter la direction du marché et les niveaux de prix importants.
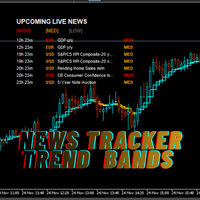
Price Following Trend Indicator with Live Economic News Filter
Overview Price Following Trend Indicator is a professional MetaTrader 5 indicator designed to help traders visualize market direction while staying aware of important economic news events. The indicator combines an intelligent moving average trend ribbon with a built-in live economic calendar, allowing traders to monitor market conditions without leaving the chart. It is suitable for Forex, Gold, Indices, Commodities, and other C

This indicator will help traders quickly identify inside bars, which are often used in price action trading strategies as potential consolidation or continuation patterns. An inside bar formation is a counter trend candle on both sides as it didn't break the previous candle high or low.
Key feature: Identify inside bars in real-time. Colours inside bars while keeping normal bars. Configurable history bars. Optional pop-up alerts and phone notifications with symbol name and time of detection. W
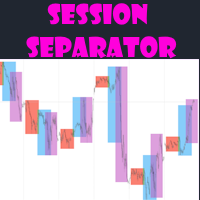
Session separator indicator draws boxes for each trading session to show the trader open and close hours with its high and low.
Key features: Option to set hours and colours for 3 trading sessions. Boxes update immediately when breaking out of high/low. Hour shift or auto time zone. Choose the amount of days to draw session boxes. Indicator works on H1 and lower for visibility. Choose border style
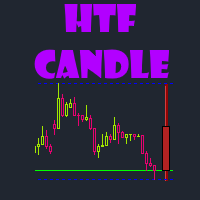
HTF Candle helps traders by drawing selected higher timeframe candle on your open chart.
This way it is easier to manage your bias without having to switch time frames which costs time. Key features: Select the higher time frame to retrieve data from. Enter the amount of candles to draw Personalize the drawn candle colours Optional horizontal lines for high and low Works on any time frame
Product Name: Combined KD Enhanced Multi-Signal Stochastic Indicator Core Benefits: - **Signals in 1 Glance**: Red (buy) / green (sell) arrows + dual curves; auto-marked 20/80 overbought/oversold zones – no complex math needed. - **All-Market Fit**: Default KD(9,3,3); customizable settings work for stocks/forex/futures (any MT5 timeframe: M1-MN1). - **Lag-Free Performance**: 20% faster than official MT5 Stochastic – smooth loading even on large historical datasets.
Key Features: - Intui
FRAMA Matrix Pro is a multi-layer trend and momentum intelligence panel designed for traders who demand clarity, precision, and confirmation before entering the market.
The system combines several advanced filters into one clean, informative dashboard: FRAMA Trend Engine (fast adaptive trend detection) Dual EMA Bias Structure (20 & 200) ADX Strength Filter RSI Directional Bias Force Index Volume-Price Power ATR Candle Structure Analysis Fractal Dimension (D) Noise Filter Stochastic PRO Logic FRA

Buyer Seller Balance Analyzer offre une vue complète de la force des acheteurs et des vendeurs sur plusieurs unités de temps. Composants principaux : Tableau Buyer/Seller Balance Affiche le ratio acheteurs/vendeurs Couvre les unités de temps de M1 à MN1 Valeurs codées par couleur (vert = acheteurs, rouge = vendeurs) Indicateurs clés : Buyers (%) – Pourcentage d’acheteurs Sellers (%) – Pourcentage de vendeurs ️ Balance – Différence entre acheteurs et vendeurs Strengt

SuperTrend Pro MT5 - The Ultimate Trend Following System
For MT4 version : https://www.mql5.com/en/market/product/156454
Unlock the full potential of the SuperTrend indicator on MetaTrader 5. Designed for traders who need precision and performance. SuperTrend Pro MT5 is a next-generation trading system built for the modern trader. It combines the classic SuperTrend with advanced Multi-Timeframe (MTF) analysis and smart filtering to identify high-probability setups on the MT5 platform. Why Sup
The Trend Duration Forecast MT5 indicator is designed to estimate the probable lifespan of a bullish or bearish trend. Using a Hull Moving Average (HMA) to detect directional shifts, it tracks the duration of each historical trend and calculates an average to forecast how long the current trend is statistically likely to continue. This allows traders to visualize both real-time trend strength and potential exhaustion zones with exceptional clarity. KEY FEATURES Dynamic Trend Detection: Utiliz

Nebula Trend Nebula Trend est un indicateur de retournement de tendance simple conçu pour identifier avec précision les points de retournement potentiels du marché. L'indicateur génère des signaux clairs de flèches d'achat et de vente directement sur votre graphique, ce qui facilite la détection du moment où la tendance est susceptible de s'inverser. Que vous soyez un débutant à la recherche de signaux de trading simples ou un trader expérimenté recherchant des confirmations de retournement fiab

Il s'agit d'une version activement mise à jour, recompilée et enrichie pour les versions actuelles de MT5.
Les marchés des devises évoluent en termes relatifs. Une configuration EURUSD qui semble solide peut échouer si l'euro s'affaiblit de manière générale, ou ne réussir que parce que le dollar est en baisse partout ailleurs. Analyser une paire de devises de manière isolée revient à passer à côté de ce contexte.
Currency Strength Suite offre une vue structurée et en temps réel de la force re
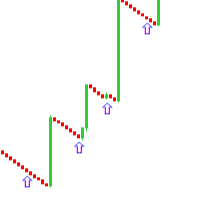
LES PIDO POR FAVOR QUE CUANDO ADQUIERAN EL PRODUCTO SE COMUNIQUEN CONMIGO PARA DARLES LOS PARÁMETROS CORRECTOS
Este indicador de trading funciona en los pares de índices sintéticos; Boom 1000, boom 900, boom 600, crash 1000, crash 900, crash 600 , en la temporalidad de M1 y este indicador es mas preciso con indicador y para obtenerlo te puedes comunicar al 0967713191 te obsequiare dos indicadores por la compra de este. Este indicador sirve para cazar picos y si quieres mas precisión y confian
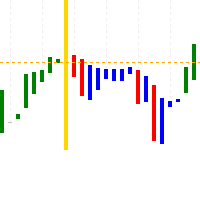
L3 Banker Fund Flow Trend Oscillator v5 is a simple translation of blackcat's work from pine script (language used by TradingView platform) to mql5. It generates buy and sell signals when two calculated buffers cross over each other in the oversold and overbought oscillator territory. Current version does not offer any changable inputs, but could be easily added in the modified version if requested.

BOS and CHoCH Detector est un indicateur conçu pour détecter les BOS (Break of Structure) et CHoCH (Change of Character) dans le cadre de la stratégie Smart Money Management . Il aide les traders à mieux visualiser le marché sur le graphique et à optimiser leur stratégie de trading. Un avantage supplémentaire de cet indicateur est son système de couleur : Vert : indique une forte probabilité de buy (achat) à venir. Rouge : indique une forte probabilité de sell (vente) à venir. Cet outil est idéa

VISUAL THEME SWITCHER PRO v3.2
Professional chart theme switcher for MetaTrader 5 with advanced features and multi-language support.
KEY FEATURES: • 9 Professionally Designed Themes • Drag & Drop Panel Interface • Multi-language Support (5 languages) • 7-Day Fully Functional Trial • Fullscreen Mode Toggle • Auto-Generated Theme Buttons • Professional Security System • Position Restoration • One-Click Theme Application
PROFESSIONAL THEMES INCLUDED: 1. NEON - Futuristic black and gree

Indicator shows balance curves based on magic number for portfolio analysis. It allows to visually estimate different strategies performance on a single symbol. Any of magic number can be hidden by clicking on the value in legend. Parameters: HideAllOnStart - all magics are hidden and can be activated by clicking on its value; MAMode - shows average profit from trades; MAPeriod - Moving average period; Magics - a string with magic numbers separated by comma like "1,2,123". If this field is empty

VIP Scalper est un indicateur professionnel de scalping Forex, conçu pour les traders recherchant des signaux précis, un stop-loss minimal et une forte stabilité.
Il est idéal pour le trading en M1 et offre d’excellentes performances sur les paires volatiles à faible spread. Avantages principaux Signaux de scalping très précis Stop-loss 2–3 pips, take-profit jusqu’à 10 pips Très peu de faux signaux grâce au filtre de tendance Logique simple avec un seul paramètre clé Fonctionne sur EURUSD, GBPU

Overlay higher timeframe candles onto the lower timeframe candles for both live time trading and back testing to see how higher timeframe candles are formed with lower timeframe candles. Helps traders to see the multi timeframe alignment between timeframes in each moment to find refined entry within market structure. Give the trader a full view of price across all timeframes by just looking at one timeframe.

Fast Multi-Timeframe Pivots – Precision Levels from M1 to W1 • Ultra-fast pivot detection across M1–W1
• Clean, stable architecture with zero repaint
• Perfect for breakout, trend, and reversal strategies
• Automatic color-coded levels for instant clarity
• Works on all assets: Forex, Crypto, Metals, Indices
• Lightweight design – ideal for real & prop-firm trading Fast Multi-Timeframe Pivots (M1 to W1) A high-performance pivot indicator designed for professional traders, automated systems, and

Key Features Visual Risk/Reward Planning Spawns interactive rectangles on the chart for Buy and Sell setups. Pink Box: Represents your Risk (Entry to Stop Loss). Green Box: Represents your Reward (Entry to Take Profit). The Green box automatically adjusts its size based on your preferred Reward Ratio (e.g., 1:2). Auto-Lot Calculation Automatically calculates the correct Lot Size based on your Account Balance and defined Risk Percentage. Takes into account the symbol's Tick Value and Cont
ICT Kill zones Professional Automate your ICT & Smart Money analysis with precise, dynamic session tracking and liquidity pivots. Here our more valuable tools
SMC Trend Trading , Easy SMC Trading , Institutional SMC Architect Volume Analysis Tools , Volume flow Profile , Market volume profile , FVG with Volume , Liquidity Heatmap Profile , Volume Spread Analysis Product Description Stop wasting time drawing boxes and lines every single day. ICT Killzones Professional is the u
Découvrez comment acheter un robot de trading sur le MetaTrader Market, le magasin d'applications de la plateforme MetaTrader.
e système de paiement de MQL5.community prend en charge les transactions via PayPal, les cartes bancaires et les systèmes de paiement populaires. Nous vous recommandons vivement de tester le robot de trading avant de l'acheter, pour une meilleure expérience client.

Vous manquez des opportunités de trading :
- Applications de trading gratuites
- Plus de 8 000 signaux à copier
- Actualités économiques pour explorer les marchés financiers
Inscription
Se connecter
Vous acceptez la politique du site Web et les conditions d'utilisation
Si vous n'avez pas de compte, veuillez vous inscrire