Inside Bar Dashboard
- Indicateurs
- Version: 2.50
- Mise à jour: 10 juin 2025
- Activations: 10

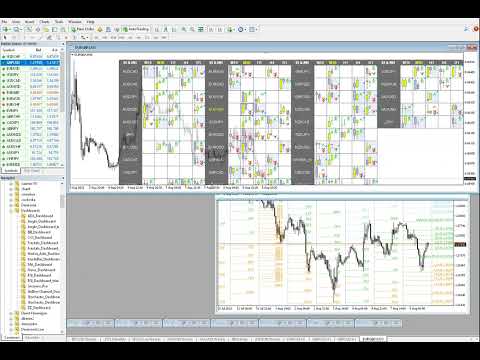
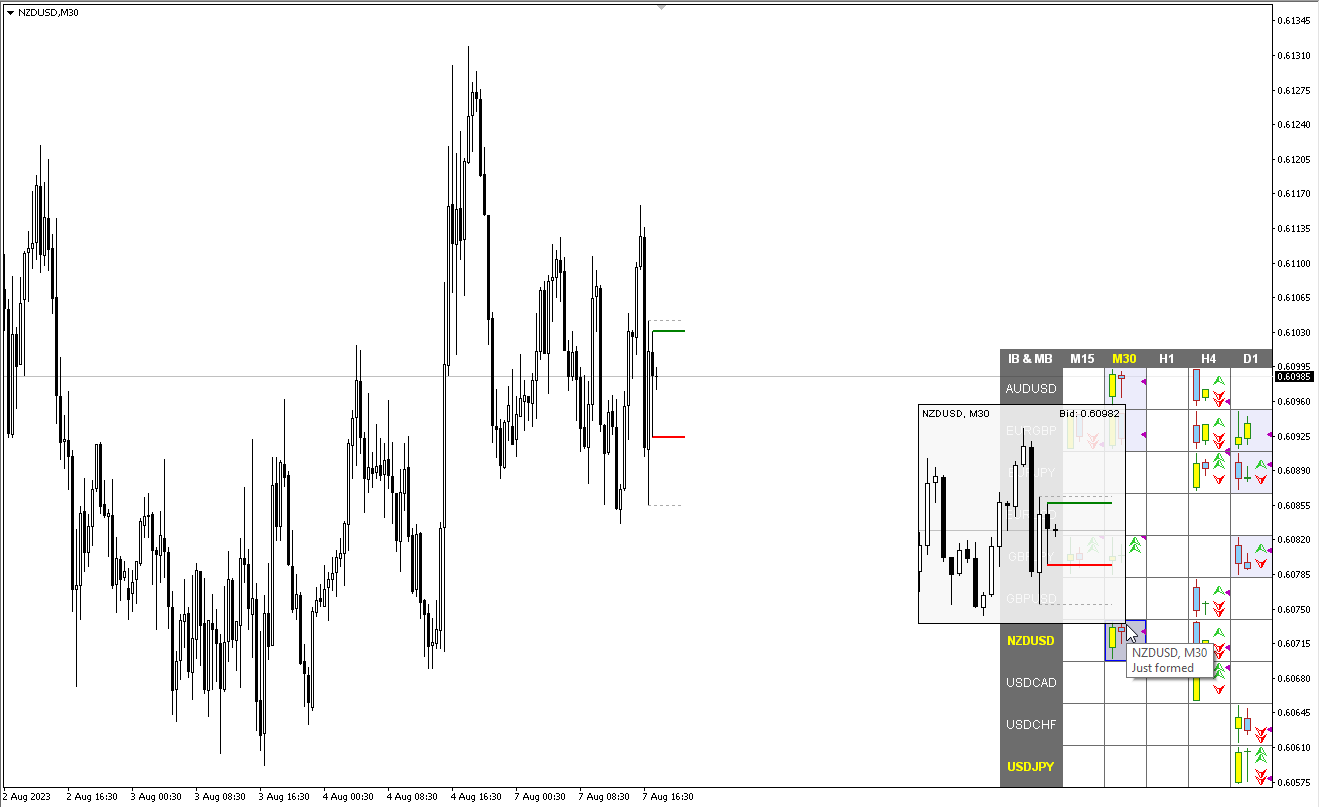
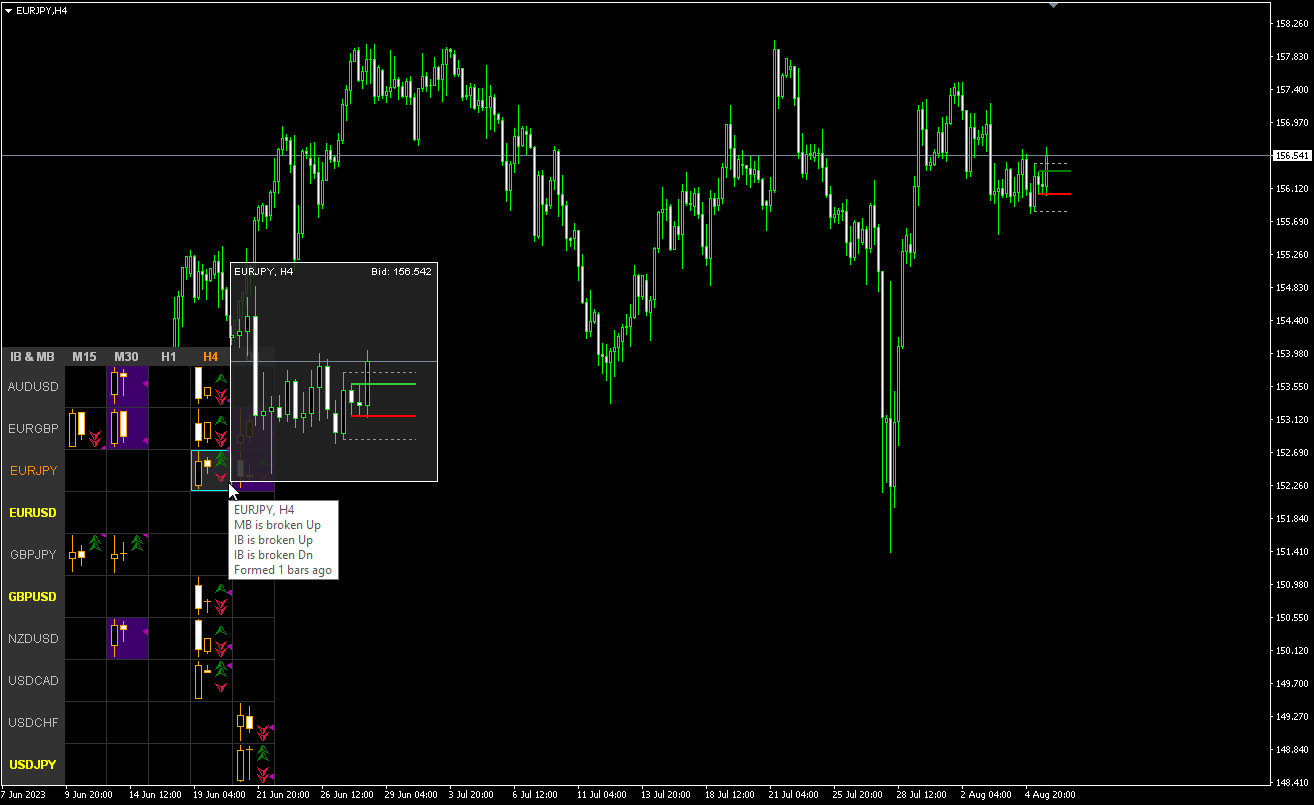
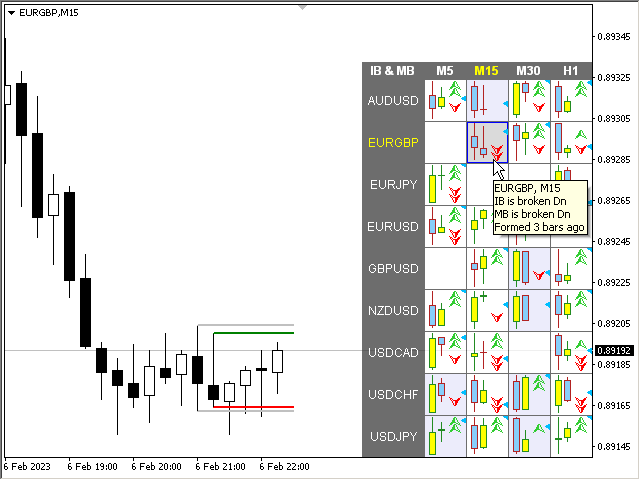
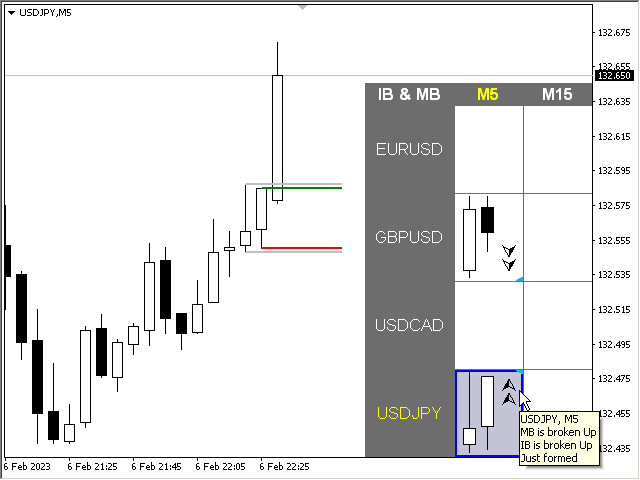
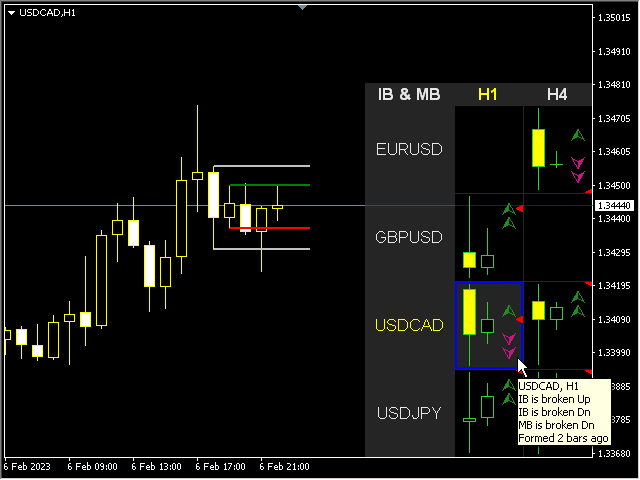
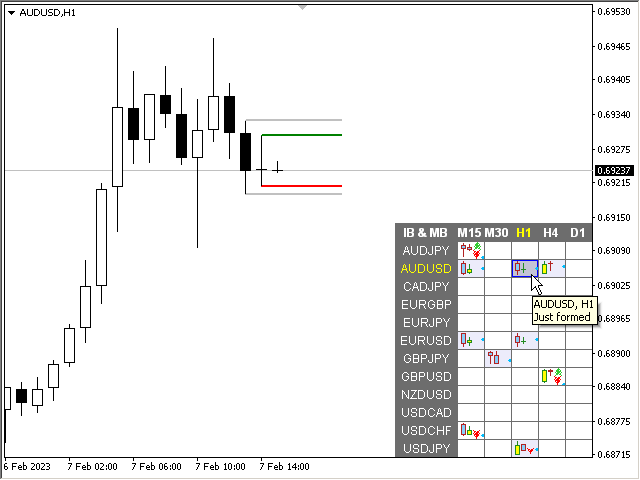
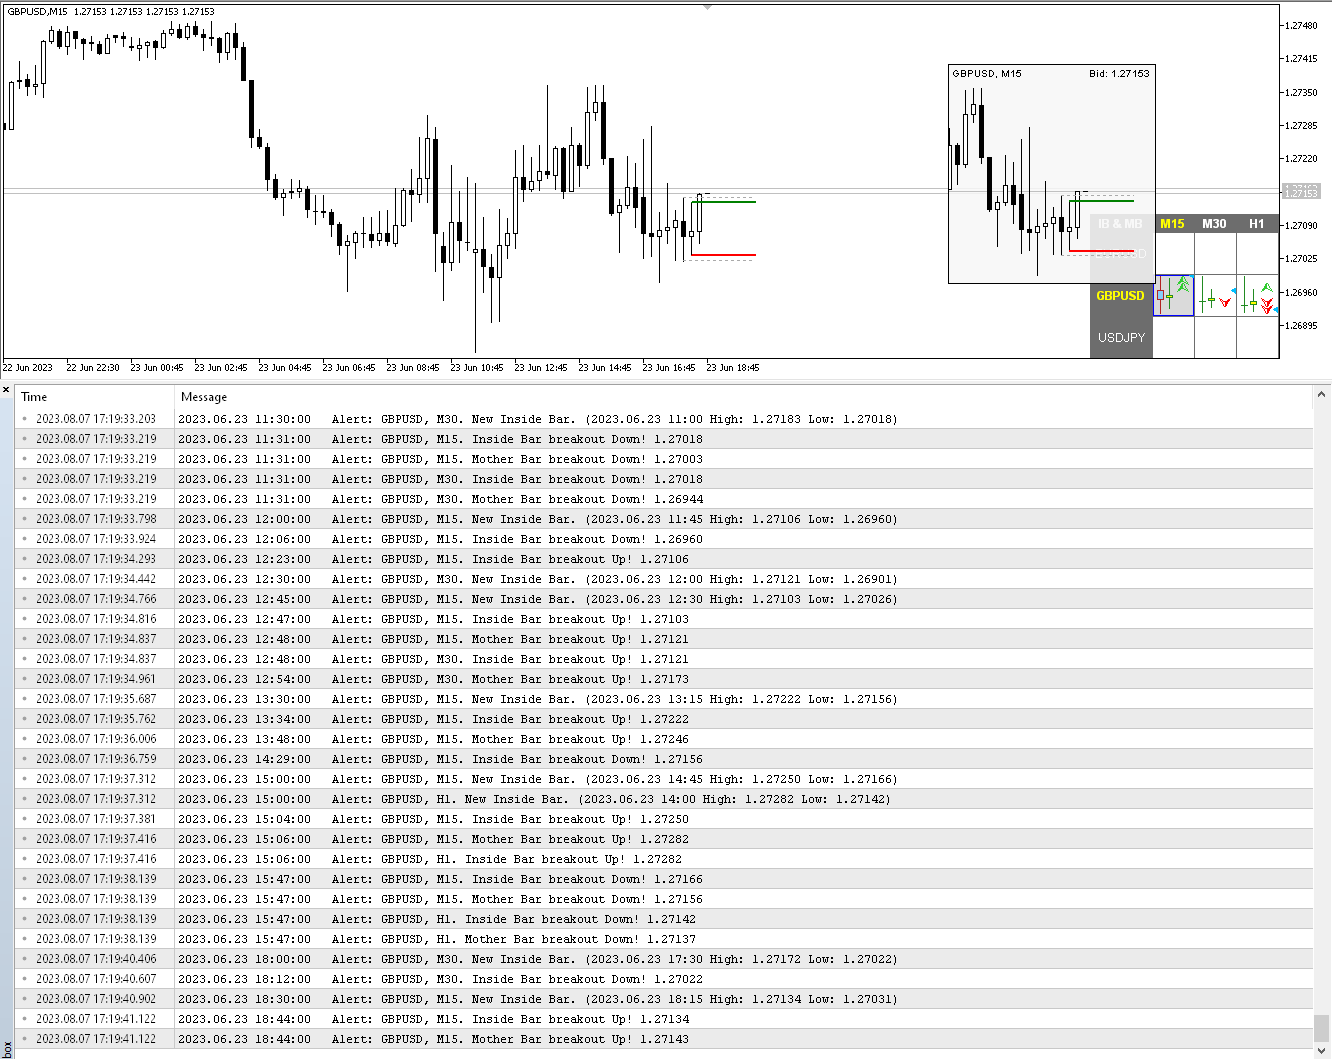
Multicurrency and multi-timeframe indicator Inside Bar (IB). In the parameters, you can specify any desired currencies and timeframes. The panel displays the last found Inside Bar (and Mother Bar) pattern, the current price position and the breakout of the levels of the Mother and Inside Bars. You can set the size and color for bars and text in the cells. The indicator can also send notifications when levels are broken. The dashboard highlights Double Inside Bar in a special color. By clicking on a cell with a period, the specified symbol and period will be opened. This is MTF Scanner — IB Dashboard.
The key to hide the dashboard from the chart is "D" by default Parameters
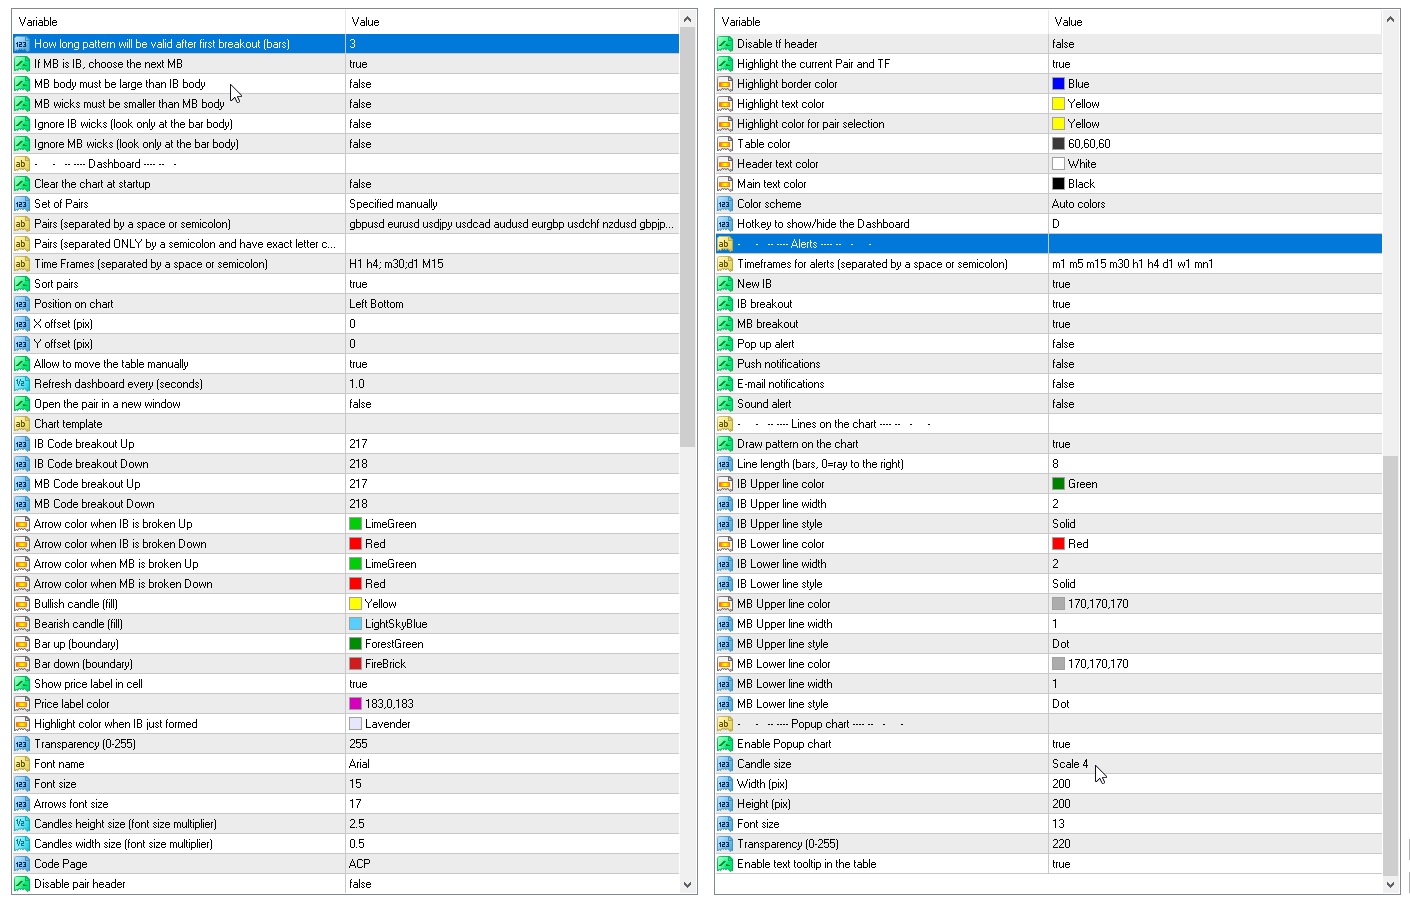
- How long pattern will be valid after first breakout (bars) — how many bars the signal will be displayed in a cell
- IB body must be inside of the MB body.
- IB body and wicks must be inside the MB body.
- If MB is IB, choose the next MB — if the found Mother Bar is the Inside Bar of the previous signal, then the previous signal will be displayed.
- MB body must be large than IB body
- MB wicks must be smaller than MB body
- Ignore IB wicks (look only at the bar body)
- Ignore MB wicks (look only at the bar body)
Clear the chart at startup
Set of Pairs:
— Market Watch of the MT
— Specified manually
— Current pair.
Pairs (separated by a space or semicolon) — list of symbols separated by spaces or semicolons. The currency names should be written exactly like the broker's, keeping the case and prefix/suffix.
Time Frames (separated by a space or semicolon) (multi timeframe)
Sort pairs
Position on chart
X offset (pix)
Y offset (pix)
Refresh dashboard every (seconds)
Open the pair in a new window
Chart template
Code breakout Up
Code breakout Down
Arrow color when IB is broken Up
Arrow color when IB is broken Down
Arrow color when MB is broken Up
Arrow color when MB is broken Down
Bullish candle (fill)
Bearish candle (fill)
Bar up (boundary)
Bar down (boundary)
Show price label in cell
Price label color
Highlight color when IB just formed
Candles height size (font size multiplier)
Candles width size (font size multiplier).
New IB - alert when a new IB is formed.
IB breakout - alert when IB levels are broken.
MB breakout - alert when MB levels are broken.
Draw pattern on the chart.
Lines length (bars).

The developer is simply incredible! There aren’t many words—just amazing results. I've purchased many of his products—each one better than the last. The support is fantastic. If someone wants a serious “view” of the market, these are the ultimate tools! A thousand thanks, Taras! Keep up the great work!