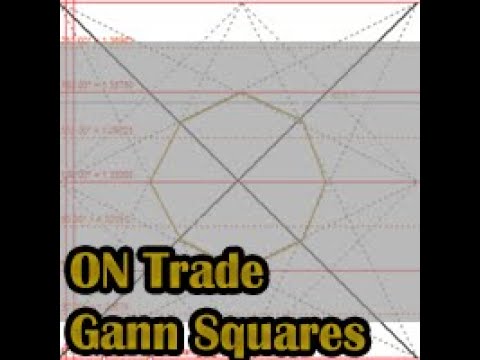
ON Trade Gann Squares

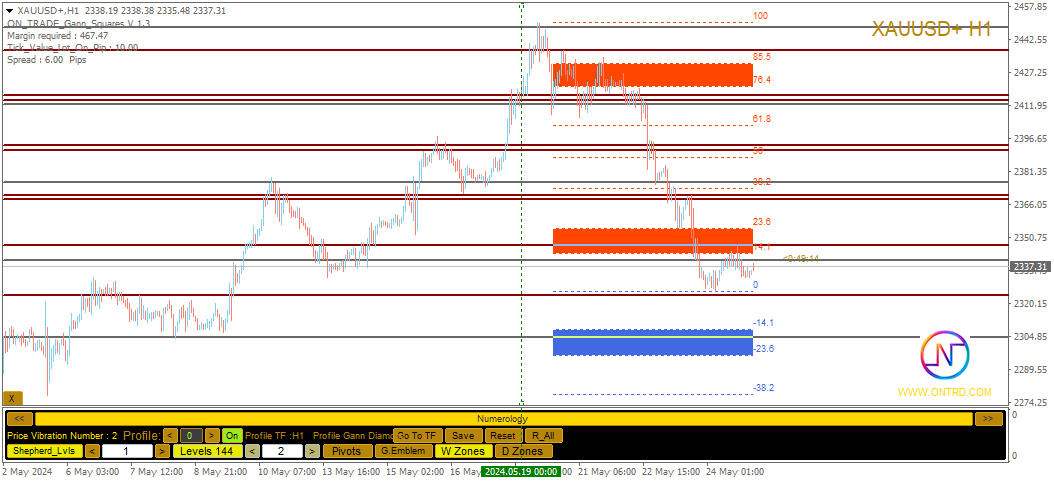
L'indicateur de Carré Gann est un puissant outil d'analyse du marché basé sur l'article "Formule Mathématique pour les Prédictions de Marché" écrit par W.D. Gann. Cet outil utilise des concepts mathématiques et des théories de Gann pour réaliser une analyse précise du marché. Il utilise les carrés de 144, 90, 52 et aussi le carré de 9. De plus, il intègre la méthode du  pour le carré de 9 et sa relation avec les canaux et le modèle en étoile de ce carré.

Manuel d'Utilisateur et Application :

Avant d'utiliser cet indicateur, il est recommandé de lire le manuel d'utilisateur et de contacter en cas de questions. Le manuel complet est disponible sur notre site web.

Vous pouvez acheter la version complète pour MT5 ou tester la version gratuite pour MT4. Les liens vers les deux versions sont disponibles.

Fonctionnalités Principales et Fonctions :

L'indicateur de Carré Gann offre un ensemble complet d'outils pour l'analyse du marché, en utilisant des concepts géométriques et des théories de Gann pour des décisions précises. Les principales fonctionnalités sont les suivantes :

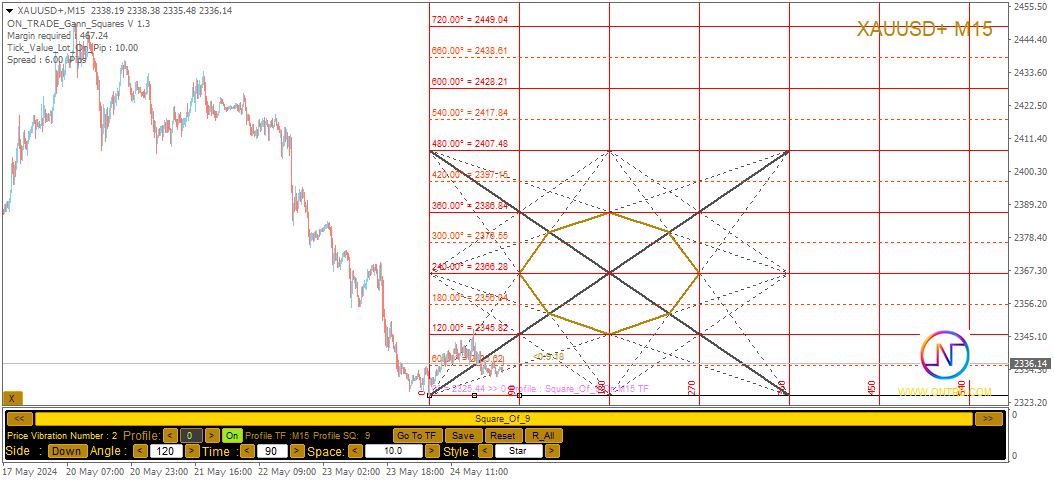
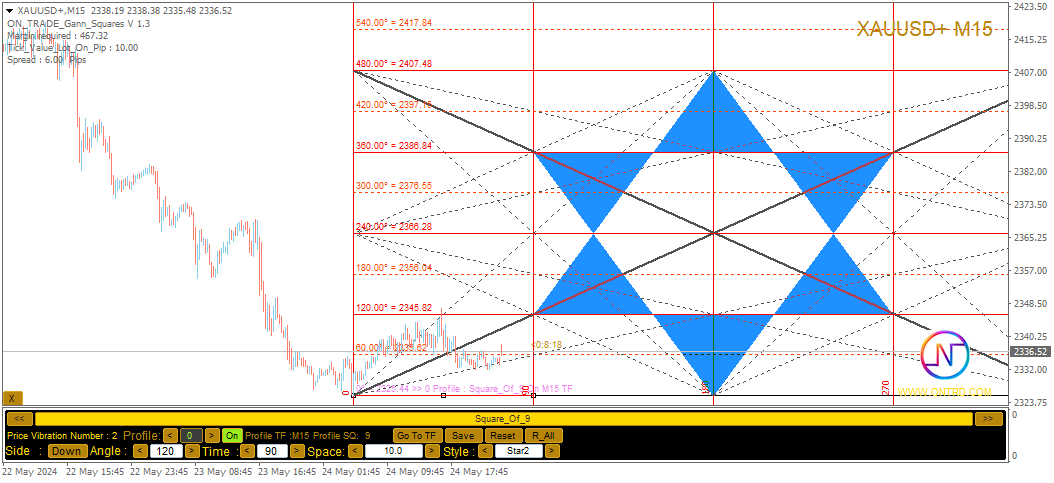
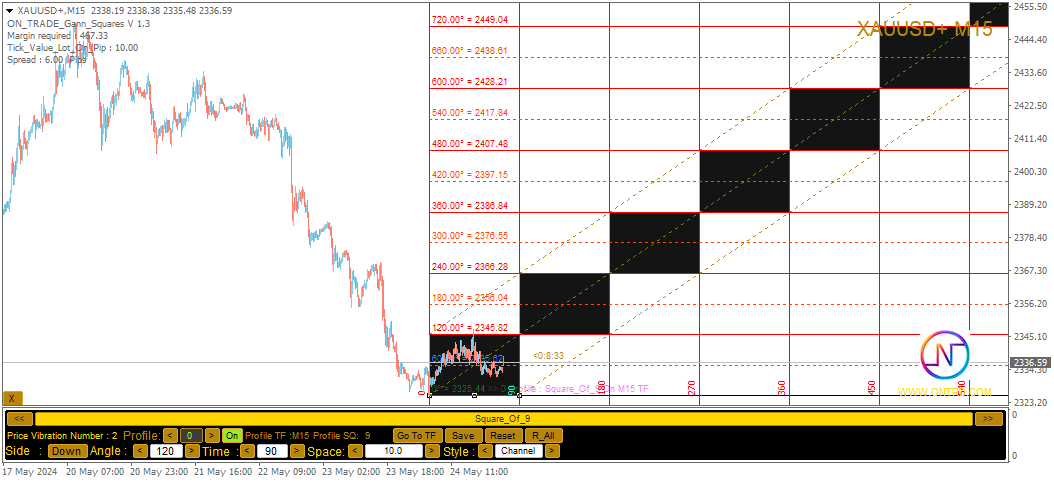
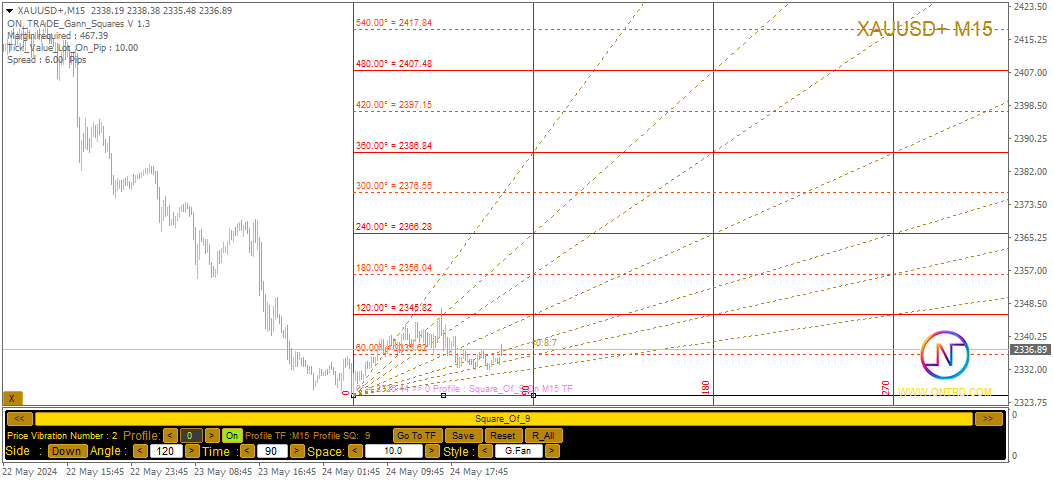
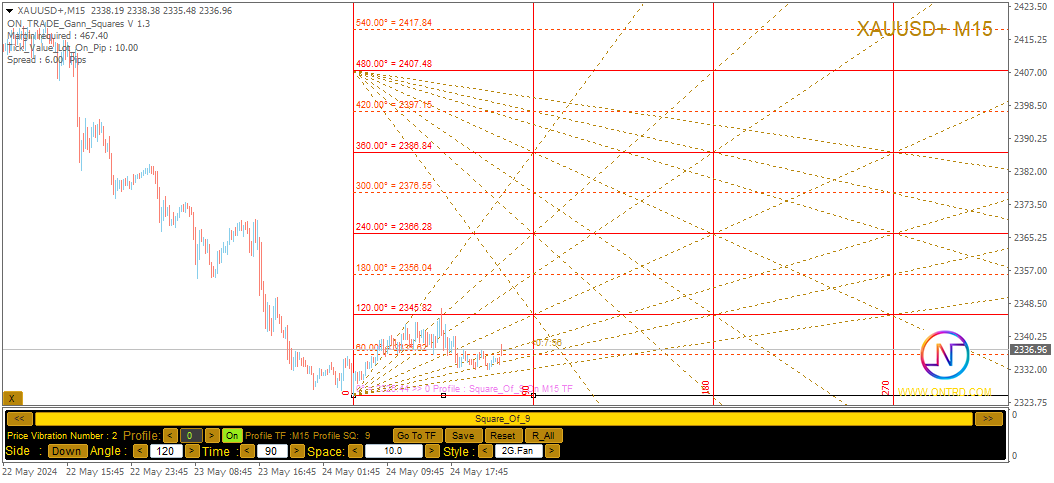
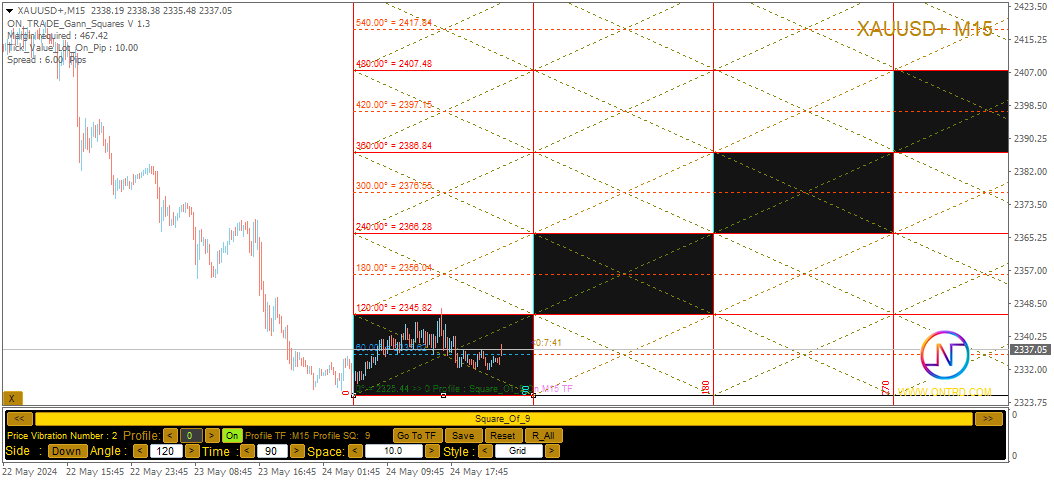
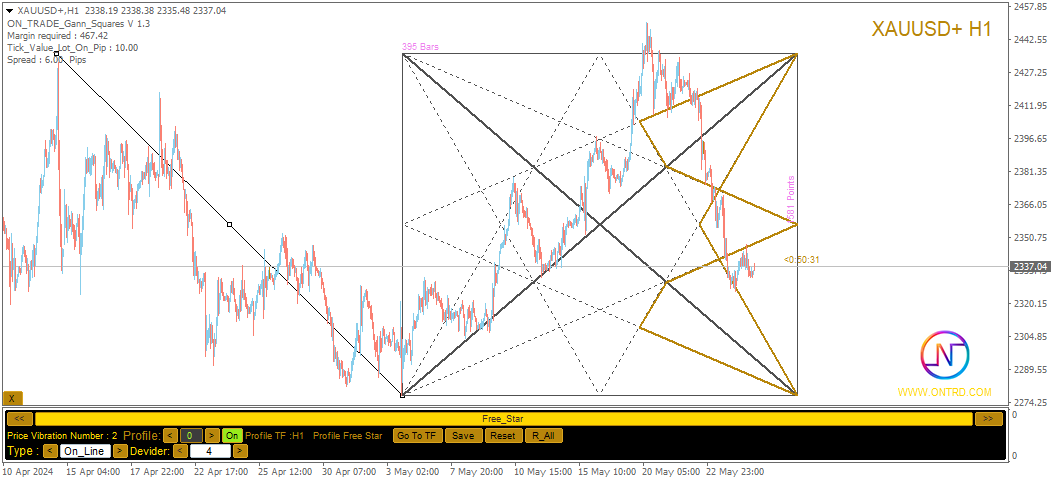
  1. Analyse du Carré de 9 : L'indicateur peut dessiner différents éléments tels que des lignes horizontales, des modèles en étoile, une grille et des éventails de Gann pour le carré de 9. Cela permet de visualiser des concepts géométriques de Gann sur le graphique.

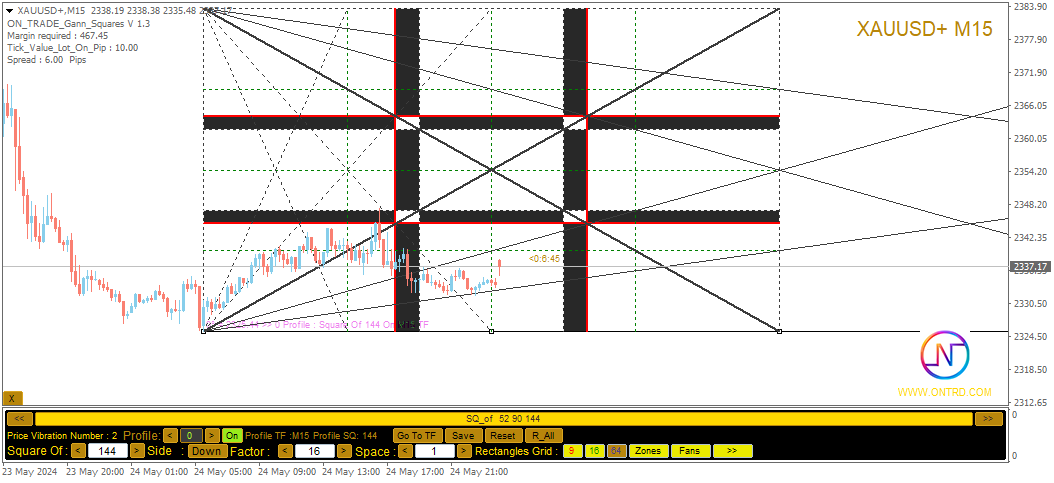
  2. Carrés de Gann : L'indicateur dessine les carrés de Gann de 52, 90 et 144 pour visualiser la relation entre les mouvements de prix et ces carrés.

  3. Étoiles de Gann Libres : L'indicateur peut dessiner des étoiles de Gann libres directement sur le graphique. Cela offre un outil dynamique pour identifier des changements potentiels de tendance et des points de retournement.

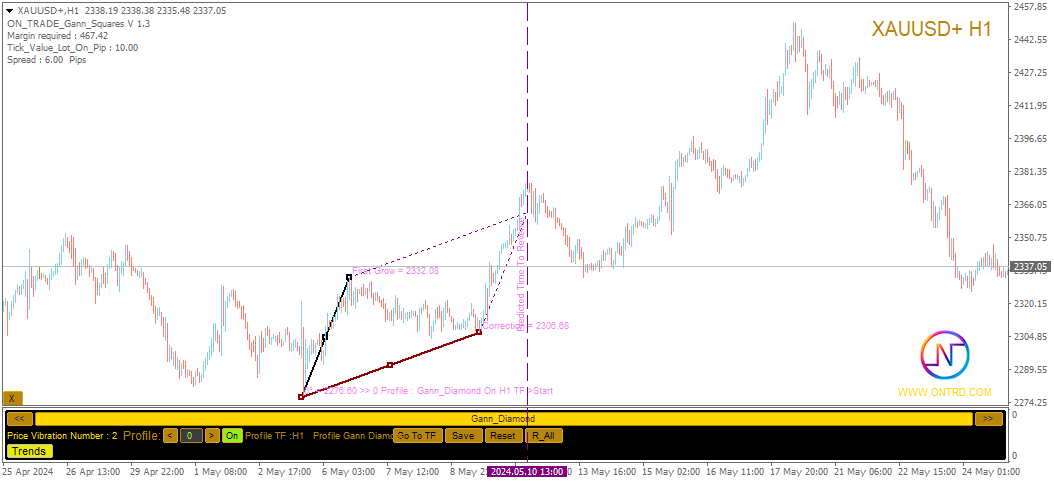
  4. Diamant de Gann : En plus d'autres éléments, l'indicateur peut également dessiner le diamant de Gann pour identifier des motifs uniques.

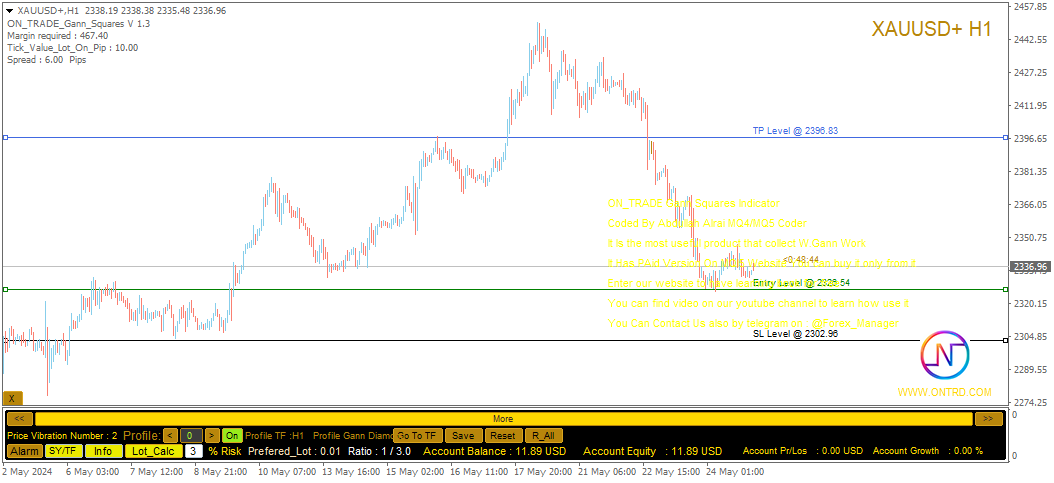
  5. Calculateur de Lots : L'indicateur comprend un calculateur pour déterminer la meilleure taille de lot pour vos transactions.

  6. Panneau Convivial : L'indicateur dispose d'un panneau convivial qui vous permet de passer entre différentes options, notamment "Carré 144/90/52", "Carré 9", "Étoile de Gann Libre", "Diamant de Gann", "Outils de Numérologie", "Calculateur de Lots" et "Informations Comptables".

  7. Gestion des Données : Toutes les actions de l'indicateur sont enregistrées dans le profil de trading, vous permettant de charger ou de supprimer ces données à tout moment. Vous pouvez également réinitialiser toutes les données enregistrées en un clic.

Personnalisation et Paramètres :

L'indicateur de Carré Gann offre une large gamme de paramètres pour personnaliser l'apparence et le comportement. Vous pouvez ajuster les paramètres pour les angles, les carrés, les étoiles, les canaux, les lignes horizontales, etc., y compris les couleurs, les styles et les largeurs.

Résumé :

L'indicateur de Carré Gann est un outil polyvalent pour les traders intéressés par les analyses de Gann et les concepts numériques. En combinant les principes mathématiques et les concepts géométriques de Gann, les traders peuvent identifier des opportunités de trading potentielles et prendre des décisions précises. Pour tirer pleinement parti de cet outil, nous vous recommandons de consulter les tutoriels vidéo disponibles sur notre site web et de lire les ressources PDF fournies.

Tout outil de trading nécessite une compréhension de son application efficace, ainsi qu'une formation avec des données historiques et le suivi des situations actuelles du marché. Tout comme tout indicateur ou stratégie de trading, une gestion responsable des risques est essentielle.


Produits recommandés
Cet indicateur est un indicateur d'analyse automatique des vagues, parfait pour le trading pratique ! Cas... Remarque :   je n'ai pas l'habitude d'utiliser des noms occidentaux pour l'évaluation des vagues. En raison de l'influence de la convention de dénomination de Tang Lun (Tang Zhong Shuo Zen), j'ai nommé la vague de base comme   un stylo   et la bande d'onde secondaire comme   un segment   . en même temps, le segment a la direction de la tendance.Le   segment de tendance principal   est no
Pyro Trend
Oleksii Ferbei
Pyro Trend is a new product that allows you to identify the current market phase (uptrend, downtrend or flat). The indicator is applicable for any data and periods. The middle of the trend wave, as well as the edges, are places of special heat and market behavior; when writing the indicator, an attempt was made to implement precisely finding the middle. Pyro Trend is a trend indicator that uses an original calculation algorithm. This indicator paints arrows in different colors depending on the
Introduction to Fractal Pattern Scanner Fractal Indicator refers to the technical indicator that makes use of the fractal geometry found in the financial market. Fractal Pattern Scanner is the advanced Fractal Indicator that brings the latest trading technology after the extensive research and development work in the fractal geometry in the financial market. The most important feature in Fractal Pattern Scanner is the ability to measure the turning point probability as well as the trend probabi
Algo Pumping MT4
Ihor Otkydach
4.94 (16)
PUMPING STATION – Votre stratégie personnelle «tout compris» Nous vous présentons PUMPING STATION – un indicateur Forex révolutionnaire qui transformera votre façon de trader en une expérience à la fois efficace et passionnante. Ce n’est pas seulement un assistant, mais un véritable système de trading complet, doté d’algorithmes puissants pour vous aider à trader de manière plus stable. En achetant ce produit, vous recevez GRATUITEMENT : Fichiers de configuration exclusifs : pour un réglage auto
Pisces TheProfitZone "Pisces TheProfitZone MT4 Indicator Powered byFxGangster" This indicator will calculate new support and resistant zone everyday, and that give us a trading zone such as thats telling us TP and SL, So it still telling us for where should the price will go reach? Fore Example. Uptrend : If Price can stay upper a Line and price close higher above a Line, then the price will continue go up to reach next Line. Downtrend : If Price can't pass to stay upper a Line and the price
RSI Jurik
Augustine Kamatu
Introducing RSI Jurik—an innovative indicator designed to revolutionize your forex trading strategy by combining custom moving averages based on the Relative Strength Index (RSI) with the MetaTrader 4 indicator, RSI. Jurik moving averages are renowned for their accuracy and reliability in analyzing price movements in the forex market. They provide traders with smoother representations of price action, reducing noise and offering clearer signals for identifying trends and potential reversals.
FREE
Elliott Wave Trend was designed for the scientific wave counting. This tool focuses to get rid of the vagueness of the classic Elliott Wave Counting using the guideline from the template and pattern approach. In doing so, firstly Elliott Wave Trend offers the template for your wave counting. Secondly, it offers Wave Structural Score to assist to identify accurate wave formation. It offers both impulse wave Structural Score and corrective wave Structure Score. Structural Score is the rating to sh
Signal Eskiya
Vitalii Zakharuk
Signal Eskiya, in addition to channel lines, reflects entry signals in the form of arrows. Trading strategies using the channel indicator belong to the classic methods of technical analysis, are easy to execute, and therefore available even to beginners. Price ranges work equally well on any trading assets and timeframes, they can be used both independently and with additional confirmation from oscillators and market volumes. American traders say: “Trend is your friend”, which means “Trend is
Cupid Signal Fx
Damrongwit Kongtong
The principle of this indicator is very simple: detecting the return point with Stochastic Oscillator, then monitoring the trend by using the Moving Average and finally predicting BUY and SELL signal with arrows, alerts and notifications. The parameters are fixed and automatically calculated on each timeframe. Example: If you install indicator on EURUSD, the indicator will detect the return point when the Stochastic Oscillator show "cross up" of the main line/signal line at the below position of
Sell Signall
Dmitriy Kashevich
This indicator is named so for a reason, because it will show the reverse side of the market. It has several math indicators built in that are tuned to show the best signals for currency pairs! Ideally proved to be in work on the M5-M15 no more and no less! Only at the same time it shows up to 86.5% of correct signals! The settings include the colors of the arrows, the alert, and the same parameters so that you can reconfigure the indicator and trade on cryptocurrency and raw materials! If
Introduction to Harmonic Volatility Indicator Harmonic Volatility Indicator is the first technical analysis applying the Fibonacci analysis to the financial volatility. Harmonic volatility indicator is another level of price action trading tool, which combines robust Fibonacci ratios (0.618, 0.382, etc.) with volatility. Originally, Harmonic Volatility Indicator was developed to overcome the limitation and the weakness of Gann’s Angle, also known as Gann’s Fan. We have demonstrated that Harmonic
Moving Pivot Average    The pivot indicator compares the selected period with its counterpart from the previous period. The indicator uses very flexible algorithm for pivot value calculating. It allows you to allocate in days a certain time intervals (custom bars) and calculate the average pivot value based on High, Low and Close prices of these bars. How many custom bars will be taken into account is determined by the "Days" setting. The pivot line can be considered an average trend line and us
This is  a dashboard indicator that displays the Average Level of each selected currency pairs that filters and gives us a signal for overbought (>=90%) or if price at extreme peak above 90, and/or oversold (<=10%) or if price at extreme peak below 10. The calculation is using Relative Strength Index default periods (2 & 9) applied to three different higher time frames H4,D1,&W1. This won't change or altered even if you change symbol or switch to lower time frames or even in monthly and year
This Indicator is use the ZigZag to calculate the Upper and  Lower Bound and the uptrend and the downtrned. Red for downtrend, Green for uptrend and Yellow is for the horizontal trend this horizontal trend also bookmarked the upper limited and the lower limited the the price swings.  Or in simple the Support and the Resistance level. However, You may use the Heikin Ashi to confirm the trend of the buy sell signal above. I cannot guarantee the win rate, Nevertheless, you must study well the timef
Introduction to Chart Pattern MT Chart Pattern MT is a chart pattern scanner to detect the triangle pattern, falling wedge pattern, rising wedge pattern, channel pattern and so on. Chart Pattern MT uses highly sophisticated chart pattern detection algorithm. However, we have designed it in the easy to use with intuitive user interface. Chart Pattern MT will show all the patterns in your chart in the most efficient format for your trading. You do not have to do tedious manual pattern detection an
Dear traders I am happy to introduce to you my new tool called "Brilliant Oscillator" Indicator. This is one of the indicators that can be used as a stand alone indicator. WHAT I LIKE ABOUT THIS TOOL IS Fast and reliable signals Purpose The purpose of this tool is to assist both newbie and Advanced traders to analyze the market with high level of accuracy in both bearish and bullish market trends. The inputs In the input section you will be able to change colors of the indicator only. Currency p
I speak in Hungarian. Magyarul beszélek benne. - You can find the indicator by my name. Which is in the picture and the video. On mql5.com.  " Utam MA High Low" - Megkeresheti az indikátort a nevemnél. Ami a képen és a videóban van. Az mql5.com-on.  " Utam MA High Low" Első felvétel. https://www.youtube.com/watch?v=YzmcyO50YdM&amp ;ab_channel=GyulaKlein (Első felvétel.   https://www.youtube.com/watch?v=FfqvT-i9TPk&feature=youtu.be Első felvétel. https://www.youtube.com/watch?v=MapbQrJ0uPU&t=
Cet indicateur fonctionne en conjonction avec la théorie des vagues d'Elliott de deux manières : Mode automatique : Dans ce mode, l'indicateur détectera automatiquement les cinq vagues motrices sur le graphique conformément à la théorie des vagues d'Elliott. Il fournira des prédictions et identifiera les zones potentielles de retournement. De plus, il a la capacité de générer des alertes et des messages push pour informer les traders des développements importants. Cette fonctionnalité automatiqu
My indicator is 1000%, it never repaints, it works in every time period, there is only 1 variable, it sends notifications to your phone even if you are on vacation instead of at work, in a meeting, and there is also a robot version of this indicator With a single indicator you can get rid of indicator garbage It is especially suitable for scalping in the m1 and m5 time frames on the gold chart, and you can see long trends in the h1 time frame.
Algo Trading Indicaor  With this indicator , you’ll have zones and trends that hight probability the price will reverse from it. so will gives you all the help that you need  Why should you join us !?  1-This indicator is logical since it’s working in previous days movement , to predict the future movements. 2-Algo trading indicator will help you to draw trends which is special and are too strong than the basics trend , trends will change with the frame time that you work on . 3-We can use
Fibonacci Currency Strength Meter (FCSM) Early Access Sale!! This new product is still in the process of adding new features and settings. For early bird buyers. The Price will be 50% Sale. In a few weeks, the product will be done. Go Grab your copy while it's still cheap. More details will be added soon. Things to be added. Alert Levels Mobile and Email Alert From it's name, Fibonacci Currency Strength Meter is a combination of Fibonacci levels and Currency Strength Meter. The plot of Fibona
Le Capteur de Tendance : La Stratégie du Capteur de Tendance avec Indicateur d'Alerte est un outil d'analyse technique polyvalent qui aide les traders à identifier les tendances du marché et les points d'entrée et de sortie potentiels. Elle présente une stratégie dynamique de Capteur de Tendance, s'adaptant aux conditions du marché pour une représentation visuelle claire de la direction de la tendance. Les traders peuvent personnaliser les paramètres selon leurs préférences et leur tolérance a
FREE
Order Squeeze
Sara Sabaghi
5 (1)
Order Squeeze Easy to use indicator to predict the market movement with calculated HIGH important levels. These levels are calculated in the lowest time frame with candle details. Ind calculates the quantity of market tick, volume per tick, and orders per candle. So with this statistical data, you catch the important price levels that supply and demand in the market are attractive for sellers and buyers. Institutes and banks trade with huge order lots and they need a lot of sellers for their BU
Discover the Power of Trend Strength Pro Unlock a new level of clarity in your trading with Trend Strength Pro , the ultimate tool for visualizing market momentum. Stop guessing and start seeing the true strength of a trend with a single glance. Our elegant and intuitive indicator helps you make smarter, more confident trading decisions. Key Advantages & Features Instantly See Trend Strength : Our color-coded histogram tells you whether the trend is getting stronger or weaker. Green means moment
FREE
Market Profile
Artem Titarenko
5 (1)
The "Market Profile" indicator displays the profiles and volumes of periods – weekly, daily, session (8-hour), 4-hour, hour, summary. The VAH/VAL price area is automatically highlighted by a dotted line for each profile (except for the summary). The indicator includes chroma Delta, which colors the profile areas. The areas of prevailing Buys is colored in green, that of Sells - in red. The intensity histogram features blue/red respectively. In the filter mode, the indicator displays the volume a
The Momentum Standard/Hidden Divergence indicator will plot the momentum, and will also identify and plot standard (regular) divergences between the indicator and the price action, OR it can be set to identify and plot hidden (reverse) divergences between the indicator and the price action. The divergences themselves are implemented as lines (default green for bullish divergence and red for bearish divergence) drawn in the indicator pane. If activated via the Inputs dialog, alerts will be genera
I recommend you to read the   product's blog  (manual) from start to end so that it is clear from the beginning what the indicactor offers. This multi time frame and multi symbol supply and demand zone dashboard indicator sends alerts when the price has reached a supply/demand zone. It is also possible to use it to be alerted about regular double tops/bottoms instead of zones. It can be used with all time frames from M1 to MN. It is possible to use RSI, divergence (MACD, OsMA, RSI or Awesome) a
Voenix
Lorentzos Roussos
4.58 (12)
Motifs harmoniques , scanner et commerçant  Patrons inclus : Modèle ABCD Motif Gartley Motif chauve-souris Modèle de chiffrement Modèle 3Drives Motif cygne noir Motif cygne blanc Motif Quasimodo ou motif Over Under Modèle de chauve-souris alternative Motif papillon Motif de crabe profond Motif crabe Motif requin Motif FiveO Motif tête et épaules Motif triangle ascendant Modèle un deux trois Et 8 motifs personnalisés Voenix est un scanner de modèles harmoniques multi-périodes et multi-paires, pr
Mean Reversion Supply Demand Indicator Mean Reversion Supply Demand is the indicator to detect the important supply demand zone in your chart. The concept of supply demand trading relies on the quantity mismatching between buying and selling volumes in the financial market. Typically, supply demand zone serves to predict the turning point. The wave pattern, for any supply demand zone to work as an successful trade, looks like the price must touch the base zone, move away and then return to zone
ABCD Harmonic Patterns
Mehmet Ozhan Hastaoglu
Thanks to this indicator, you can easily see the new ABCD harmonic patterns in the chart. If the two price action lengths are equal, the system will give you a signal when it reaches the specified level. You can set the limits as you wish. For example, You can get the signal of the price, which occurs in the Fibonaci 38.2 and 88.6 retracements, and then moves for the same length, at the level you specify. For example, it will alarm you when the price reaches 80% as a percentage. In vertical
Les acheteurs de ce produit ont également acheté
Dynamic Forex28 Navigator
Bernhard Schweigert
5 (6)
Dynamic Forex28 Navigator - L'outil de trading Forex de nouvelle génération. ACTUELLEMENT 49 % DE RÉDUCTION. Dynamic Forex28 Navigator est l'évolution de nos indicateurs populaires de longue date, combinant la puissance de trois en un : Advanced Currency Strength28 Indicator (695 avis) + Advanced Currency IMPULSE avec ALERT (520 avis) + CS28 Combo Signals (Bonus). Détails sur l'indicateur https://www.mql5.com/en/blogs/post/758844 Qu'offre l'indicateur de force de nouvelle génération ? Tout
Supply and Demand Dashboard PRO
Bernhard Schweigert
4.8 (20)
Actuellement 20% de réduction ! Ce tableau de bord est un logiciel très puissant qui fonctionne sur plusieurs symboles et jusqu'à 9 horizons temporels. Il est basé sur notre indicateur principal (Best reviews : Advanced Supply Demand ).   Le tableau de bord donne une excellente vue d'ensemble. Il montre :  Les valeurs d'offre et de demande filtrées, y compris l'évaluation de la force de la zone, Les distances en pips vers/et dans les zones, Il met en évidence les zones imbriquées, Il donne 4
Actuellement 20% de réduction ! La meilleure solution pour tout débutant ou trader expert ! Ce logiciel de tableau de bord fonctionne sur 28 paires de devises. Il est basé sur 2 de nos principaux indicateurs (Advanced Currency Strength 28 et Advanced Currency Impulse). Il donne un excellent aperçu de l'ensemble du marché Forex. Il montre les valeurs de l'Advanced Currency Strength, la vitesse de mouvement des devises et les signaux pour 28 paires de devises dans tous les (9) délais. Imaginez
The Super Arrow Indicator provides non-repainting buy and sell signals with exceptional accuracy. Key Features No repainting – confirmed signals remain fixed Clear visual arrows: green for buy, red for sell Real-time alerts via pop-up, sound, and optional email Clean chart view with no unnecessary clutter Works on all markets: Forex, gold, oil, indices, crypto Adjustable Parameters TimeFrame Default: "current time frame" Function: Sets the time frame for indicator calculation Options: Can be set
RelicusRoad Pro
Relicus LLC
4.63 (106)
Combien de fois avez-vous acheté un indicateur de trading avec de **grands backtests,** une **preuve de performance sur compte réel** avec des chiffres fantastiques et des **statistiques partout**, mais après l'avoir utilisé, vous **finissez par vider votre compte ?** Vous ne devriez pas faire confiance à un signal seul, vous devez savoir pourquoi il est apparu en premier lieu, et c'est ce que RelicusRoad Pro fait de mieux ! Manuel de l'utilisateur + Stratégies + Vidéos de formation + Groupe pr
Core Principles Swing Angle Measurement   Swing angles are calculated by measuring the degree of price movement between swing highs and lows over time. Steeper angles (typically 45+ degrees) indicate stronger momentum and potentially more profitable trading opportunities. Traders use various timeframes to identify these patterns, from intraday charts to weekly swings. Momentum Confirmation   High degree swing angles often coincide with strong momentum indicators like RSI breakouts, volume spikes
Gold Channel is a volatility-based indicator, developed with a specific timing algorithm for the XAUUSD pair, which consists of finding possible corrections in the market. This indicator shows two outer lines, an inner line (retracement line) and an arrow sign, where the theory of the channel is to help identify overbought and oversold conditions in the market. The market price will generally fall between the boundaries of the channel. If prices touch or move outside the channel it is a tradi
BinaryUniversal
Andrey Spiridonov
BinaryUniversal is a signal indicator for binary options and Forex. In its work, the indicator uses a complex algorithm for generating signals. Before forming a signal, the indicator analyzes volatility, candlestick patterns, important support and resistance levels. The indicator has the ability to adjust the accuracy of the signals, which makes it possible to apply this indicator for both aggressive and conservative trading. The indicator is set in the usual way, it works on any time period and
WeSpread
Anchor Trading S.R.L.S.
The We-Spread mt4 indicator is a spread trading tools and it is suitable for those who want to study the markets with a different approach to the contents that are normally available in online trading bookstores. I think the Spread Trading strategy is one of the best I've ever used in the last few years. This is a unique indicator for spread trading because allow you to study till 3 spreads in one time. What is Spread Trading on forex The Spread Trading is the study of the strength of 2 currency
Presenting one-of-a-kind Gann Indicator for XAUUSD IQ Gold Gann Levels is a non-repainting, precision tool designed exclusively for XAUUSD/Gold intraday trading. It uses W.D. Gann’s square root method to plot real-time support and resistance levels, helping traders spot high-probability entries with confidence and clarity. William Delbert Gann (W.D. Gann) was an exceptional market analyst whose trading technique was based on a complex blend of mathematics, geometry, astrology, and ancient calcul
Gold Titan King Scalper
Dodong Christian Arnon
Indicator Description GOLD TITAN KING SIGNAL INDICATOR High-Precision Gold Scalping Buy/Sell Signals – Manual Trading Assistant Overview The Gold Titan King Signal Indicator is a manual trading assistant tool designed for high-frequency scalping on Gold (XAUUSD) and other major pairs. It generates clear BUY/SELL signals with precise entry levels, along with adjustable Stop Loss and Take Profit levels displayed directly on the chart. ️ This tool is NOT an EA. It does not execute trades
Currency Strength Meter 1:Correctly identifying trends in foreign exchange investments is critical. 2:TrendSymbolOneClick quickly detects and displays trends that have just begun and those that have already been in place for an extended period of time. 3:There is also a USD JPY EUR GBP AUD NZD strength function. 4:Volatility allows you to know exactly when there is a major market move. 5:You can save time in your market analysis by using Trend Symbol One Click. 6:Analysis available from 1 minut
Offer 249 down from 350 for the next 3 copies. then back to 350 $ Are you tired of using outdated indicators that leave you guessing where to set your profit targets? Look no further than the AK CAP Opening Range Breakout Indicator. This powerful tool is backed by a US patent and has already helped countless traders pass funded challenges like FTMO. We use it daily on our prop traders and internal funds, and now it's available to you as well. The calculation behind the indicator is incredibly a
L'indicateur « Dynamic Scalper System » est conçu pour la méthode de scalping, permettant de trader au sein des vagues de tendance. Testé sur les principales paires de devises et l'or, il est compatible avec d'autres instruments de trading. Fournit des signaux pour l'ouverture de positions à court terme le long de la tendance, avec un support supplémentaire pour les fluctuations de prix. Principe de l'indicateur : De grandes flèches déterminent la direction de la tendance. Un algorithme de gén
#EasyWayTradePanel indicator for #MetaTrader4 , is trade assistants for manual trading in any #currency in #FOREX , #CRYPTOCURRENCY as #Bitcoin , #Ethereum , #Lightcoin and more. Also is EasyWay to use for #COMMODITY as #Gold , #Silver , #Oil , #Gas ...... and #CFDs . When installed on the chart in your chosen time frame and trading tool, the indicator automatically draws the following custom indicators used in the EasyWayTradePanel trading strategy. 1) Zigzag_Extreme_Indicator, 2) Regression_C
Detailed blog post with screenshots here: https://www.mql5.com/en/blogs/post/762513 Features: This scanner will show: NRTR Basket Trading Trend direction Last NRTR Switch (breakout) - number of bars and if it was a high volume bar How many bars has the SR stayed steady for When price last entered an NRTR shadow When price bounced off the NRTR shadow back inside NRTR Explained: https://www.mql5.com/en/blogs/post/762509 Basket Trading If you like to basket trade, then you can set multiple scann
NAM Order Blocks
NAM TECH GROUP, CORP.
3.67 (3)
MT4 Multi-timeframe Order Blocks detection indicator. Features - Fully customizable on chart control panel, provides complete interaction. - Hide and show control panel wherever you want. - Detect OBs on multiple timeframes. - Select OBs quantity to display. - Different OBs user interface. - Different filters on OBs. - OB proximity alert. - ADR High and Low lines. - Notification service (Screen alerts | Push notifications). Summary Order block is a market behavior that indicates order collection
Il s'agit d'une stratégie simple basée sur les niveaux BREAKOUT et FIBONACCI. Après une évasion, soit le marché poursuit son mouvement directement vers les niveaux 161, 261 et 423 ou, revient au niveau de 50 % (également appelé correction) et continue ensuite très probablement le mouvement dans la direction initiale jusqu'aux niveaux 161, 261 et 423. La clé du système est la détection de la barre de répartition indiquée par un objet rectangle vert (UP TREND) ou rouge (DOWN TREND). Au momen
L'indicateur MT4 "Binary Smart Eye" est conçu pour fournir des signaux de trading pour les options binaires et les marchés forex, fonctionnant sur une large gamme d'unités de temps, de M1 à W1. Il emploie une stratégie propriétaire qui combine des niveaux de tendance, une moyenne mobile intelligente et des périodes de trading optimisées pour identifier les points d'entrée potentiels. Voici une ventilation de ses principales caractéristiques : Analyse multi-timeframes : La polyvalence de l'indica
Signal GoldRush Trend Arrow L'indicateur GoldRush Trend Arrow Signal fournit une analyse précise et en temps réel des tendances, spécialement conçue pour les scalpers à haute vitesse et à court terme sur la paire XAU/USD. Conçu spécialement pour les intervalles de temps d'une minute, cet outil affiche des flèches directionnelles indiquant clairement les points d'entrée, ce qui permet aux scalpers de naviguer en toute confiance dans des conditions de marché volatiles. L'indicateur se compose
Enigmera
Ivan Stefanov
5 (8)
ENIGMERA : Le cœur du marché Important : La démo de MQL5.com fonctionne dans le Strategy Tester et peut ne pas refléter pleinement les fonctionnalités d'Enigmera. Consultez la description, les captures d'écran et la vidéo pour plus de détails. N'hésitez pas à m'envoyer un message si vous avez des questions ! Le code de l'indicateur a été entièrement réécrit. La version 3.0 ajoute de nouvelles fonctionnalités et corrige les bugs accumulés depuis le lancement de l'indicateur. Introduction Cet in
Beast Super Signal
Dustin Vlok
4.73 (89)
Vous recherchez un puissant indicateur de trading forex qui peut vous aider à identifier facilement des opportunités de trading rentables ? Ne cherchez pas plus loin que le Beast Super Signal. Cet indicateur basé sur les tendances facile à utiliser surveille en permanence les conditions du marché, en recherchant de nouvelles tendances en développement ou en sautant sur celles existantes. Le Beast Super Signal donne un signal d'achat ou de vente lorsque toutes les stratégies internes s'alignent e
The Positive Zone
Ellan Dirgantara Tholkhah
Specialized Binary Options Indicator.  The name positive zone is inspired by how this indicator ultimately made me feel, which is "Positive". Not only from a emotional stand point but from a financial one. Once you start earning from this indicator it will give you that runners high, or that nice buzz after you finish a warm cup off coffee in the morning and blast on Cumbawamba's on hit wonder Tubthumping. The key to winning Binary Option is patience and controlling your emotion . This is why th
[V 1.00] MTF NRPA 5 Moving Average RTD est sorti ! Tableau de bord en temps réel avec flèche non repeinte. Si vous recherchez le meilleur indicateur de moyenne mobile, vous êtes sur la bonne page. Généralement, les gens installeront deux moyennes mobiles car l'intersection des deux moyennes mobiles (le croisement) déterminera la direction de la prochaine tendance des prix. Si la moyenne mobile rapide croise la moyenne mobile lente et rapide> lente, la tendance est à la hausse. Inversement, si
Supreme Commander
Ramon Sobrevals Arce
4.13 (8)
The indicator of the indicators. The Most Powerful Technique to Determine Forex Trend Strength in 2023. We have perfected Supreme Commander that it calculates an average of the selected indicators (up to 16) and the selected timeframe (all) with the result of a single trend that indicates the potential of buying and selling.  It includes the following indicators: Accelerator/Decelerator oscillator Average Directional Movement Index Awesome oscillator; Bulls and Bears  Commodity Channel Index; De
Scientific trade
Aleksey Ivanov
5 (1)
An extremely convenient indicator that truly makes the process of making money on the exchange easy. It is based on the scientifically rigorous theory of the market developed by the author, the beginning of which is presented here .                The full algorithm of this indicator operation is presented in the article .               The indicator calculates the most probable price movement trajectory and displays it on the chart. Based on the predicted price movement trajectory
Linear Trend Predictor - Un indicateur de tendance qui combine des points d'entrée et des lignes de support de direction. Fonctionne sur le principe de franchissement du canal des prix haut/bas. L'algorithme de l'indicateur filtre le bruit du marché, prend en compte la volatilité et la dynamique du marché. Capacités de l'indicateur  À l'aide de méthodes de lissage, il montre la tendance du marché et les points d'entrée pour l'ouverture d'ordres d'ACHAT ou de VENTE.  Convient pour déterminer l
PTS Precision Index Oscillator V2
PrecisionTradingSystems
5 (1)
L'oscillateur de l'indice de précision (Pi-Osc) de Roger Medcalf de Precision Trading Systems La version 2 a été soigneusement recodée pour être ultra-rapide à charger sur votre graphique, et quelques autres améliorations techniques ont été incorporées pour améliorer l'expérience. Le Pi-Osc a été créé pour fournir des signaux de synchronisation de trading précis conçus pour trouver des points d'épuisement extrêmes, les points auxquels les marchés sont contraints d'aller simplement pour élimin
IQ FX Gann Levels a precision trading indicator based on W.D. Gann’s square root methods. It plots real-time, non-repainting support and resistance levels to help traders confidently spot intraday and scalping opportunities with high accuracy. William Delbert Gann (W.D. Gann) was an exceptional market analyst, whose trading technique was based on a complex blend of mathematics, geometry, astrology, and ancient mathematics which proved to be extremely accurate. Download the Metatrader 5 Version M
Ultimate Arrow Indicator - Votre outil pour réussir dans le trading ! Vous en avez assez des outils qui promettent beaucoup mais offrent peu ? Notre Ultimate Arrow Indicator pour MT4 est la solution définitive qui propulsera votre trading à un niveau supérieur. Cet indicateur a été conçu avec une précision chirurgicale pour vous offrir des signaux clairs, fiables et sans compromis. Voici pourquoi Ultimate Arrow Indicator est le choix idéal pour les traders expérimentés et les débutants : Perform
Plus de l'auteur
"Cet indicateur détecte les entrées basées sur la théorie du motif Bystra et fournit les valeurs d'entrée pour placer des ordres limités avec des niveaux cibles et des niveaux de stop. Cela vous permet de calculer votre pourcentage de risque. Notes : Cet indicateur dispose de tampons qui permettent son utilisation dans les Expert Advisors (EAs). Il est important de pratiquer une bonne gestion de l'argent en travaillant avec ce produit. Lorsque vous changez votre cadre temporel, L'indicateur sauv
Indicateur technique pour détecter de forts schémas d'action sur les prix : Pin Bar, Inside Bar et Outside Bar Introduction : Dans le domaine de l'analyse technique, les schémas d'action sur les prix servent d'indicateurs essentiels des mouvements potentiels du marché. Nous avons développé un indicateur technique sophistiqué qui simplifie l'identification de solides schémas d'action sur les prix sur les graphiques. Notre indicateur est spécialisé dans la détection de trois schémas essentiels : l
ON Trade Pivoteer
Abdullah Alrai
4 (1)
Introducing the Pivot Point Selector Indicator: Your Ultimate Tool for Custom Pivot Levels Are you ready to take your trading to the next level? Say hello to the Pivot Point Selector Indicator, a game-changing tool that puts you in control of your pivot levels. This innovative indicator empowers you to choose three specific points that will determine the pivot level calculations, giving you unparalleled customization and precision in your trading strategy. Key Features and Benefits: Custom Pivo
FREE
ON Trade Pivots is A technical indicator that Draws all Pivot levels depending on time frame that defined in settings. Notes It will be good tool for all traders who use pivot levels in their trades. Let me inform you that this indicator draw this level as buffers not as objects then you can connect it easily to EA. This indicator allow you to find pivots levels for any time frame not only daily you are free to choose time frame from settings. Parameters Use_System_Visuals - Enable /Disable Sy
FREE
Présentation de l'indicateur Calculateur de Prix du Gramme d'Or Vous souhaitez être constamment informé du prix de l'or dans votre devise locale ? Ne cherchez plus, l'indicateur Calculateur de Prix du Gramme d'Or vous offre un outil novateur qui vous permet de calculer en temps réel le prix par gramme d'or dans votre devise locale préférée. Avec cet indicateur, vous pouvez exploiter les informations financières pour prendre des décisions éclairées. Caractéristiques Principales : Prix Localisé de
FREE
Cet indicateur a pour but de représenter visuellement le canal Donchian sur votre graphique de trading. Le canal Donchian est un outil technique simple utilisé pour représenter la plage entre le plus haut et le plus bas sur une période spécifiée. Cet indicateur améliore l'analyse visuelle des mouvements de prix en offrant des indications sur les points potentiels de rupture et de continuation de tendance. Le canal Donchian peut être appliqué aussi bien sur l'unité de temps actuelle que sur une u
FREE
"Cet indicateur est un outil simple de détection de tendance. Vous pouvez l'utiliser avec votre stratégie pour obtenir de bonnes entrées, comme en mode scalping. Il dessinera un canal autour du prix, qui s'étendra à mesure que le temps augmente. Pendant les périodes personnalisées, il reviendra au point de départ de l'expansion en fonction d'un algorithme qui prend en compte le temps et le prix ensemble. Vous pouvez acheter à la limite inférieure du canal après l'apparition de signes de retourne
Cet indicateur fonctionne en conjonction avec la théorie des vagues d'Elliott de deux manières : Mode automatique : Dans ce mode, l'indicateur détectera automatiquement les cinq vagues motrices sur le graphique conformément à la théorie des vagues d'Elliott. Il fournira des prédictions et identifiera les zones potentielles de retournement. De plus, il a la capacité de générer des alertes et des messages push pour informer les traders des développements importants. Cette fonctionnalité automatiqu
Cet indicateur propose une méthode robuste d'analyse de marché centrée autour du concept de "l'outil de canal de régression". En utilisant cet outil, les traders peuvent obtenir un contrôle exceptionnel sur le canal de régression de leur graphique, ce qui leur permet de prendre des décisions de trading plus éclairées. L'outil de canal de régression est un instrument puissant dans la boîte à outils d'un trader. Il est conçu pour fournir des informations précieuses sur les tendances des prix et le
"Nous vous présentons notre puissant indicateur Forex conçu pour améliorer votre stratégie de trading et vous fournir des informations précises sur les tendances du marché. Cet outil innovant utilise un algorithme personnalisé sophistiqué qui analyse minutieusement les mesures des bougies, en effectuant des ajustements pour obtenir une précision optimale. Le résultat ? Un ensemble de flèches précisément tracées sur votre graphique, indiquant des points d'entrée stratégiques. La génialité derrièr
Cet indicateur a été conçu pour détecter et visualiser les vagues diamant de Gann, un modèle spécifique dérivé de la théorie de Gann. Il offre aux traders des informations sur les potentielles inverses de marché en traçant des points (P) basés sur les points ABC du modèle. De plus, l'indicateur trace des lignes verticales à partir des points prédits (P) pour aider les traders à identifier plus facilement les points potentiels d'inversion. Fonctionnalités de l'indicateur : Use_System_Visuals : Ce
L'indicateur "Fibo Star" a été conçu pour tracer les éventails de Fibonacci sous forme d'étoiles sur votre graphique. Ces éventails de Fibonacci sont un outil puissant pour analyser les mouvements de prix et peuvent fournir des aperçus des niveaux potentiels de support et de résistance. Cet indicateur est équipé d'un panneau de contrôle convivial qui vise à simplifier le processus de dessin et de configuration des éventails, permettant ainsi d'économiser du temps et des efforts. Mode d'emploi :
L'indicateur de "Force des Devises" est un outil puissant conçu pour fournir aux traders des informations sur la force relative de différentes devises sur le marché des changes. En calculant et en représentant la force de chaque devise en fonction de son intervalle de temps spécifié, cet indicateur offre aux traders la possibilité d'identifier des opportunités de trading potentielles, notamment lorsque des divergences significatives ou des croisements sont observés. Principales caractéristiques
Cet indicateur détectera les motifs harmoniques tracés sur le graphique à l'aide de méthodes manuelles et automatiques. Ajoutez votre avis, s'il vous plaît. Notes: Cet indicateur dispose d'un panneau de contrôle et il enregistrera chaque réglage (graphique et unité de temps). Vous pouvez le réduire pour avoir plus d'espace sur le graphique et vous pouvez appuyer sur le bouton de fermeture pour masquer toutes les données de l'indicateur sur le graphique si vous préférez travailler avec d'autres o
L'indicateur de motif de chandelier japonais Hikkake est un outil spécialisé conçu pour identifier et détecter les motifs d'action des prix Hikkake qui se forment sur un graphique. Ces motifs sont basés sur le concept d'une fausse rupture à partir d'une barre intérieure, ce qui conduit souvent à des opportunités de trading potentielles. La principale fonction de l'indicateur est d'analyser les cinq dernières bougies sur le graphique et de déterminer si elles présentent les caractéristiques du mo
Indicateur de Support et Résistance Basé sur la Numérologie pour MetaTrader Introduction : Découvrez une nouvelle dimension dans l'analyse technique avec notre Indicateur de Support et Résistance Basé sur la Numérologie pour MetaTrader. Cet outil unique exploite la puissance de la numérologie pour identifier des niveaux clés de support et de résistance sur vos graphiques, vous offrant des informations précieuses sur les mouvements potentiels des prix. Concepts Clés : La Numérologie dans le Tradi
Découvrez une approche révolutionnaire du trading avec l'indicateur Shepherd Numerology Levels. Cet outil innovant combine la sagesse ancienne de la numérologie avec les techniques de trading modernes pour vous aider à identifier des niveaux de support et de résistance clés sur vos graphiques. En utilisant la méthode du carré de neuf, cet indicateur offre une perspective unique sur les mécanismes du marché et vous permet de prendre des décisions de trading plus éclairées. Principales caractérist
Présentation de l'indicateur ON Trade Numerology Mirror : Découvrez les motifs inverses cachés grâce à la numérologie Explorez une nouvelle dimension dans l'analyse technique avec l'indicateur ON Trade Numerology Mirror. Cet outil innovant exploite la sagesse ancienne de la numérologie pour identifier des niveaux clés de retournement dans vos graphiques. En reconfigurant les chiffres dans des positions inversées, cet indicateur révèle des motifs cachés qui ont le potentiel d'indiquer des retourn
Présentation de l'indicateur astronomique pour MT4 : Votre compagnon de trading céleste ultime Êtes-vous prêt à élever votre expérience de trading à des hauteurs célestes ? Ne cherchez pas plus loin que notre indicateur astronomique révolutionnaire pour MT4. Cet outil innovant transcende les indicateurs de trading traditionnels en exploitant des algorithmes complexes pour vous fournir des aperçus astronomiques inégalés et des calculs de précision. Un univers d'informations à portée de main : Con
Introducing the ON Trade Melad Pattern Indicator: Enhance Your Trading Strategy with Breakout Patterns Discover the power of the ON Trade Melad Pattern Indicator—an intuitive tool designed to elevate your trading decisions by detecting and highlighting breakout patterns on your charts. This indicator is your key to identifying crucial breakout points and potential trend shifts with simplicity and precision. Key Features: Breakout Pattern Detection: The ON Trade Melad Pattern Indicator focuse
This indicator will give you entries as result of scalping strategy that will be applied on 14 symbols in same time and you are able to be notified with this entries  Note :   This indicator for scalping on 5 minutes timeframe only . How to use it : 1-Open chart and adjust settings (edit symbols names as your platform names , activate the alert system if you need it . 2-Wait for any signal you have it from this scanner you will have it as alert and as notification and you will see it on board
This indicator gives you the signal of real cross on stochastic indicator. This indicator is easy to attach to an ea. This indicator will work best on All time frames. Arrow appears depending on many algorithms that study the cross parameters. Indicator properties Use_System_Visuals: enable/disable visual styles. Stochastic_K_Period. Stochastic_D_Period. Stochastic_Slowing. Use_Notifications: enable/disable Push Notifications. Use_Alert: enable/disable Alerts. Use_E_Mail: enable/disable Email n
Présentation de "ON Trade VSA" - Votre outil ultime d'analyse de volume et de répartition ! Découvrez la puissance de l'Analyse de Volume et de Répartition (VSA) avec notre indicateur de pointe - "ON Trade VSA". Le VSA est une méthodologie puissante utilisée par les traders pour évaluer la force du marché, identifier les tendances et prendre des décisions éclairées. Explorons les fonctionnalités clés qui font de "ON Trade VSA" un outil indispensable pour votre arsenal de trading : Bougies de Vol
Nous vous présentons ON Trade Waves Patterns Harmonic Elliot Wolfe, un indicateur avancé conçu pour détecter divers types de schémas sur le marché à l'aide de méthodes manuelles et automatiques. Voici comment il fonctionne : Schémas Harmoniques : Cet indicateur peut identifier les schémas harmoniques qui apparaissent sur votre graphique. Ces schémas sont essentiels pour les traders qui pratiquent la théorie du trading harmonique, telle qu'elle est décrite dans le livre de Scott Carney "Harmonic
This product is a part of  ON Trade Waves Patterns Harmonic Elliot Wolfe you can test free version on EURJPY from this link  Wolf Waves Indicator Découvrez les Vagues de Loup - Votre Outil de Trading Ultime ! Êtes-vous à la recherche d'un outil puissant pour repérer facilement les Vagues de Loup sur n'importe quel intervalle de temps ? Ne cherchez plus ! Notre indicateur de Vagues de Loup fait le travail sans effort. Voici pourquoi il est parfait pour vous : Caractéristiques principales : Déte
This program serves as an effective tool for sending messages through a Telegram bot using the MetaTrader platform. It enables you to send your trading recommendations related to the orders you open on the trading platform directly to your Telegram channel or group. These messages may include details about open trades and can be accompanied by illustrative images of the orders. Alternatively, they can be configured to be without images based on your preferences. This means that if you are the ow
Présentation de notre nouvel indicateur : [ON Trade Breakout Zone] Outil d'analyse de marché simple mais puissant pour tous les traders ! Convient aussi bien aux professionnels qu'aux traders débutants Êtes-vous prêt à dynamiser votre stratégie de trading ? Notre dernier indicateur est conçu pour simplifier l'analyse du marché et donner du pouvoir aux traders de tous niveaux. Que vous soyez un professionnel chevronné ou que vous débutiez tout juste, [ON Trade Breakout Zone] est la clé p
User Manual Download link: https://ontrd.com/our-books/ For all who are asking about indicator  ON Trade Numerology Station It obtain about 16 numerology strategies it make together completed unit control your trading . Basic strategies to work with it are 3 strategies statistics about them are the following : 1. RBA levels success rate more then 95%. 2. FF more then 96%  3.RBA SUN 98% We will not say 100 % as they are .. Ratio rates as following :  1.Rba levels more then 1/3 to 1/6 . 2.FF MORE
Ce produit vous permettra de contrôler vos commandes et votre compte avec de nombreuses fonctions 1- il calculera la taille correcte du lot en fonction de la taille de votre compte/taille SL/valeur en points de paire pour 1 taille de lot. 2- il vous donnera la situation actuelle des commandes en fonction des emplacements des lignes (cible sl tp). 3- il déplacera toutes les commandes cible/sl en appuyant sur 1 bouton. 4- il vous donnera des informations sur votre compte et la marge nécessair
ON Trend
Abdullah Alrai
5 (1)
Maîtrisez la puissance du trading de tendance Cet indicateur est conçu pour les traders débutants, intermédiaires et professionnels. Il simplifie le processus de trading en détectant avec précision la tendance réelle sur n'importe quelle paire de devises. Pourquoi choisir cet indicateur ? - Trading simplifié : Plus besoin d'analyses complexes. Chargez l'indicateur sur le graphique, attendez les signaux d'achat ou de vente, et vous n'avez plus besoin de surveiller le graphique toute la journé
Filtrer:
Aucun avis
Répondre à l'avis